Review Article
Engineering Approaches in the Diagnosis of Sleep Apnea
|
Hatice
Bilgili 1* 1 Assistant
Professor
Dr., Engineering Faculty, Biomedical Engineering Department, Inönü
University, Malatya, Turkey 2 MSc Student, Engineering Faculty,
Biomedical Engineering Department, Inönü University, Malatya, Turkey |
|
|
|
ABSTRACT |
||
|
Sleep apnea is a sleep disorder that significantly affects human life and occurs as a result of repeated obstructions in the respiratory system lasting at least 10 seconds during sleep. The most common type, Obstructive Sleep Apnea (OSA), affects the upper respiratory tract, whereas Central Sleep Apnea (CSA) occurs due to dysfunction in the respiratory control center in the brain. Sleep apnea manifests with symptoms such as fatigue upon awakening, snoring, and daytime sleepiness. If left untreated, it may lead to serious health complications including stroke, cardiovascular diseases, and hypertension. Polysomnography (PSG) is the most widely used diagnostic method for sleep apnea. However, this test involves several limitations in terms of time consumption, patient comfort, and financial cost. Therefore, there is an increasing need for alternative engineering-based diagnostic support methods to complement polysomnography. Recent advancements in Biomedical Engineering, Electrical and Electronics Engineering, and Software Engineering have enabled the development of portable, cost-effective, and highly compatible systems for sleep apnea detection. Sleep apnea can be detected through physiological measurements, including electroencephalography (EEG), electrocardiography (ECG), electrooculography (EOG), and oxygen saturation levels. Biomedical signal analysis of the obtained data is enabled by artificial intelligence methods and machine learning algorithms. Moreover, integrating wearable devices with the Internet of Things (IoT)-based telehealth enables continuous monitoring of patients in their homes. This study highlights the significance of engineering-based solutions in sleep apnea diagnosis and highlights their contributions to modern healthcare technologies. Keywords: Sleep Apnea, Artificial Intelligence,
Polysomnography, PSG, Wearable Devices |
||
INTRODUCTION
Sleep is a complex
biological process that plays a crucial role in human life by affecting both
physical and mental health. It constitutes approximately one-third of human
life and is essential for maintaining overall health and well-being. Sleep
disorders are generally associated with an increased risk of mental
disturbances and various physiological symptoms in the human body. Among sleep
disorders, sleep apnea is one of the most frequently encountered conditions.
Sleep apnea is characterized by a reduction or complete cessation of airflow
due to obstruction in the respiratory tract during sleep Altun (2015). In general, this disorder is diagnosed
using polysomnography (PSG), which is a time-consuming and costly procedure
typically conducted in sleep laboratories Mendonca et al. (2018). Polysomnography involves the recording of
multiple physiological signals, including brain activity, respiratory
parameters, and cardiovascular events, through a variety of sensors. During the
polysomnography procedure, electrodes are attached to several parts of the
body, such as the mouth, nose, head, chest, and abdomen, to record
physiological signals throughout the sleep period. By analyzing the
physiological responses and body movements occurring during sleep, clinicians
obtain information regarding apnea events Koçak et al. (2016). The recorded signals generally include
electroencephalography (EEG), electrooculography (EOG), electromyography (EMG),
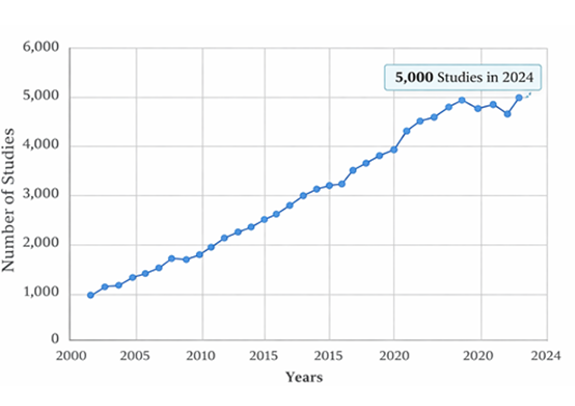
oxygen saturation (SpO₂), and electrocardiography (ECG) data Altun (2015). Due to factors such as unhealthy lifestyle
conditions, obesity, and stress, the prevalence of sleep apnea has been
increasing worldwide, which has attracted growing attention from researchers
and accelerated the number of related studies over the years Figure 1.
|
Figure 1
|
|
Figure 1 The Annual Number of Scientific
Studies Related to Sleep Apnea from 2000 |
The signals
obtained from polysomnography are evaluated by sleep specialists to diagnose
apnea events. But doing this can be a tedious, slow process. To overcome these
barriers, diagnostic methods aided by computer software have been increasingly
developed in recent years Altun (2015).
Types of Sleep Apnea
Sleep apnea is generally classified into two main types--obstructive sleep apnea (OSA) and central sleep apnea (CSA). A complex form of sleep apnea (including both OSA and CSA) may also occur.
1)
Obstructive
Sleep Apnea (OSA): OSA is a
condition in which breathing during sleep is interrupted because the upper
respiratory tract becomes blocked or collapsed. These respiratory breaks
usually occur during recurrent episodes lasting at least 10 seconds, during
which blood oxygen saturation decreases by more than 4% Şener and Güner (2024). OSA is often accompanied by frequent
awakenings and the formation of fragmented sleep, excessive daytime tiredness,
and several symptoms. If left untreated, OSA may increase the risk of serious
and potentially life-threatening complications.
2)
Central
Sleep Apnea (CSA) : Central Sleep Apnea (CSA) occurs when the brain fails to
transmit appropriate signals to the respiratory muscles responsible for
breathing. This condition may arise from various factors that impair the
ability of the brainstem, which connects the brain to the spinal cord and
regulates essential physiological functions such as heart rate and respiration.
In central sleep apnea, breathing stops for at least 10 seconds during sleep,
and unlike obstructive sleep apnea, the individual also lacks respiratory
effort during these episodes Köktük and Tu (2003). This type of apnea accounts for
approximately 5–10% of sleep apnea cases Evlice (2012).
3)
Mixed
Sleep Apnea: Mixed sleep
apnea is a form of apnea that initially begins as central apnea and
subsequently continues as obstructive apnea. In central apnea, respiratory
effort ceases simultaneously with the apnea event. However, in mixed apnea,
respiratory effort initially stops and then resumes before the apnea episode
completely ends. These events result in a reduction in airflow of approximately
30% Yıldız (2021).
Overview of Polysomnography (PSG) Tests
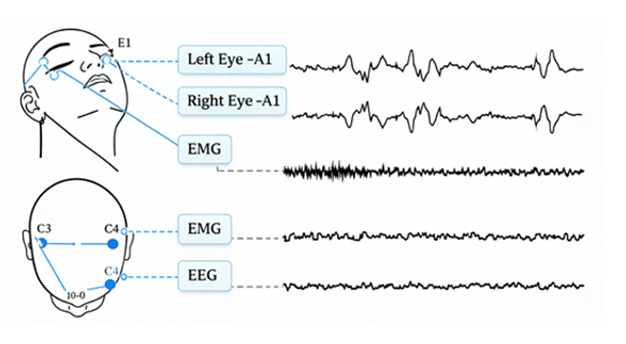
Polysomnography (PSG), considered the gold standard in the diagnosis of sleep disorders, enables the simultaneous recording of physiological parameters occurring in the human body during sleep. Through this test, the biological processes of an individual are examined in detail, providing valuable information about sleep stages and wakefulness patterns. In this method, the sleep process is first divided into epochs, which are subsequently scored for analysis. These stages are typically identified through the analysis of electroencephalography (EEG), electrooculography (EOG), and electromyography (EMG) signals, as illustrated in Figure 2, Köktürk (2013).
|
Figure 2 |
|
Figure 2 Signals Recorded During Polysomnography Köktürk (2013) |
Polysomnography
allows the detection of abnormalities in respiration and other vital
physiological functions during sleep. However, an important consideration is
that interpreting polysomnography results requires significant effort, as well
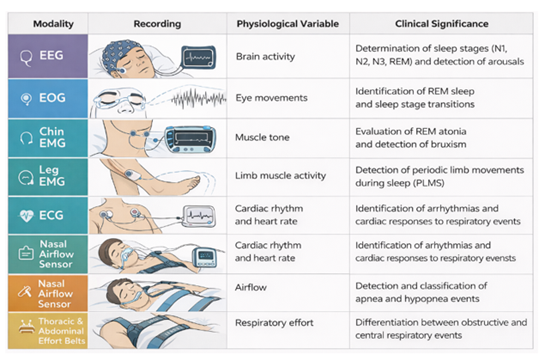
as specialized expertise and clinical experience in sleep medicine Haghighat et al. (2025). Furthermore, the characteristics and
comparison of the recordings obtained from polysomnography are presented in Table 1.
|
Table 1
|
|
Table 1 Physiological Signals Recorded During
Polysomnography and Their Clinical Significance |
Polysomnography,
as mentioned previously, is performed in hospital sleep laboratories under the
supervision of trained specialists. During the polysomnography test, several
electrodes and sensors (e.g., EEG, ECG, EOG, EMG) are attached to the patient
in the sleep laboratory. Instead of sleeping in their own bed, patients are
required to sleep in the sleep center while connected to these electrodes and
monitoring devices. This situation may cause discomfort for many patients, and
a considerable number of individuals experience difficulty falling asleep in
such an unfamiliar environment. Since patients struggle to go back to normal
sleep in a new environment, this could contribute to inaccurate and unreliable
data. Moreover, PSG devices are not portable and cannot be used in home
environments. Furthermore, the availability of such devices in hospitals is
limited to the laboratories of specially designated sleep centers, so in most
medical institutions, there are few or none. Consequently, patients spend a long
time waiting for their appointments, which may seriously affect their health.
In private hospitals, the cost of PSG assessments would also impose a
significant financial burden on patients. These limitations have contributed to
a call for alternative diagnostic methods. Recent work has therefore emphasized
implementing fewer sensors, computer-embedded systems, and home-based
surveillance for sleep apnea diagnosis Uçar et al. (n.d.).
Artificial Intelligence in Sleep Apnea Diagnosis
The practice of
diagnosing and treating diseases is an interconnected process within healthcare
systems. Early diagnosis and treatment not only help improve understanding of
health issues and provide better outcomes for the public but also lower
healthcare costs. They also enhance both healthcare efficiency and
effectiveness. At this point, the role of Artificial Intelligence (AI) systems
in improving healthcare services is becoming increasingly significant. AI
technologies assist physicians in the diagnostic process, greatly easing it and
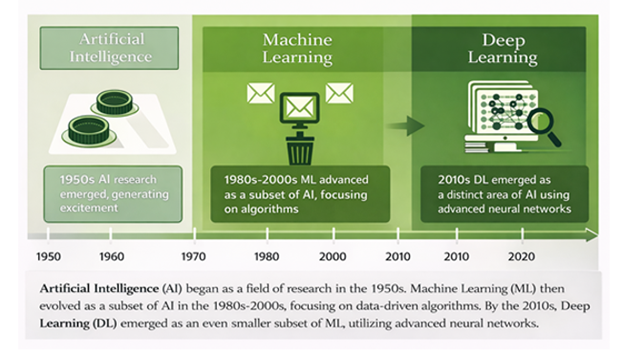
enabling treatment to start sooner, making success more achievable Akalın and Veranyurt (2022). Since its foundation in the mid-20th
century Figure 3, artificial intelligence has been highly
successful and is now widely used across many fields, including medicine, defense,
and economics. AI capabilities have become accessible to individual users in
recent years. AI refers to computer programs that mimic human intelligence
(i.e., learning, reasoning, and analyzing) Akalın and Veranyurt (2022). AI research involves multidisciplinary work
including computer engineering, philosophy, cognitive science, and electronics.
Artificial intelligence covers broad areas such as artificial neural networks,
expert systems, fuzzy logic, and genetic algorithms Pirim (2006). AI algorithms can analyze large datasets to
predict and make decisions, and these models are known as flexible
computational models. These computational methods have expanded alongside
recent technological advancements. Included among these are machine learning
and deep learning, advanced techniques that have become key components of
modern AI technologies Metlek and Kayaalp (2020).
|
Figure 3 |
|
Figure 3 The Historical Development of Artificial
Intelligence Metlek and Kayaalp (2020) |
These approaches
can even learn complex patterns directly from data in contrast to classical
rule-based approaches Belk et al. (2023). AI models in healthcare have significantly
improved the analysis of complex medical data and have provided substantial
support in both diagnostic and treatment processes. Apart from helping doctors
diagnose, artificial intelligence systems also contribute to telemedicine
applications by providing treatment recommendations that physicians can
evaluate more quickly. Digital interaction between healthcare providers and
patients is also quicker. In otolaryngology, machine learning and deep learning
predictive models have been increasingly used to improve the accuracy and
sensitivity of sleep apnea diagnostic methods. These models are good for
analyzing large datasets and perform quite well for screening and diagnosis Giorgi et al. (2025).
Machine Learning
A fundamental technique for achieving artificial
intelligence, in which systems learn automatically from experience and adapt
accordingly, making AI applications more effective and intelligent. Machine
learning is a subfield of AI concerned with building systems that learn and
improve as they process more data, typically at a larger scale. Artificial
intelligence is the umbrella term for systems or machines that mimic human
intelligence. Thus, in the scientific literature, machine learning and
artificial intelligence are often combined. With rapidly advancing technology
and development trends, concepts such as big data, cybersecurity, artificial
intelligence, and machine learning have become increasingly widespread. As the
volume of information created in modern digital environments continues to grow
exponentially, analyzing and deriving meaning from these large datasets has
become a major challenge. In recent years, patterns and relationships have
emerged from the analysis of large datasets and predictive modeling of future
outcomes. Humans also have predictive skills based on experience and prior
observations. However, human decision-making is often influenced by emotional
factors, and limited ability to manage vast amounts of data can hinder accuracy
and efficiency. Unlike human decision-making, machine learning models can
analyze such datasets rapidly and systematically, yielding more reliable and
objective decision-making. The main objective of machine learning is to model
human cognitive processes through computational algorithms. Several algorithms
are used in this case to build predictive models from available data. In some
applications, the data volume is extremely large, which may result in
computational speed and processing time issues. However, these challenges can
be mitigated with data classification and preprocessing methods Tosunoğlu et al. (2021). Machine learning has
also become widely used in medicine, assisting physicians in diagnosing
diseases. By training algorithms on patient health data, machine learning
systems can identify trends and provide predictions that aid clinicians in
diagnosis. These systems have been called clinical decision support systems (CDSS)
Karakoyun and Hacıbeyoğlu (2014). Data plays a critical
role in machine learning applications, where algorithms use data-driven
insights to identify disease features. Datasets are divided broadly into
labeled and unlabeled data. The former type is used during the training stage
of an algorithm, while the latter is used during testing to determine model
performance Bilgin (2017). The choice of the
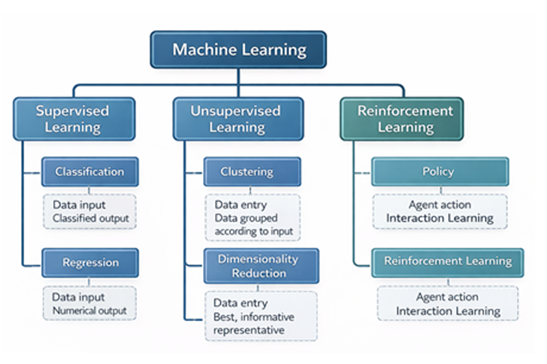
algorithm depends on the characteristics of the data. Machine learning
algorithms are typically used to perform tasks such as clustering,
classification, and prediction. These algorithms are generally classified into
three main learning paradigms: supervised learning, unsupervised learning, or
reinforcement learning. The main machine learnings are illustrated in Figure 4. Both input and output
data are fed to the system under supervised learning, whereas only input data
are provided under unsupervised learning. Reinforcement learning, on the other
hand, aims to train a system to take the best actions by analyzing feedback
signals of the input.
|
Figure 4 |
|
Figure 4 Conceptual Overview of Machine Learning
Paradigms, Illustrating the three Primary Approaches—Supervised Learning,
Unsupervised Learning, and Reinforcement Learning—and their Representative
tasks Tosunoğlu et al. (2021) |
Choosing the optimal algorithm is an important challenge
for practitioners and researchers, as the model can only perform its best if it
is compatible with the dataset. Popular machine learning algorithms include
k-Nearest Neighbors (kNN), Naïve Bayes classifiers, decision trees, logistic
regression, support vector machines (SVM), and artificial neural networks (ANN)
Tosunoğlu et al. (2021). In supervised
learning, the system is trained on labeled data, where each training example
contains both an input and a corresponding output value. This process involves
evaluating the trained model on a test dataset to measure its accuracy. The
trained algorithm assigns predicted outputs to previously unseen test data
using the patterns in the training dataset. Often, the problem is solved in the
context of classification tasks, where the model tries to assign instances to
predefined categories. Different classification techniques may be used
depending on the problem and the dataset. Thus, the number of labeled samples
needed for training may vary by application. In unsupervised learning, the
model is trained on unlabeled data, unlike supervised learning. No
classification can be performed directly, as the data's output labels are
unknown Bilgin (2017). Unsupervised
learning, by contrast, seeks to identify hidden patterns or structures in data.
The most popular form of unsupervised learning is clustering, in which data
samples are grouped by similarity in their features. To minimize dataset
complexity, clustering techniques are often used alongside feature extraction
and dimensionality reduction methods to capture relationships among variables.
These analyses generate input features for supervised learning models Bilgin (2017).
Wearable Technology and Sleep Disorders
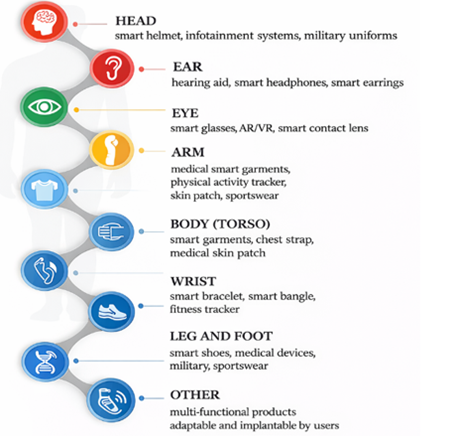
Wearable devices
are components of wearable technology that monitor health, activity, security,
and communication, among other functions. These devices include smartwatches,
fitness bands, smart glasses, and sensor-based health-monitoring systems, all
of which can aggregate and analyze physiological information Yıldız (2025).
|
Figure 5 |
|
Figure 5 Overview of Wearable Technology Devices by
Body Placement and their Associated Applications Kılıç (2017). |
A major benefit of
wearable devices deployed in health care is that they can be worn throughout
the day, collecting continuous, real-time data. The rapidly escalating costs of
healthcare services, as well as limited access to healthcare in underdeveloped
regions and shortages of healthcare personnel, have also motivated the use of
wearable technologies in the healthcare sector. The data captured by these
devices Figure 5 can be used to monitor an individual's
health in real-time, reducing healthcare costs and inefficiencies in healthcare
utilization, and is therefore valuable for patients, healthcare professionals,
and society as a whole Gün and Bayzan (2024). Recently, novel wearable devices have been
developed that can detect physiological signals through body contact and send
the acquired information to physicians. With the advent of wearable
technologies, the traditional patient-physician relationship has changed.
Through wearables, a number of sensors contribute to the diagnostic procedure
by enabling individuals to continuously monitor their health conditions. Such
devices facilitate the identification of suitable therapeutic measures for
patients and enable doctors to gather patient information remotely. Most
hospitals have medical records related to patients’ health conditions.
Incorporation of these records, together with physiological and sensor data
collected from wearable devices, could yield richer, more complete data to aid
the treatment process Aydın (2019).
|
Figure 6 |
|
|
|
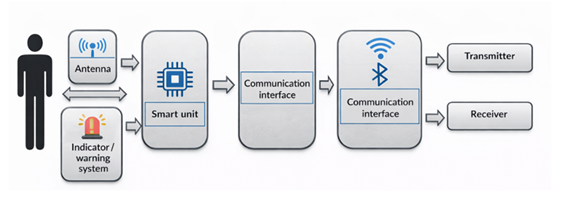
Figure 6 Wearable Healthcare Monitoring System with
Data Acquisition, Processing, and Wireless Transmission Modules Özcan (2025) |
Figure 6 shows the general architecture of the
wearable monitoring system. Sensors turn an individual’s physiological signals
into electrical signals. Digital signals are sent straight to the smart
processing unit, while analog signals are converted through an analog-to-digital
converter to digital before being sent to the smart unit. Then the acquired
data is subsequently transmitted to the evaluation center for further analysis
and interpretation Özcan (2025). In recent years, the growing prevalence of
the Internet of Things (IoT) has enabled both healthcare professionals and
patients to benefit from improved monitoring capabilities. Wearable devices,
such as cardiac monitoring bands, enable patients to track their heart activity
without visiting a hospital. Physiological data derived from these devices
allows physicians to perform clinical assessments without extensive diagnostic
testing. As a result, patients can monitor their health status despite of location.
Furthermore, wearable technologies allow patients to monitor their health
conditions without requiring prolonged hospital stays or occurring often visits
to healthcare facilities. This approach mahe less unnecessary healthcare costs
and patient stress while decreasing the burden on healthcare systems Aydın (2019).
|
Figure 7 |
|
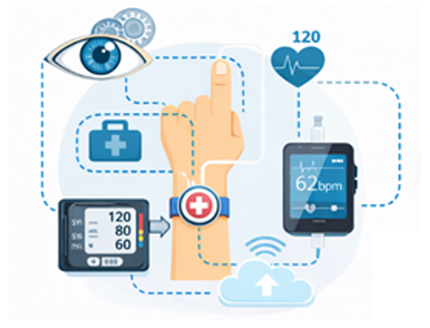
Figure 7 A Wearable Sleep-Monitoring Device for Sent
to Hysiological Signals and Remote Medical Analysis Çakır et al. (2018) |
Sleep disorders
can lead to numerous adverse effects in daily life, as well as attention
deficits, memory problems, problems in concentration, mood changes, anxiety,
and many neurological complications. These complications may cause stress,
cardiovascular diseases, and even diabetes, which can also be sources of this
kind. Among sleep disorders, sleep apnea is thought to be one of the most
serious conditions, and if left untreated, it can have life-threatening
consequences. Thus, precise diagnosis of sleep disorders and adequate
interpretation of psychophysiological data are indispensable for supporting
physicians in reaching a correct conclusion about the patient's disease
condition. Compared with the classical diagnostic approach, wearables have been
increasingly adopted for assessing sleep processes in recent years, such as
WatchPAT in Figure 7 Serçe and Ovayolu (2024).
Signal Processing Methods Used in Sleep Apnea Diagnosis
Examining studies on sleep apnea, it is evident that the research process comprises three major parts. The first stage involves obtaining biosignals directly from PSG or portable monitoring devices and applying filtering to remove noise. In the second stage, the obtained signals are preprocessed, and relevant features are extracted. The extracted features are analysed in the last step by software tools, producing diagnostic results. Several feature extraction techniques have been developed in the literature. Some of the most commonly used techniques include power spectral density (PSD), wavelet transform, and time–frequency analysis Uçar et al. (n.d.). Extracting meaningful features from acquired signals is one of the most critical steps in signal processing. There are many techniquesin the literature for analyzing features in both the time and frequency domains Balcı et al. (2021). A signal can be defined as a numerical function that represents physical changes over time; mathematically, a signal can be expressed as a function g(t) of t Öner et al. (2017). In time-series analysis, spectral analysis methods such as the Fourier transform and the the wavelet transform are frequently used to study signal characteristics Abrak and Yerci (2012).
1) Fourier Transform: The Fourier Transform is one of the most widely used techniques in signal processing, transforming signals from the time domain into the frequency domain Ersöz and Özşen (2011). It indicates both the amplitude and phase of a signal. Because of the Fourier transform's analytical power, it has become important in many scientific fields, such as engineering, medicine, and chemistry Bracewell (1989). A Fourier Transform is one of the most important methods for analyzing signals, independent of translation and scaling. The Fourier analysis of the signal data yields frequency-domain representations, enabling the identification and analysis of its frequency components. Typically, in various studies, Fourier Transform-based frequency spectra are employed to analyze information extracted from signals Hanbay (2021).
On the other hand,
stationary signals usually perform better with Fourier analysis. Fourier-based
approaches may not be sufficient for non-stationary signals, such as EEG
signals with transient spikes and complex waveform patterns Ersöz and Özşen (2011). In the latter case, wavelet analysis is an ideal alternative, as it
permits the study of localized signal characteristics in both the time and
frequency domains Walker (1997).
2)
Wavelet
Analysis: The wavelet
transform is the standard method for time–frequency signal analysis. One reason
for the popularity of this approach is that the window size can vary with the
analysis scale. At a broader window scale, the mother wavelet captures
low-frequency components of the signal. In contrast, lowering the window scale
narrows the window, making its higher-frequency components detectable. Thus,
both the low-frequency and high-frequency characteristics of the signal are
available for simultaneous analysis Walker (1997). Wavelets are finite-time oscillatory
functions with a characteristic start and ending approaching zero. Due to their
short duration and variable shape, wavelets are very useful to detect transient
changes in signals. The two key approaches in wavelet analysis are widely
adopted. One such method is the Discrete Wavelet Transform (DWT), which is
specifically capable of detecting sharp transformations in the signals. The
second application requires continuous wavelet analysis to obtain a
time–frequency description of the signal and detect changes in frequency over
time Sak and Beyen (2019).
3)
Power
Spectral Density: The Power
Spectral Density (PSD) is a signal analysis technique that characterizes the
distribution of signal power across different frequency components. This
approach defines the power of a signal as a function of frequency and
facilitates the analysis of the distribution of the signal energy in varying
frequency ranges. In fact, PSD analysis is a technique that can tell us whether
a particular frequency component is present in a signal and calculate the power
associated with those frequencies İkizler and Ekim (2025).
Selected Studies on Sleep Apnea
Sleep apnea
syndrome may lead to serious health complications if left untreated that
quality of life. For an accurate and effective diagnosis of this illness,
several methods and technological approaches have been proposed in the
literature. Generally, these approaches focus on facilitating the diagnostic
process and providing decision-support tools for physicians.
In a study, Sharma et al. (2022) developed an automated apnea detection
method to determine oxygen saturation and pulse rate signals using a pulse
oximeter. In that study, some sleep-related occurrences were labeled using the
Sleep Heart Health Study dataset, which included a variety of patient cohorts
(n = 8068, age ≥ 40 years). In this study, which used two independent
test groups and 30-second periods, a deep learning model was trained to detect
sleep apnea.
The proposed
algorithm demonstrated high performance in apnea detection, achieving an area
under the receiver operating characteristic curve (AUC-ROC) of 90.4% and an
area under the precision–recall curve of 58.9%. The model achieved the highest
sensitivity for obstructive apnea detection at 93.4%, followed by 90.5% for
central apnea detection Sharma et al. (2022).
Pépin et al. (2009) conducted a study involving 34 patients
suspected of having sleep apnea. In their research, polysomnography was
performed simultaneously with nasal pressure (NP) and Holter ECG recordings. A
healthcare specialist who was blinded to the polysomnography results analyzed
the Holter ECG and nasal pressure recordings. The apnea–hypopnea index (AHI)
obtained from polysomnography was compared with the AHI values derived from the
visual and automated analysis of Holter ECG and nasal pressure signals. Using a
randomly selected group of 10 participants as the development set, the optimal
threshold value for detecting sleep apnea (AHI > 20 events/hour in PSG) was
determined to be 35 events/hour using receiver operating characteristic (ROC)
analysis. The prospective evaluation of this threshold was then performed on 19
participants in the test set. For visually scored Holter ECG plus NP
recordings, the negative predictive value (NPV) for sleep apnea was 80%, while
the positive predictive value (PPV) reached 100%. The area under the ROC curve
was found to be 0.97. For automated analysis, the NPV was 86%, the PPV was
100%, and the area under the ROC curve was 0.85. The authors concluded that
nasal pressure recordings obtained via a Holter system could serve as an
effective screening tool for sleep-related breathing disorders in routine
cardiology practice Pépin et al. (2009).
Li et al. (2017) investigated the reliability of a pulse
oximeter system capable of automated analysis based on photoplethysmography
(PPG) signals for the diagnosis of sleep apnea. The authors compared
measurements obtained from PPG signals with those obtained through polysomnography.
In their study, PPG monitoring was performed simultaneously with overnight
polysomnography in a sleep laboratory. A total of 49 patients with suspected
sleep apnea (38 males; mean age: 43.5 ± 16.9 years; BMI: 26.9 ± 0.5 kg/m²) were
included in the study. Automated analysis was performed using only PPG and
oximeter signals. The respiratory event index derived from PPG showed a strong
correlation with the apnea–hypopnea index obtained from PSG (r = 0.935, P <
0.001). In addition, significant correlations were observed between PPG- and
PSG-derived total sleep time and oxygen desaturation index values (r = 0.418, P
= 0.003; r = 0.933, P < 0.001, respectively). Bland–Altman analysis
demonstrated good agreement between PPG and PSG measurements. The authors
concluded that pulse oximeter systems based on PPG recordings could provide
acceptable results for the diagnosis and screening of moderate and severe OSA
patients Li et al. (2017).
Nazli (2021) analyzed electrocardiography (ECG) signals
by dividing them into one-minute segments and extracting heart rate variability
(HRV) signals using the information obtained from R-peaks. Time-domain and
frequency-domain features were derived from HRV signals, and apnea
classification was performed using five different machine learning algorithms.
The highest classification accuracy (85.26%) was achieved using the Random
Forest algorithm. The highest sensitivity (78.08%) was obtained using the
k-Nearest Neighbor (kNN) algorithm, while the highest specificity (91.4%) was
achieved with the Random Forest classifier Nazli (2021).
Babur et al. (2018) proposed an apnea prediction method using
signals recorded by polysomnography during sleep. In their study, ECG signals
obtained from sleep laboratory recordings were processed using MATLAB to
predict apnea events. The analysis was based on the RR interval variations of
ECG signals. Various parameters derived from these RR intervals were used in
the analysis. As a result, by determining the power spectral density of ECG
signals, the authors achieved an apnea detection accuracy of 88.57% for
obstructive apnea and hypopnea events Babur et al. (2018).
Karamustafaoğlu et al. (2014) used electrocardiography (ECG),
electroencephalography (EEG), and electromyography (EMG) signals obtained from
sleep laboratory recordings. The aim of the study was to predict apnea events
by applying different signal processing techniques to these signals. Signals
recorded during obstructive apnea, hypopnea, and normal breathing periods were
processed in the MATLAB environment. The results obtained from the proposed
methods were compared with diagnoses made by healthcare professionals to
determine accuracy rates. The authors applied Yule–Walker, Welch, and
Periodogram methods to estimate the power spectral density of the signals. The
results indicated that determining the power density of ECG signals provided an
apnea detection accuracy of 88.3% in obstructive apnea and hypopnea cases Karamustafaoğlu et al. (2014).
Yıldız et al. (2017) investigated whether apnea events could be
automatically detected from heart sounds by training classifiers using
time-domain and frequency-domain features characterizing changes in heart
sounds during apnea events. Polysomnography recordings were obtained from 17
individuals, and heart sounds were recorded simultaneously. Machine learning
classification methods, including kNN and SVM, were applied to heart sound
features. The results indicated that the kNN classifier reached 48% accuracy
and 100% specificity, while the SVM classifier reacded 82% accuracy and 42%
specificity. The authors concluded that apnea detection based only on heart
sound signals was not sufficiently reliable Yıldız et al. (2017).
In a separate
study, Yıldız et al. (2017) developed an automatic recognition system to
detect apnea from single-channel ECG recordings. The 8-hour ECG recordings in
the study comprise 20 healthy individuals and 40 patients with apnea. A
wavelet-based algorithm was used to detect changes in RR intervals, which
represent heart rate variability. SVM and ANN algorithms were used to classify
apnea and non-apnea recordings. Here, the accuracy of the SVM classifier was
98.3%, and the ANN classifier achieved 96.7% Yıldız (2017).
Table 2 shows a summary of some studies focusing on sleep apnea detection using
physiological signals and machine learning techniques is presented.
Table 2
|
Table 2 Summary of Some Studies on Sleep Apnea. |
||||
|
Study |
Data Type / Signals |
Method / Algorithm |
Participants |
Key Results |
|
Pulse Oximetry (SpO₂ and Pulse Rate) |
SpO₂ and Pulse Rate |
Deep Learning Model |
8068 Participants |
AUC-ROC: 90.4%, Sensitivity: 93.4% OSA / 90.5% CSA |
|
Holter ECG and Nasal Pressure |
ROC-Threshold Analysis |
ROC-Threshold Analysis |
34 Patients |
NPV: 80–86%, PPV: 100%, AUC: 0.97 |
|
PPG and Pulse Oximetry |
Automated Signal Analysis |
Automated Signal Analysis |
49 Patients |
Correlation with PSG AHI, r = 0.935 |
|
ECG-Derived HRV |
Random Forest, kNN |
1-Minute Segments |
1-Minute Segments |
Accuracy: 85.26%, Sensitivity: 78.08%,
Specificity: 91.4% |
|
ECG (RR Intervals) |
Power Spectral Analysis |
Sleep Lab Data |
Sleep Lab Data |
Accuracy: 88.57% |
|
ECG, EEG, EMG |
Yule-Walker, Welch PSD |
Sleep Lab Datasets |
Sleep Lab Datasets |
Accuracy: 88.3% |
|
Heart Sound Recordings |
kNN and SVM Classifiers |
— |
17 Subjects |
kNN: 48%, SVM: 82% |
|
Single-Channel ECG |
SVM and ANN Classifiers |
8-Hour Recordings |
8-Hour Recordings |
SVM: 98.3%, ANN: 96.7% |
DISCUSSION AND CONCLUSION
The prospects of
artificial intelligence, machine learning, and wearable technologies for
diagnosing sleep apnea have been discussed, highlighting the essential role of
engineering disciplines in these areas. The results suggest that the diagnosis
of advanced sleep disorders such as sleep apnea cannot be made solely through
medical methods but also requires multidisciplinary engineering. In this regard, biomedical engineering leads
to the development of sensors for physiological signal detection and state monitoring;
electrical and electronics engineering supports data acquisition, transmission,
and hardware system design; and software engineering aids AI–based data
analysis and decision support systems. The cooperation between these
engineering disciplines accelerates diagnostic methods, making them faster,
more accessible, and more efficient while surmounting many constraints of
conventional diagnostics. Additionally, the integration of wearable and
intelligent data analysis methodologies has established the ability of
continuous evaluation and early diagnosis of sleep disorders. These
technological advances may minimize reliance on conventional lab-based
diagnostic systems and realize a more individualized approach in
patient-centered healthcare. Ultimately, different engineering fields involved
in sleep apnea diagnosis not only improve the results of the existing
diagnosis, the work of these engineering fields could also push future
advancements of medical electronics as well as healthcare technologies. For
these innovations to progress sustainably, interdisciplinary collaboration is
essential, along with engineering solutions that address clinical needs while
prioritizing patient comfort and accessibility.
ACKNOWLEDGMENTS
None.
REFERENCES
Abrak,
R. A., and Yerci, M. (2012). En Küçük Karelerle Spektral Analiz ve Fourier Tekniğinin
Karşılaştırılması. Selcuk University Journal of
Engineering Sciences, 11(1), 32–47.
Akalın, B., and Veranyurt, Ü. (2022). Sağlık 4.0 ve Sağlıkta Yapay Zekâ. Sağlık Profesyonelleri Araştırma Dergisi, 4(1), 57–64.
Altun, S. (2015). Derin Öğrenme ve Makine Öğrenmesi Yöntemleriyle Polisomnografi Sinyallerinden Uyku Evrelerinin Sınıflandırılması. Karadeniz Fen Bilimleri Dergisi, 13(2), 583–600. https://doi.org/10.31466/kfbd.1246482
Aydın,
N. (2019).
Giyilebilir Sağlık Teknolojisinin Geleceği. In XI. International
Balkan and Near Eastern Social Sciences Congress Series.
Babur, S., Bektaş, B., and Turhal, U. (2018). EKG Kayıtlarından Uyku Apnesi Hastalığının Destek Vektör Makineleri Yöntemi Kullanılarak Tespiti.
Balcı, M., Gölcük, A., Küççüktürk, S., Tasdemır, S., Vatansev, H., and Vatansev, H. (2021). Wavelet Dalgacık Dönüşümü ile Tıkayıcı Uyku Apnesi Tahmini ve Epok Sürelerinin Etkisi. Avrupa Bilim ve Teknoloji Dergisi, 26, 276–283. https://doi.org/10.31590/ejosat.954003
Belk, R. W., Belanche, D., and Flavián, C. (2023). Key Concepts in Artificial Intelligence and Technologies 4.0 in Services. Service Business, 17(1), 1–9. https://doi.org/10.1007/s11628-023-00528-w
Bilgin, M. (2017). Gerçek Veri Setlerinde Klasik Makine Öğrenmesi Yöntemlerinin Performans Analizi. Breast, 2(9), 683.
Bracewell, R. N. (1989). The Fourier Transform. Scientific American, 260(6), 86–95. https://doi.org/10.1038/scientificamerican0689-86
Çakır,
F. S., Aytekin, A., and Tüminçin, F. (2018). Nesnelerin İnterneti ve Giyilebilir
Teknolojiler. Sosyal Araştırmalar ve Davranış Bilimleri
Dergisi, 4(5), 84–95.
Ersöz,
A., and Özşen, S. (2011). Uyku EEG Sinyalinin Yapay Sinir Ağ Modeli ile
Sınıflandırılması.
Evlice, A. T. (2012). Obstrüktif Uyku Apne Sendromu. Arşiv Kaynak Tarama Dergisi, 21(2), 134–150.
Giorgi, L., Nardelli, D., Moffa, A., Iafrati, F., Di Giovanni, S., Olszewska, E., ... and Casale, M. (2025, January). Advancements in Obstructive Sleep Apnea Diagnosis and Screening Through Artificial Intelligence: A Systematic Review. In Healthcare (Vol. 13, No. 2, 181). MDPI. https://doi.org/10.3390/healthcare13020181
Gün, A., and Bayzan, Ş. (2024). Dijitalleşmenin Teknolojik Boyutu.
Haghighat, S., Joghatayi, M., Issa, J., Azimian, S., Brinz, J., Ashkan, A., ... and Sangalli, L. (2025). Diagnostic Accuracy of Artificial Intelligence for Obstructive Sleep Apnea Detection: A Systematic Review. BMC Medical Informatics and Decision Making, 25(1), 278. https://doi.org/10.1186/s12911-025-03129-x
Hanbay, K. (2021). Görüntü Bölütleme İçin Fourier Dönüşümü, Hessian Matris ve Özdeğerler Kullanılarak Yeni Bir Aktif Kontur Modeli. Türk Doğa ve Fen Dergisi, 10(2), 242–247. https://doi.org/10.46810/tdfd.977786
İkizler, N., and Ekim, G. (2025). Epileptik Nöbet Tespiti İçin Yüksek Çözünürlüklü Güç Spektral Yoğunluk Yaklaşımları. Politeknik Dergisi, 1–1. https://doi.org/10.2339/politeknik.1605362
Karakoyun,
M., and Hacıbeyoğlu, M. (2014). Biyomedikal Veri Kümeleri İle Makine
Öğrenmesi Sınıflandırma Algoritmalarının
İstatistiksel Olarak Karşılaştırılması.
Dokuz Eylül Üniversitesi Mühendislik Fakültesi Fen ve Mühendislik Dergisi,
16(48), 30–42.
Karamustafaoğlu,
G., Akan, A., and Saatçi, E. (2014). Polisomnografi Sinyallerinin
İşlenmesi ile Uyku Apnesinin Otomatik Teşhisi / Polisomnografi
Sinyallerinin İşlenmesiyle Uyku Apnesinin Otomatik Tespiti.
Kılıç, H. Ö. (2017). Giyilebilir Teknoloji Ürünleri Pazarı ve Kullanım Alanları. Aksaray Üniversitesi İktisadi ve İdari Bilimler Fakültesi Dergisi, 9(4), 99–112.
Koçak, O., Beytar, F., Fırat, H., Telatar, Z., and Eroğul, O. (2016, October). Comparison of Non-Parametric PSD Detection Methods in the Anaylsis of EEG Signals in Sleep Apnea. In 2016 Medical Technologies National Congress (TIPTEKNO) (1–4). IEEE. https://doi.org/10.1109/TIPTEKNO.2016.7863133
Köktük, O., and Tu, Ç. (2003). Santral Uyku Apne Sendromu. Tuber ve Toraks Derg, 51(3), 349–360.
Köktürk, O. (2013). Uyku Kayıtlarının Skorlanması. Solunum, 15(2), 14–29. https://doi.org/10.5152/solunum.2013.027
Li, Y., Gao, H., and Ma, Y. (2017). Evaluation of Pulse Oximeter Derived Photoplethysmographic Signals for Obstructive Sleep Apnea Diagnosis. Medicine, 96(18), e6755. https://doi.org/10.1097/MD.0000000000006755
Mendonca, F., Mostafa, S. S., Ravelo-Garcia, A. G., Morgado-Dias, F., and Penzel, T. (2018). Obstrüktif Uyku Apnesi Tespit Yaklaşımlarının Bir İncelemesi. IEEE Journal of Biomedical and Health Informatics, 23(2), 825–837. https://doi.org/10.1109/JBHI.2018.2823265
Metlek, S., and Kayaalp, K. (2020). Makine Öğrenmesinde, Teoriden Örnek MATLAB Uygulamalarına Kadar Destek Vektör Makineleri (100). İksad Yayınevi.
Nazli, B. (2021, June). Evaluation of Different Machine Learning Algorithms for Classification of Sleep Apnea. In 2021 29th Signal Processing and Communications Applications Conference (SIU) (1–4). IEEE. https://doi.org/10.1109/SIU53274.2021.9477705
Öner,
İ. V., Yeşilyurt, M. K., and Yılmaz, E. Ç. (2017). Wavelet Analiz Tekniği ve
Uygulama Alanları. Ordu Üniversitesi Bilim ve Teknoloji Dergisi, 7(1),
42–56.
Özcan, F. (2025). Giyilebilir Teknolojiler ve Hasta İzleme. In Sağlık Bilimlerinde Tüm Yönleriyle Hemşirelik (39).
Pépin, J. L., Defaye, P., Vincent, E., Christophle-Boulard, S., Tamisier, R., and Lévy, P. (2009). Sleep Apnea Diagnosis Using an ECG Holter Device Including a Nasal Pressure (NP) Recording: Validation of Visual and Automatic Analysis of Nasal Pressure Versus Full Polysomnography. Sleep Medicine, 10(6), 651–656. https://doi.org/10.1016/j.sleep.2008.07.002
Pirim, A. G. H. (2006). Yapay Zeka. Yaşar Üniversitesi E-Dergisi, 1(1), 81–93.
Sak, Ö., and Beyen, K. (2019). Yapıların Zaman-Frekans Ortamında Dalgacık Dönüşümü Metoduyla Hasar Analizleri. Teknik Dergi, 30(1), 8835–8860. https://doi.org/10.18400/tekderg.300366
Şener, E., and Güner, P. (2024). Obstrüktif Uyku Apne Sendromu: Diş Hekimliği Yönünden Risk Faktörlerinin Değerlendirilmesi. Journal of Turkish Sleep Medicine, 11(2), 69–77. https://doi.org/10.4274/jtsm.galenos.2023.49091
Serçe, S., and Ovayolu, Ö. (2024). Obstrüktif Uyku Apne Sendromunda Giyilebilir Teknolojinin Yorgunluk ve Gündüz Uykululuğuna Etkisi: Literatür İncelemesi. Sağlık Bilimlerinde Değer, 14(1), 163–167. https://doi.org/10.33631/sabd.1271348
Sharma, P., Jalali, A., Majmudar, M., Rajput, K. S., and Selvaraj, N. (2022, July). Deep-Learning Based Sleep Apnea Detection Using SpO2 and Pulse Rate. In 2022 44th Annual International Conference of the IEEE Engineering in Medicine and Biology Society (EMBC) (2611–2614). IEEE. https://doi.org/10.1109/EMBC48229.2022.9871295
Toraman, S., and Türkoğlu, İ. (2019). Dalgacık Dönüşümü ve Makine Öğrenme Teknikleri Kullanılarak FTIR Sinyallerinden Kolon Kanseri Hastaları ve Sağlıklı Kişileri Sınıflandırmak İçin Yeni Bir Yöntem. Gazi Üniversitesi Mühendislik Mimarlık Fakültesi Dergisi, 35(2), 933–942. https://doi.org/10.17341/gazimmfd.564803
Tosunoğlu,
E., et al. (2021).
Eğitimde Makine Öğrenmesi: Araştırmalardaki Güncel
Eğilimler Üzerine İnceleme. Ahmet Keleşoğlu Eğitim
Fakültesi Dergisi, 3(2), 178–199.
Uçar,
M. K., et al. (n.d.).
Uyku EEG ve EOG Sinyallerinin Sınıflandırılmasında
Zaman ve Frekans Domeni Özelliklerinin Etkisi / Effect of Time and Frequency
Domain Features in Sleep EEG and EOG Signals Classification. Delta, 1, 0.5–2.5.
Walker,
J. S. (1997).
Fourier Analizi ve Dalgacık Analizi. AMS Bildirileri, 44(6), 658–670.
Yıldız,
A. (2017). Tek
Kanallı EKG Kayıtları Analizinden Uyku Apne Tespiti. Dicle
Üniversitesi Mühendislik Fakültesi Mühendislik Dergisi, 8(1), 111–122.
Yıldız,
M. (2021). Uyku
Apnesi Tespitinde Yenilikler. Natural and Applied Sciences Journal, 3(Special
Issue: Full Papers of 2nd International Congress of Updates in Biomedical
Engineering), 32–39.
Yıldız, M. E. (2025). Giyilebilir Akıllı Cihazların Mobil Sağlık (mHealth) Ekosistemindeki Yükselişi. In Spor Bilimlerinde Güncel Kavramlar ve Yenilikçi Araştırmalar (34).
Yıldız, M., Tabak, Z., and Yetkin, S. (2017). Kalp Seslerinden Uyku Apnesi Tespit Edilebilir mi? Journal of Turkish Sleep Medicine, 4(1). https://doi.org/10.4274/jtsm.07108
 This work is licensed under a: Creative Commons Attribution 4.0 International License
© Granthaalayah 2014-2026. All Rights Reserved.