Evaluating CONSUMER EXPECTATIONS VS. PERCEPTIONS IN CONSTRUCTION CHEMICALS: A CASE STUDY OF REDWOP CHEMICALS PVT. LTD
Durvesh Jayantkumar Suthar 1
1 Amity
Business School Mumbai, Amity University, Mumbai, Mumbai, India
|
|
|
ABSTRACT |
|
|
The construction chemical industry has become an essential part of modern infrastructure development, offering solutions that increase durability, strength, and efficiency. Redwop Chemicals Pvt. Ltd., a leading company in this sector, provides a wide range of products such as tile adhesives, sealants, waterproofing compounds, and epoxy resins. This research aims to understand customer preferences, evaluate awareness regarding hazardous chemical usage, and analyze the gap between consumer expectations and the actual service/performance delivered by the company. A survey-based
approach was used to collect primary data from various industry participants,
including retailers, distributors, engineers, architects, and contractors.
The purpose of the study is to provide insights that can help Redwop
Chemicals Pvt. Ltd. enhance service quality, strengthen customer
relationships, and improve product offerings based on real customer
perceptions. |
|||
|
Received 15 August 2025 Accepted 17 September 2025 Published 31 October 2025 DOI 10.29121/IJOEST.v9.i5.2025.729 Funding: This research
received no specific grant from any funding agency in the public, commercial,
or not-for-profit sectors. Copyright: © 2025 The
Author(s). This work is licensed under a Creative Commons
Attribution 4.0 International License. With the
license CC-BY, authors retain the copyright, allowing anyone to download,
reuse, re-print, modify, distribute, and/or copy their contribution. The work
must be properly attributed to its author.
|
|||
|
Keywords: Consumer, Expectations,
Perceptions, Construction, Chemicals |
|||
1. INTRODUCTION
The construction chemical industry has become an essential part of modern infrastructure development, offering solutions that increase durability, strength, and efficiency. Redwop Chemicals Pvt. Ltd., a leading company in this sector, provides a wide range of products such as tile adhesives, sealants, waterproofing compounds, and epoxy resins.
This research aims to understand customer preferences, evaluate awareness regarding hazardous chemical usage, and analyze the gap between consumer expectations and the actual service/performance delivered by the company.
A survey-based approach was used to collect primary data from various industry participants, including retailers, distributors, engineers, architects, and contractors. The purpose of the study is to provide insights that can help Redwop Chemicals Pvt. Ltd. enhance service quality, strengthen customer relationships, and improve product offerings based on real customer perceptions.
2. LITREATURE REVIEW
|
Name of the Author |
Objectives of the study |
Key findings of the study |
Research Gap |
|
Milda Jucienė and Vaida
Dobilaitė et.al 2021 |
The main aim the study investigates about adhesive construction tapes
i.e. what impact it gives during bad
weather conditions which is used at building and every construction area. |
This study found that adhesive construction tapes are really good and
it has a long-time durability and also they remain stable in a 20oC and 70oC.
These tapes are cost effective method to use in any climatic effects at any
properties. |
This study focuses on how different climatic conditions impact
adhesive tape properties beyond varying condition. So there is a lack of
comprehensive data during this adhesive taps research. |
|
C.M Dry et.al 2001 |
To aware people that do not used concrete to prevent hazardous waste
from leaking rather than they can take use of fibers chemical materials. |
Researcher have developed the concrete fibers chemical which include
sealants and adhesive which helps to join the crack area it means if there is
any crack fibers release chemical fill the seal of the crack. |
The gap which researchers fill out i.e.
traditional concrete are crack immediately and also not have a long term
durability so the researchers fill out this gap by doing research on this
that this concrete-based fibers adhesive have a long-term durability and not
also fill out automatically or by the individual. |
|
Martin Brandtner – Hafner |
The objectives of this study to evaluate the structural safety and
performance of polymeric based adhesive at every construction area. |
Researcher found that to asses structural safety polymeric based
adhesive sealants it is important to evaluate adhesive bonding system for
construction. In current evaluation need some innovative technique to make
the adhesive behavior under stress and highly strength. |
Researchers found that traditional method such as lap shear, pull-off
and peel- off are not capable the crack with adhesive bonds but current evaluation does not have complex
method and provide high performance and safety in bonding system for a long
period of time. |
|
Bengit Jarvholm |
The materials used in chemical construction
companies are carcinogens, so the main objective of this study to create
awareness about carcinogens material among the consumer, so the consumer buy
a product by doing overall research. |
The main study of this research to reduce the health risk of humans
and particularly the plumbers and workers who are working in this industry. This research found that many people get affected with carcinogens chemical in
many countries so it also create awareness among the others. |
The research gap of this study is
to estimate cancer risk because
in this industry there are many
company who make construction
chemicals by using various hazardous
chemical which may affect the consumer and
mostly the people who are working this industry so
the researcher thought to fill this gap which help the people to do
their research before purchasing a
construction chemical products. |
|
Sangkyu Lee Sangyun Lee, Gyuyong king, Minjae Son, Gyenogcheol Choe, Jayhyun
Lee, Jeongsoo Nam |
The objective of the study is to evaluate the performance of tiles by
using epoxy resin adhesive and with this it will help to measure the
performance of the material for long period of time. |
This study found that the chemical was used for with cement mortar
i.e. epoxy resin adhesive makes a stronger strength in the tiles and help to
remain sustain tiles for long time period without any moisture loss and
shrinkage. The main reason for this research is to found out the longer time
strength for a tile and it also found that how much hold by using this type
of chemical. |
The main gap was found by this research study is that many tiles get
easily damage or make shrinkage after
the fitting of tiles so for that the researchers founded a gap here and
researched on the chemical use in construction industry and the one of the
chemical they research on was epoxy resin adhesive to found out the overtime strength and durability of
tiles by using the epoxy resin adhesive chemical. |
3. INFERENCE
By doing this research I identified the gap and trends in this literature review. This all above research is based on different aspect but the common problem I found out in this construction chemical industry i.e. customer is not truly satisfying with the product because of the two reason.
First reason is customer have less knowledge about the product like how to identify the best quality product while purchasing. For this type of construction chemical product quality matters a lot it shows the long term durability and strength of the product. As in this industry there are also companies who make a construction chemical by using substance of hazardous chemical which may impact the health of customers and specially those people who are working in this industry like plumber, contractor, engineer etc.
The second reason is that customer are not aware for this type of product because now a time it is important to use some construction chemical in construction area does not prefer to use this type of construction chemical so it may create a problem because before the construction chemical where not used the people only prefer to take use of cement at every construction area but due to changes in product like waterproofing cement , tiles , granite , marble etc all this product started upcoming in various design and quality if at that time any person who use cement for that person may create a damage of a product so for bringing changes in the construction industry.
The researcher started researched on it that making a such product which can efficiently handle any material in every construction industry because many a times there are also company who started doing research on it after all the research get lastly incomplete because many researcher found that there are also chemical in construction company which may damage the material as well as can harm to many people but at now the researcher proper data collection and with a consistent effort it result in a good manner according to a researcher there are approximately 1200 companies which make construction product which not only helps at a construction site but also it also helps to the person who are working in this industry.
4. RESEARCH METHODOLOGY
4.1. Research Type
The research type is quantitative helps to understand the customer aspect of the company as it include research on customer preference i.e. likes and dislikes towards the product and a company. This quantitative data gives an overall analysis of different customer which help us to make a better workflow in an organization and according to the data the company can also work on research and development.
4.2. Sampling Method
No Specific Sampling method was applied in this research. The main target audience while doing this research is retailer, distributor, wholesaler, engineer, architecture and the people who are working in this industry.
No. of Responses
25 responses were collected in the primary data collection through an online google form The age group are:
Below 25 years = 24% responses
25 – 40 years = 40% responses
40 – 60 years = 36% responses
But in construction chemical industry there is a NIL response form Above 60 years
4.3. Research Objectives
To identify the customer preference towards the construction chemical industry
To create awareness among the customer that do not use hazardous chemical at any construction area
Helps to know the customer the basic need of chemical in construction industry
4.4. Hypothesis
Null hypothesis / Ho: There is a significant impact of marketing and sales strategies for redwop construction chemical.
Alternative hypothesis / H1: There is no significant impact of marketing and sales strategies for redwop construction chemical.
INFERENCE: This the Research Methodology by analyzing the data we get to know what research objective and the type in this project and other data is related to customers. I collected the sample and data from the target audience retailers, wholesaler or a distributor by collecting this data we also get to know the percentage of responses as per particular age. I get highest no. of responses from the age between 25 – 40 years of age. This age group given a highest no. of response so we can assume that in this construction industry this age group people is working more.
In research methodology I have also discuss about the 3 objective which I want to achieve by doing this research project so the 2 objective To create awareness among the customer that do not hazardous chemical at any construction area so this statement shows the truth in this industry because there are many construction chemical company who make the product by using various hazardous chemical into it so it may impact and harm the human body and may cause a sick to a people so it is to alert the people before they use this type hazardous chemical products and mostly to the people who are working in this industry.
5. DATA ANALYSIS
Figure 1
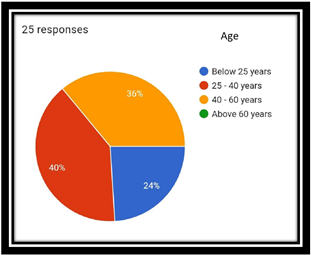
|
Figure 1 Pie – Chart Age |
INFERENCE: From the above pie chart we can see that pie chart is ratio is divided in different age which is Below than 25 years , 25 – 40 years , 40 – 60 years and the Above 60 years and analyzing the overall data we can see that the large amount of people of age who are working in this industry is 25 – 40 years of age and then the age group is 40 – 60 years this customer age ratio either they are working in this industry or they are final customer of the redwop.
Figure 2
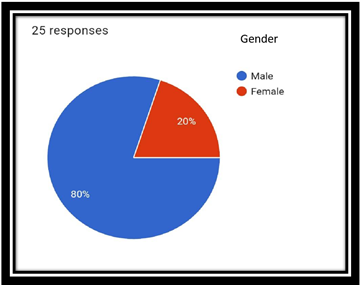
|
Figure 2 Pie – Chart Gender |
INFERENCE: From the above data we can see that Male is 80% and Female is only 20% so high amount of customer are male and ultimately we can say that in construction chemical industry the high amount of male are working.
Figure 3
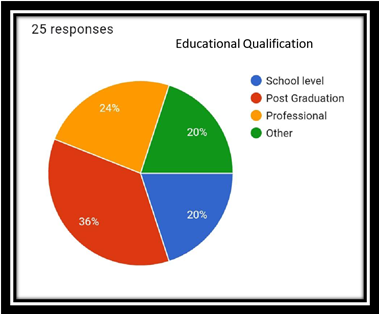
|
Figure 3 Pie – Chart Educational Qualification |
INFERENCE: The above given pie chart shows the educational qualification of the customer so from the given post graduate and professional customers are more so in this industry we can predict that people are well educated which will ultimately help the company to share a information about their product and also help the company to sell any product easily without going into a product detail.
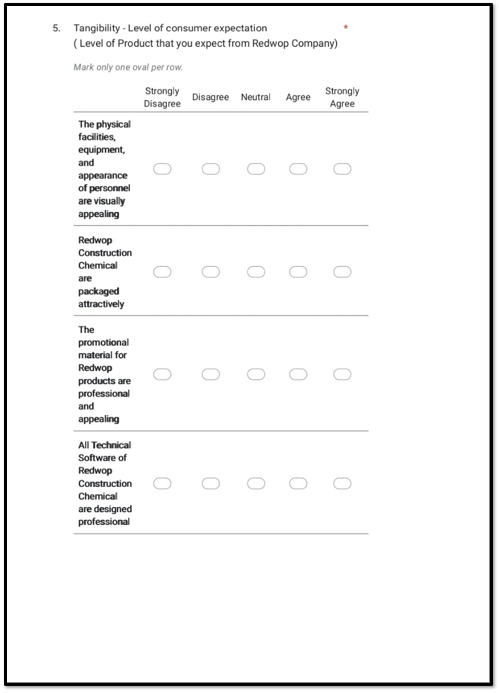
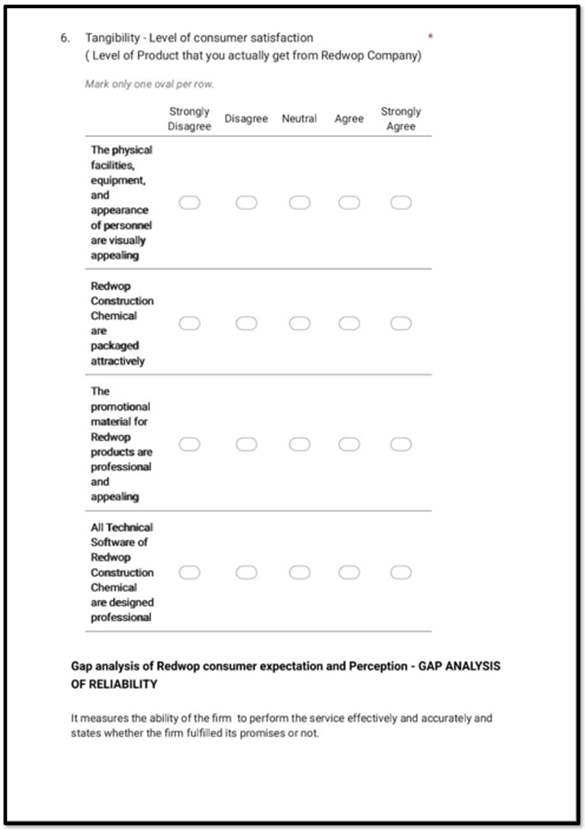
TANGIBILITY: LEVEL OF CONSUMER EXPECTATION
Figure 4
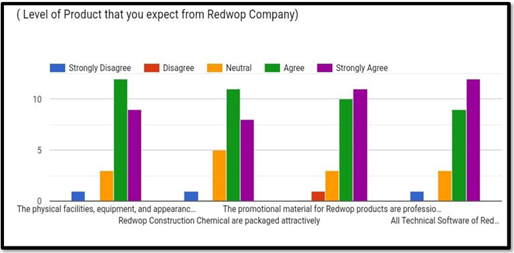
|
Figure 4 Bar Graph Tangibility Expectation |
INFERENCE: It is a graph which shows what customer expect from a company in point of view of product. So in all the questions related to the product we can assume that customer Agree and Strongly Agree product it means customer want good quality product, packaging and attractive marketing from a side of a company.
TANGIBILITY: LEVEL OF CONSUMER SATISFACTION
Figure 5
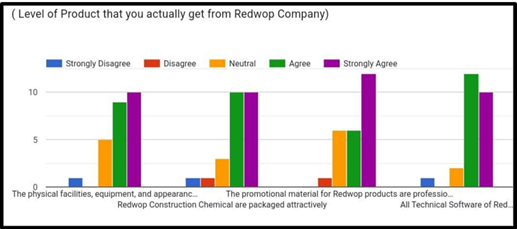
|
Figure 5 Bar Graph – Tangibility perception |
INFERENCE: It is a graph which shows what customer actual get from a side of a company so we can see that Strongly Agree graph not cross the above line 10 and also it same with Agree so we can assume here that customer get Neutral category of product from their expectation.
From the above two graph we can see the difference in consumer expectation towards the product and perception towards the product. As we know customer satisfaction is first priority of any business so satisfying the customer is only done by providing a quality product to customer according to the above data we can assume that people who expect quality product from the company but from the current data we can see the customer not get too satisfied as they want according to their expectation.
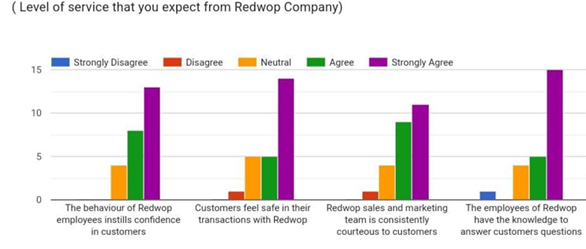
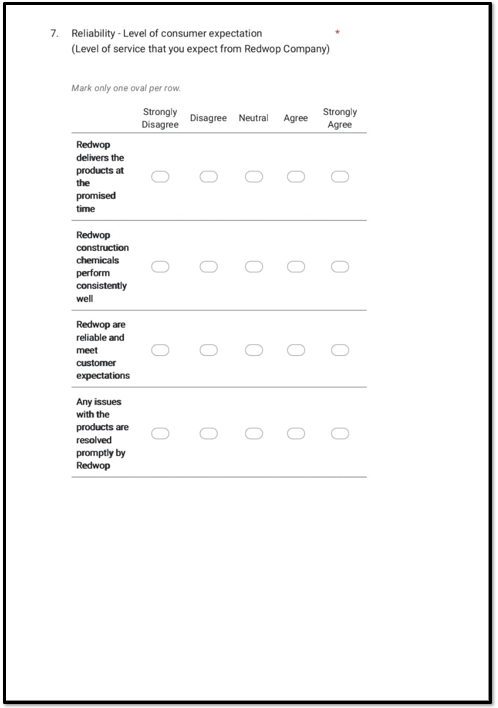
RELIABILITY: LEVEL OF CONSUMER EXPECTATION
Figure 6
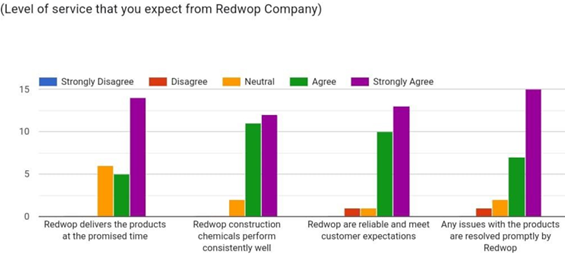
|
Figure 6 Bar Graph – Reliability Expectation |
INFERENCE: From the above given graph shows that what customer actually expect service from a company so in the total graph analysis we can see assume that customer expectation towards the service is comparatively high from other as see it is totally strongly agree so hence we can say that customer expectation towards the service are too high from a company.
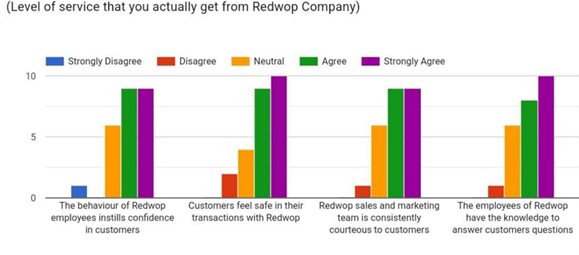
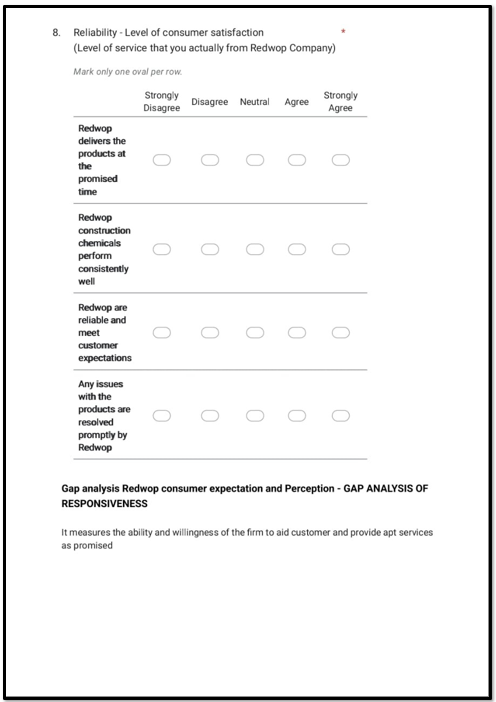
RELIABILITY: LEVEL OF CONSUMER SATISFACTION
Figure 7
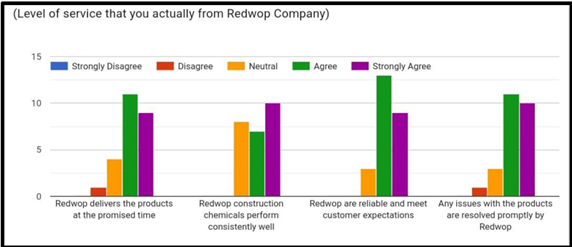
|
Figure 7 Bar Graph - Reliability Perception |
INFERENCE: It include the level of service the customer actually get from a company so from the above graph just we can assume by doing an analysis which is that customer are agree with a service but not too satisfied from the service so the customer expectation level towards the service is not matched but if the company do more better in delivering a quality service to customer so it may give a better result to a company.
By analyzing the above data we can see customer expectation towards the service is too high and the level of satisfaction they get from a service is comparatively not match the customer expectation. So it include that customer are not too satisfied with the expectation but as the Agree and Strongly Agree graph is modest high so the customer are satisfied but not too satisfied.
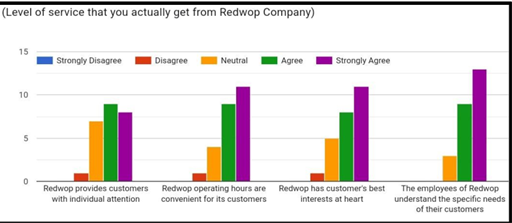
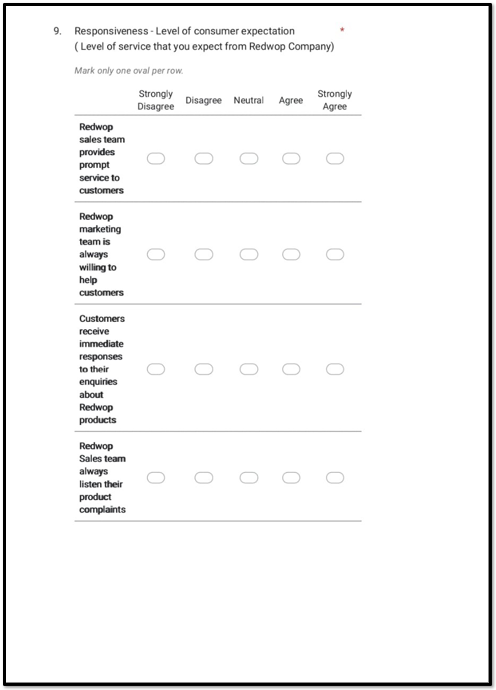
RESPONSIVENESS: LEVEL OF CONSUMER EXPECTATION
Figure 8
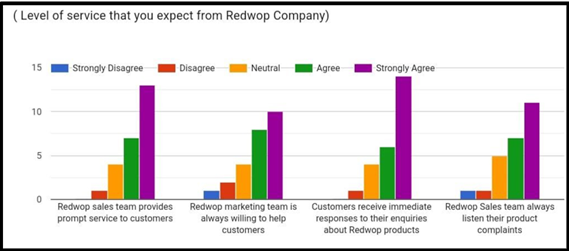
|
Figure 8 Bar Graph – Responsiveness Expectation |
INFERENCE: It also includes the service, but the same graph structure shows that every customer expects quality service from a company.
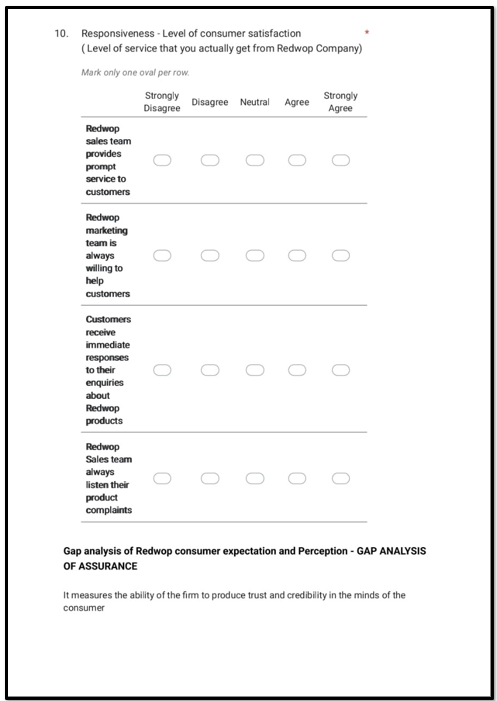
RESPONSIVENESS: LEVEL OF CONSUMER SATISFACTION
Figure 9
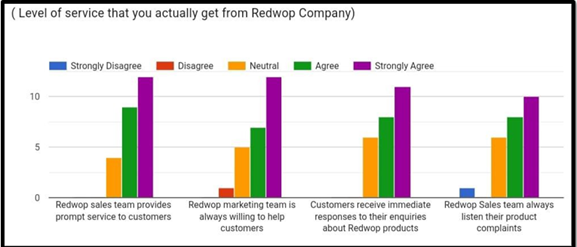
|
Figure 9 Bar Graph – Responsiveness Perception |
INFERENCE : From the above expectation graph if we compare this graph then we can see what customer are expecting from a company is relatively matching and the it gives a high-level satisfaction to both the customer as well as company.
The above data shows that the service which is provided by Redwop employees is comparatively matching the expectation because the graph of Strongly Agree is high in expectation level like we can see the graph touches 10 and somewhere it crosses the 10 and same in the satisfaction level towards the employee service it also touches the 10 level so we can assume and say that the employee is satisfying the customer by providing a quality service to them whether it can be a Technical , marketing or a sales team the graph shows the customer are satisfied with the employee they are currently working.
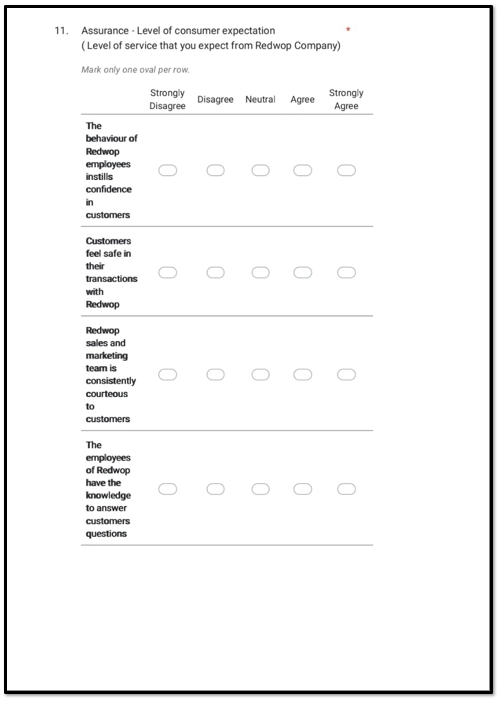
ASSURANCE: LEVEL OF CONSUMER EXPECTATION
Figure 10
|
Figure 10 Bar Graph – Assurance expectation |
INFERENCE: The above data shows that customer expectation from company employees is high the customer expect that the employees must be well mannered, loyal, and consistent and have deep knowledge of the product. The above strongly agree graph is too high and other graph is comparatively low from strongly agree graph. The strongly agree graph cross the 10 it means the level of consumer expectation is too high from the company.
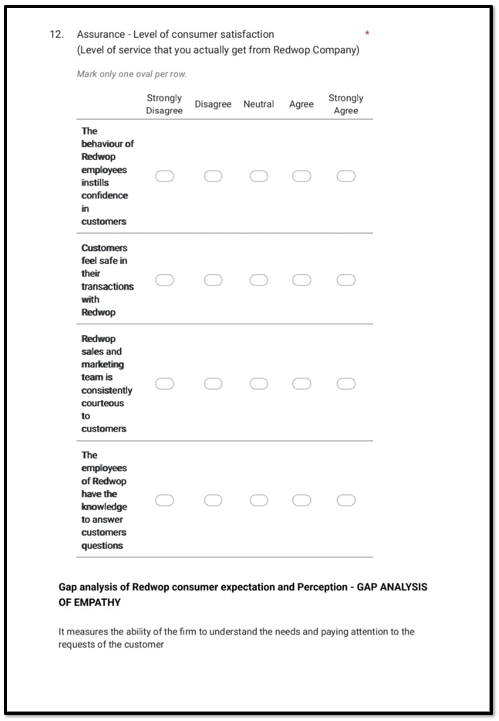
ASSURANCE: LEVEL OF CONSUMER SATISFACTION
Figure 11
|
Figure 11 Bar Graph – Assurance Perception |
INFERENCE: The above data shows that the customer are satisfied with a company employees it can be employee behavior , consistency , loyalty and the deep knowledge of the product. From the graph we can assume that the satisfaction level is high, so it is comparing with the customer expectation.
These two above graphs of expectation and perception shows that customers are satisfied with the company employees and their way of working with them the satisfaction is not only towards the product it also includes the how customer actually get from a company and this can be noticed by only looking into the employee behavior and the way of behaving with them.
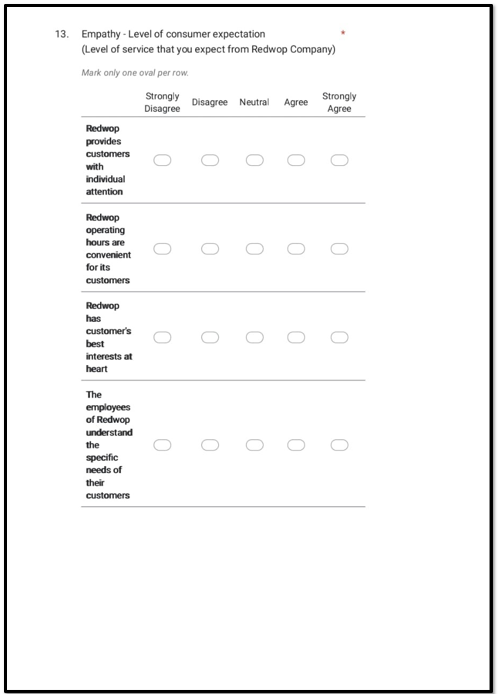
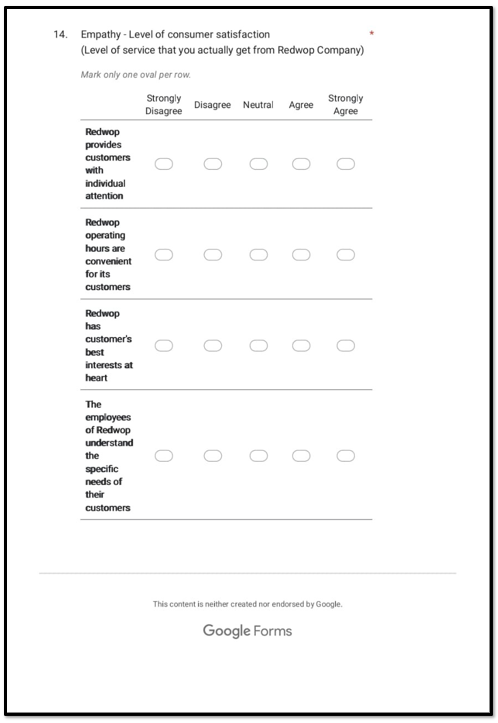
EMPATHY: LEVEL OF CONSUMER EXPECTATION
Figure 12
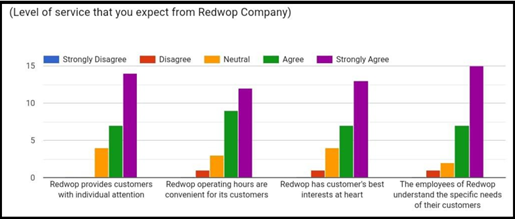
|
Figure 12 Bar Graph – Empathy Expectation |
INFERENCE: The above data shows that the expectation level is high from the customer as we see customer want individual attention to get their need fulfill according to their interest. The high amount to expectation leads that customer’s need good service with a quality product from a professional employee.
EMPATHY: LEVEL OF CONSUMER SATISFACTION
Figure 13
|
Figure 13 Bar Graph – Empathy Perception |
INFERENCE: The above data shows that 2 graphs are matching the customer expectation level the graph are 2 and 3 but 1 graph is comparatively lower from customer expectation and the last 4 graph is modest matching to the customer expectation
From the above data we can see that customer expectation and customer perception it means the actual service they get from the company is matching some graph but apart from 2 graph the remaining two graph is not matching the customer expectation so we can say the above graph is overall fluctuated and the company need some changes in 1 graph.
This is an overall data analysis from this data we get to understand the customer the expectation level and customer perception level in some graph the customer expectation is matching so it increases the level of satisfaction of the customer.
The main objective of doing this analysis is to know about the customer their preference and their way of thinking towards the company. The expectation and perception help the company to match and compare the customer data and on this data basis the company may be try to match the customer expectation.
This clear data give idea to company not only about their customer but also about their employee so the company can also understand the company overall workflow by looking into this data. The overall workflow include the company employee behavior and the deep analysis in the company. Basically it helps the company to make the work easy by looking into this data format.
6. Conclusion
Based on the survey findings, it is evident that customers in the construction chemical industry have high expectations regarding both product quality and service standards. The data shows that while Redwop Chemicals Pvt. Ltd. performs well in areas such as employee behavior, responsiveness, and assurance, there are certain gaps in product satisfaction and consumer awareness regarding chemical safety.
Customers expect high durability, better product performance, modern packaging, and stronger technical guidance. Although many expectations are met, some areas still show a mismatch between what customers expect and what they experience. This highlights the need for improved communication, enhanced product education, and consistent product quality enhancements. Overall, the study confirms that Redwop Chemicals has a strong market presence but can further improve by addressing customer feedback and expectations.
7. Recommendations
Based on the overall analysis and findings, the following recommendations are suggested for Redwop Chemicals Pvt. Ltd.:
1) Improve
Product Awareness
· Conduct more product demonstrations and training sessions for retailers, contractors, plumbers, and engineers.
· Provide clear educational materials regarding hazardous chemicals and safe usage practices.
2) Enhance
Product Quality And Packaging
· Improve the durability and performance of products where customer expectations were not fully met.
· Upgrade packaging to ensure freshness, avoid leakage, and create a professional brand image.
3) Strengthen
Customer Service
· Increase responsiveness and technical support, especially in problem-solving and site visits.
· Ensure that employees maintain consistent communication and follow-ups with customers.
4) Expand
Marketing And Visibility
· Use social media, digital marketing, and field marketing activities to increase brand visibility.
· Provide display materials, brochures, and product comparison charts to retailers.
5) Collect
Regular Feedback
· Implement a structured feedback mechanism to constantly understand customer needs.
· Use this feedback to strengthen both R&D and product development.
REFERENCES
ASTM International – Standards for Adhesives and Sealants
Brandtner-Hafner, M. (2015). Evaluation of Polymeric Adhesive Bonding Systems for Structural Safety in Construction. Construction Engineering Review.
Creswell, J. W. (2014). Research Design: Qualitative, Quantitative, and Mixed Methods Approaches. SAGE Publications.
Dry, C. M. (2001). Use of Fiber-Reinforced Chemical Materials for Crack Sealing in Concrete Structures. Journal of Materials in Civil Engineering.
Google Scholar – Research on Epoxy Resin Adhesives
International Journal of Construction Materials
Jarvholm, B. (2010). Carcinogenic Materials in the Construction Chemical Industry: Health Risks and Awareness. Occupational Health and Safety Journal.
Jucienė, M., and Dobilaitė, V. (2021). Impact of Adhesive Construction Tapes Under Varying Climatic Conditions. International Journal of Building Materials Research.
Kotler, P., and Armstrong, G. (2018). Principles of Marketing. Pearson Education.
National Building Code of India (NBC) – Material Safety Guidelines
Occupational Safety and Health (Chemical Safety Guidelines)
Redwop Chemicals Pvt. Ltd. (2024). Construction Chemicals Product Catalogue. Author.
Redwop Chemicals Pvt. Ltd. Official Website
ResearchGate – Construction Adhesives and Sealants Studies
ScienceDirect – Adhesive Bonding Research Papers
Appendix
 This work is licensed under a: Creative Commons Attribution 4.0 International License
© Granthaalayah 2014-2025. All Rights Reserved.