TIME AND COST EFFICIENCY ANALYSIS OF ACEH TENGAH REGENCY POM WORKSHOP PROJECT: A CRITICAL PATH METHOD APPROACH
Hafnidar A. Rani 1![]()
![]() ,
Fida Filaya Maina 1
,
Fida Filaya Maina 1![]() , Muhammad Shafly Aqsha 2
, Muhammad Shafly Aqsha 2![]() , Muhammad Hafidz Mubarak 3
, Muhammad Hafidz Mubarak 3![]()
1 Department
of Civil Engineering, Universitas Muhammadiyah Aceh, Banda Aceh, Aceh,
Indonesia
2 Faculty
of Computer Science, Universiti Tun Hussein Onn Malaysia, Johor, Malaysia
3 Department of Information Technology, Universitas Ubudiyah Indonesia,
Banda Aceh, Indonesia
|
|
|
ABSTRACT |
|
|
The study
addresses construction delays in the Aceh Tengah Regency POM Workshop
project, valued at IDR 6,414,000,000 and spanning approximately 1,507 m2
across two floors. Motivated by the need for a comprehensive understanding of
activity relationships and critical paths, the research aims to assess
project duration, costs, and efficiency. Employing the Critical Path Method
(CPM) due to data constraints, the study elucidates activity dependencies,
network planning, and critical paths. Data collected from relevant
stakeholders include schedule and cost budget plans. The analysis reveals a
potential acceleration of 21 days, reducing the project duration from 126 to
105 days with a 99.74% probability. Cost control indicates an escalation to
IDR 6,949,573,170.20 after calculating direct costs, with a daily increase of
0.92%. The findings underscore the significance of CPM in project management,
offering insights into optimizing timelines and costs. The study highlights
the importance of efficient project management methodologies in addressing
construction delays and managing project budgets effectively. |
|||
|
Received 05 April 2024 Accepted 06 May 2024 Published 21 May 2024 Corresponding Author Hafnidar
A. Rani, hafnidar.ar@unmuha.ac.id DOI 10.29121/IJOEST.v8.i3.2024.604 Funding: This research
received no specific grant from any funding agency in the public, commercial,
or not-for-profit sectors. Copyright: © 2024 The
Author(s). This work is licensed under a Creative Commons
Attribution 4.0 International License. With the
license CC-BY, authors retain the copyright, allowing anyone to download,
reuse, re-print, modify, distribute, and/or copy their contribution. The work
must be properly attributed to its author.
|
|||
|
Keywords: Critical Path
Method, Time and Cost, Construction Project |
|||
1. INTRODUCTION
The construction industry plays a vital role in societal development, enriching communities through infrastructure projects aimed at improving quality of life. However, effective project management within this sector is essential for the timely and cost-efficient delivery of these initiatives Rani (2021). Traditional scheduling methods, such as the Gantt chart and S-curve, have limitations in presenting comprehensive project information, activity interdependencies, and critical path identification, hindering efficient project execution Syammaun et al. (2019). To address these shortcomings, this study adopts the Critical Path Method (CPM) to enhance time and cost control in construction projects Rahma & Kamandang (2023).
Building upon prior research Wicaksono & Setiawan (2023) that has highlighted the impact of project scheduling methods on cost outcomes, this study seeks to contribute to the optimization of construction project management practices. By employing CPM, the research aims to uncover insights into the interrelationships among project activities and critical paths, enabling better prioritization and resource allocation Yang & Kao (2012). Through a contextualized narrative, the study immerses the reader in the challenges and complexities of construction project management, illustrating the need for innovative approaches to address scheduling and cost control issues.
The study's critical question emerges from firsthand experiences and observations within the construction industry, highlighting the necessity for improved project management techniques. The goal is to investigate how CPM can offer more comprehensive insights into project scheduling and cost implications, ultimately informing strategies for efficient project delivery. By weaving together personal insights, industry context, and methodological rationale, the introduction sets the stage for the study's objectives, emphasizing the importance of addressing time and cost management challenges in construction projects.
In summary, this study builds upon existing literature by
adopting CPM as a theoretical and operational framework to address time and
cost management challenges in construction projects. Through a thorough
exploration of project scheduling methods and their implications, the research
aims to contribute to the advancement of construction project management
practices and fill existing research gaps in the field.
2. MATERIALS AND METHODS
According to Rani (2021), project management
involves the processes of planning, organizing, leading, and controlling the
activities of members and resources to achieve the goals set by an organization
or company. To achieve these goals, management encompasses several functions,
including the following:
1) Planning
involves setting organizational goals and determining the strategies needed to
achieve them. Planning is future-oriented due to the uncertainty associated
with the future. It entails establishing initial steps to enable an
organization to achieve its objectives and involves efforts to anticipate
future trends and determine appropriate strategies and tactics to realize
organizational goals.
2) Organizing
involves assigning tasks and developing organizational structures that align
with the company's objectives. Organizing aims to coordinate various resources,
including human resources, to function optimally and fulfill their respective
roles and functions effectively.
3) Directing:
It entails actions aimed at ensuring that all group members strive to achieve
goals in line with the plan. The directing process aims to guide or control so
that work is carried out effectively and efficiently.
4) Controlling
involves assessing the activities that have been carried out. The controlling
function determines the quality of services or products produced.
According to Ammar et al. (2023), the breakdown of project
costs is the calculation of the total cost required for materials, labor, and
other expenses related to the construction or implementation of the building or
project. The cost budget plan (RAB) is an estimate of the costs required for
each task in a construction project, resulting in the total cost needed to
complete the project Al-Enezi & Al-Sabah (2023).
Optimization analysis can be defined as a process of decomposing project
duration to achieve the best acceleration duration using various alternatives
considered from a cost perspective Saleh et al. (2023). The process of shortening
activity time in a network to reduce time on critical paths, thus reducing the
total completion time, is referred to as project crashing. Time and cost have a
significant impact on the success or failure of a project Daoud et al. (2023).
To develop the time and cost planning for project implementation, it is
necessary to study job specifications, break down tasks, examine the relationships
between activities, create a network plan, conduct time and cost analyses for
each activity, create tables for time and cost implementation, optimize time
and cost processes, and ultimately achieve optimal time and cost Beste & Klakegg (2022).
Network planning (NWP) is a graphical representation of the activities
required to achieve a final goal Rani (2016). To achieve this goal,
symbols are required, consisting of:
1) Arrows
represent activities. Activities are defined as tasks that require a specific
duration or time frame for the use of resources. The arrowhead indicates the
direction of each activity, showing that an activity starts from the beginning
and progresses forward to the end, with the direction from left to right.
2) Small
circles represent nodes, indicating events. Events are defined as the start or
end of an activity or task.
3) Dummy (dashed
arrows) represents all activities, meaning activities that do not require
duration or resources.
With the Critical Path Method (CPM), the total time required to complete
various stages of a project is considered known, as is the relationship between
the resources used and the time required to complete the project Pramesti & Listyawan (2023). The network planning
technique used in the Critical Path Method (CPM) employs Activity on Arrow
(AOA), where arrows represent activities or tasks with various activity
notations Permatasari et al. (2023). The Critical Path Method
(CPM) is a significant planning technique as it can provide answers to
project-related questions, including:
1) Estimation
of the project completion time.
2) Determination
of the most economical project schedule.
3) Identification
of the sequence of project activities with numerous components and complex
dependency relationships.
4) Identification
of critical activities crucial for overall project completion, which may cause
project delays,
5) Assessment
of the impact of delays in specific activities on the project's schedule
target.
6) Evaluation
of whether the project is on schedule, behind schedule, or ahead of the
predetermined schedule at a specific date.
7) Assessment
of whether the expenditures at a specific date are equal to, less than, or
greater than the budgeted amount.
8) Evaluation
of the availability of sufficient resources to complete the project on time.
9) Minimization
of resource utilization fluctuations.
Determination of the best approach to expedite project completion within
minimal costs if a shorter duration is desired for the project.
PERT can be considered a development technique of CPM Astari et al. (2021), Aziz (2014). In PERT, three-time
estimates are used for each activity because the completion time of activities
cannot be determined with certainty, unlike in CPM, where a fixed time is used Aziz (2014), Trietsch & Baker (2012). PERT utilizes three
estimation figures representing optimistic time (o), most likely time (m), and
pessimistic time (p) Ketut (2015).
1) Optimistic
Time (O) is the minimum time, assuming an activity is completed under ideal
conditions where everything progresses smoothly without any issues. The
optimistic time estimate has a very low likelihood of being achieved. Formula:
To = Tm - 5%
2) Most
Likely Time (M) is the time, based on the estimator's judgment, representing
the most frequent duration for completing an activity if the work is repeated
under similar conditions.
3) Pessimistic
Time (P) is the maximum time assuming an activity is completed under adverse
conditions where execution is disrupted by various issues such as bad weather,
damages, personnel problems, material supply issues, and so on. The pessimistic
time estimate has a very low likelihood of being achieved. Formula: Tp = Tm +
10%.
A project represents the relationship between time and cost, where the
cost refers to direct costs such as labor costs, excluding indirect costs such
as administrative expenses, among others.
2.1. Research Stages
1) Problem
identification involves the expression of ideas or concepts through a
literature review, problem formulation, determination of research objectives,
methods used, problem formulation, and problem limitations.
2) Literature
Review: In this research, references are collected by reviewing literature
books, journals, the internet, and previous studies related to the ongoing
research.
3) Data
Collection: All necessary data for the research is collected through field studies
to obtain primary data. Primary data is obtained through direct communication
with relevant parties and obtaining permission to acquire data to support the
discussion of this research, as well as literature studies to obtain secondary
data for this research.
4) Data
Processing: After completing the data collection, data processing is carried out
using the CPM manually for time control and cost calculation. Additionally,
PERT is used only to assist in time control in calculating accelerated time
probabilities.
5) Critical
Path Method (CPM): This research will discuss the time and cost
obtained after implementing time and cost control using the CPM manually with
the planned stages in this research. The steps to be taken are as follows:
·
Develop a Work Breakdown Structure (WBS) for
each planned project activity.
·
Calculate the duration and cost of work based
on the planned schedule of the project.
·
Establish the dependencies of work items
based on the planned time to create logical dependencies related to project
activities.
·
Create network planning using the Critical
Path Method (CPM) manually. Each arrow will represent an activity.
·
Determine float time to identify delayed
activities. This includes calculating total float, free float, and independent
float.
·
Determine the critical path, which is chosen
because it has the longest duration and any delays will affect other
activities. The critical path will be highlighted in red in the network
planning for easy identification.
·
Calculate probabilities using PERT on the
accelerated network planning with target duration. This involves calculating
three times, then the standard deviation and variance, to obtain the z-value
for the probability percentage.
·
Calculate project costs using the equations
presented in the literature review and CPM manually. Cost calculation using the
CPM method involves equations as presented in the literature review.
3. RESULTS AND DISCUSSIONS
In creating this work breakdown, it is essential first to determine the
types of tasks to be performed, then arrange them according to the list of
tasks that need to be done first. After decomposing the work, normal work
duration calculations are performed.
1)
Compiling
Normal Work Duration and Costs
Based on the project's planned schedule data, the normal work duration
is 126 days, and the total normal direct cost is IDR 6,414,000,000.00 (six
billion four hundred and fourteen million Indonesian Rupiah). The work duration
is adjusted based on the number of work items.
2)
Compiling
Network Planning with CPM
After establishing the dependencies between work items in the Aceh Tengah Regency POM Workshop project, a network plan using the Critical Path Method (CPM) can be created. The critical path, which has the longest duration, is identified, ensuring no delays occur on this path, as shown in Figure 1.
Figure 1
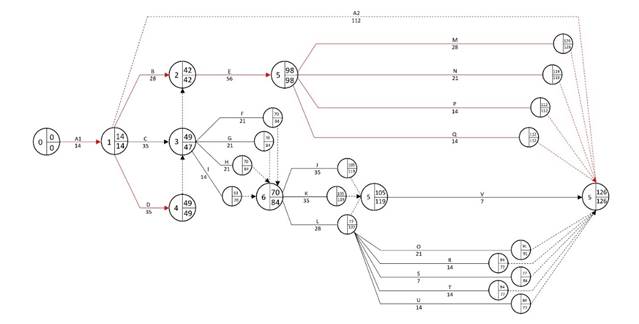
|
Figure 1 Critical Path Method with a Duration of 126 Days |
Furthermore, an alternative was made to accelerate the
project duration by 14 days during the wall construction marked with the symbol
E. Based on the acceleration diagram, it was found that all paths became
critical, with the project duration becoming 112 days, as presented in Figure 2.
Figure 2
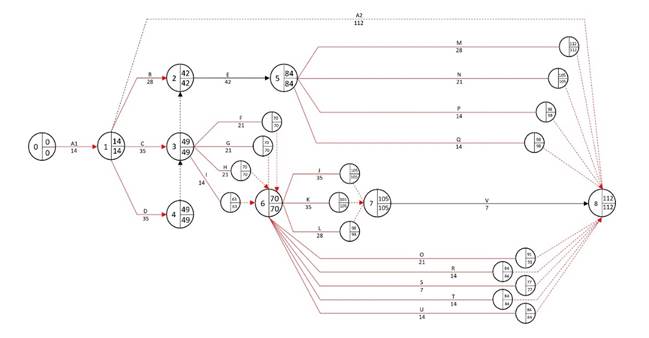
|
Figure 2 Critical Path Method with a Duration of 112 Days |
Therefore, an additional acceleration of 7 days was
implemented, resulting in all paths becoming critical again with a project
duration of 105 days, as shown in Figure 3.
Figure 3
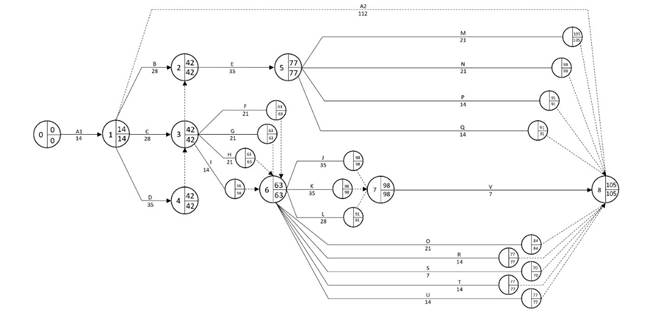
|
Figure 3 Critical Path Method with a Duration of 105 Days |
3) Determining
the Critical Path
After creating a project scheduling diagram using the Critical Path
Method (CPM), it is found that there are 4 critical paths in the network
planning marked by symbols (A-B-E-M), (A-B-E-N), (A-B-E-P), and (A-B-E-Q) with
a work duration of 126 days. These paths are chosen because they have the
longest duration and have been calculated for Total Float, Free Float, and
Independent Float.
Table 1
|
Table 1 Calculation of Float Values After Acceleration by 7 Days |
|||||||||
|
No |
Activity Description |
Event |
SPA |
L |
SPL |
TF |
FF |
IF |
|
|
1 |
A |
Standard preparation work
and RK3K construction work |
0-1 |
14 |
14 |
0 |
0 |
0 |
0 |
|
2 |
B |
Concrete pavement work |
1-2 |
42 |
28 |
14 |
0 |
0 |
0 |
|
3 |
C |
Fence work |
1-3 |
42 |
28 |
14 |
0 |
0 |
0 |
|
4 |
D |
Block paving work |
1-4 |
42 |
28 |
14 |
0 |
0 |
0 |
|
5 |
E |
Curbing work |
2-5 |
77 |
35 |
42 |
0 |
0 |
0 |
|
6 |
F |
Earthwork and foundation
work |
3-6 |
63 |
21 |
42 |
0 |
0 |
0 |
|
7 |
G |
STR 0.00 work |
3-6 |
63 |
21 |
42 |
0 |
0 |
0 |
|
8 |
H |
STR 4.20 work |
3-6 |
63 |
21 |
42 |
0 |
0 |
0 |
|
9 |
I |
Floor 3 STR work |
3-6 |
63 |
14 |
42 |
7 |
7 |
7 |
|
10 |
J |
Steel roof work |
6-7 |
98 |
35 |
63 |
0 |
0 |
0 |
|
11 |
K |
Wall work |
6-7 |
98 |
35 |
63 |
0 |
0 |
0 |
|
12 |
L |
Floor, wall, and ceiling
cover work |
6-7 |
98 |
28 |
63 |
7 |
7 |
7 |
|
13 |
M |
Painting and column
relief work |
5-8 |
105 |
28 |
77 |
0 |
0 |
0 |
|
14 |
N |
Frame, door, and window
work |
5-8 |
105 |
21 |
77 |
7 |
7 |
7 |
|
15 |
O |
Railing work |
6-8 |
105 |
21 |
63 |
21 |
21 |
21 |
|
16 |
P |
Roof covering work |
5-8 |
105 |
14 |
77 |
14 |
14 |
14 |
|
17 |
Q |
Sanitation work |
5-8 |
105 |
14 |
77 |
14 |
14 |
14 |
|
18 |
R |
Electrical work |
6-8 |
105 |
14 |
63 |
28 |
28 |
28 |
|
19 |
S |
Plumbing and fire
extinguisher work |
6-8 |
105 |
7 |
63 |
35 |
35 |
35 |
|
20 |
T |
Air conditioning work |
6-8 |
105 |
14 |
63 |
28 |
28 |
28 |
|
21 |
U |
Ground water tank
structure work |
6-8 |
105 |
14 |
63 |
28 |
28 |
28 |
|
22 |
V |
Ground water tank
architecture work |
7-8 |
112 |
7 |
105 |
0 |
0 |
0 |
4) Calculation
of Triple Duration and Probability Using PERT
The use of this method aims to obtain probabilities, with the previous
accelerated time of 105 days in the network planning becoming the target
duration of 98 days. This method uses the calculation of three-time estimates:
optimistic time (To), standard time (Tm), and pessimistic time (Tp).
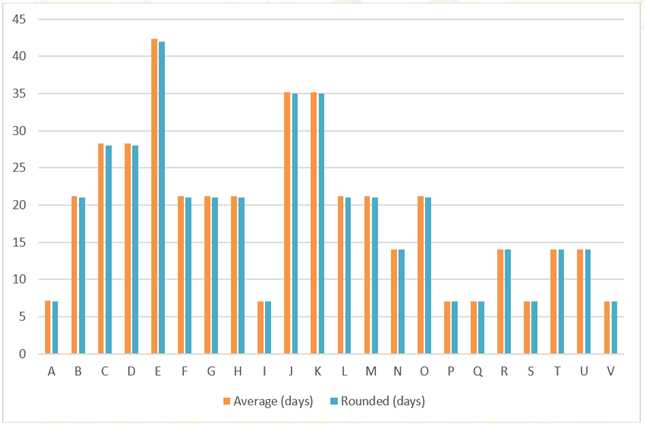
1) Calculation
of Triple Duration: This involves determining optimistic, most
likely, and pessimistic times. For example, for the standard preparation work:
2) Calculating
the Average Value (Te): Te is the average duration used for
constructing the PERT network.
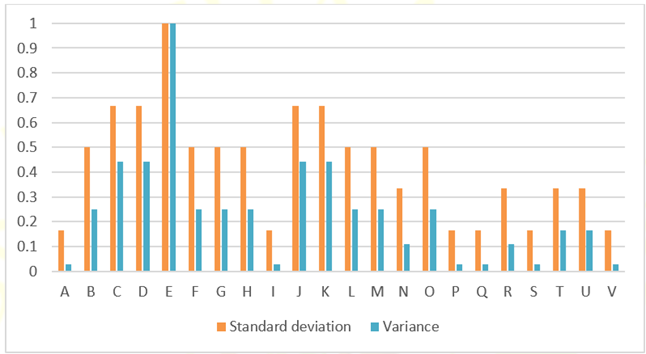
3) Calculating
the Standard Deviation (Se): After obtaining the average value, the next
step is to calculate the standard deviation.
4) Calculating
the Variance (Ve): After calculating the standard deviation,
the variance is calculated.
Figure 4
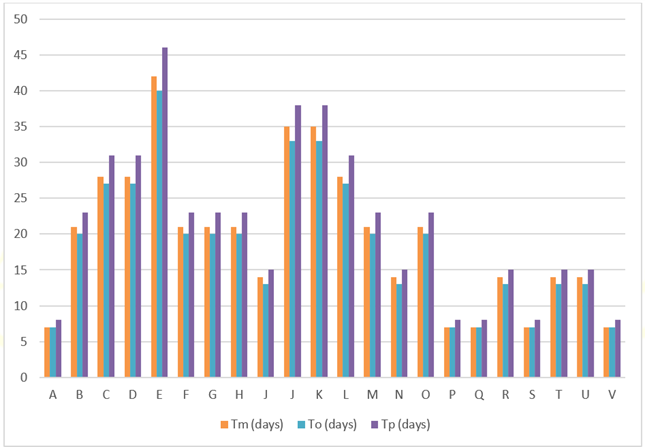
|
Figure 4 Calculation of Tm, To, Tp |
Figure 5
|
Figure 5 Calculation of Average Te |
Using PERT analysis with Te and Ve values, the probability calculations
for critical path activities result.
Figure 6
|
Figure 6 Standard Deviation and Variance Calculation |
From the probability calculation results, it is determined that
completing the project within an accelerated duration of 98 days is not
feasible, reaching only 34.46%. Therefore, it is more efficient to use 105 days
as the probability reaches 99.74%.
5) Time
Control
After implementing time control in the previous calculations, the next step is cost control based on the total cost of IDR 6,414,000,000.00 for both direct and indirect costs. However, in this cost control, only the normal direct costs amounting to IDR 5,778,378,378.38 are considered.
Figure 7
|
Figure 7 Time Control |
After calculating the daily costs with the normal duration in the table above, the next step is to calculate the costs after the duration is accelerated.
Table 2
|
Table 2 Cost Control |
|||||
|
No |
Activity |
Normal duration (days) |
Normal cost (IDR) |
Cost per day (IDR) |
Cost after acceleration
(IDR) |
|
1 |
A |
126 |
64,910,318.73 |
515,161.25 |
72,122,575 |
|
2 |
B |
28 |
763,494,628.39 |
27,267,665.29 |
763,494,628.12 |
|
3 |
C |
35 |
855,116,379.33 |
24,431,896.55 |
1,026,139,655.15 |
|
4 |
D |
35 |
903,506,599.34 |
25,814,474.26 |
1,084,207,919.12 |
|
5 |
E |
56 |
418,475,973.64 |
7,472,785.24 |
575,404,463.64 |
|
6 |
F |
21 |
73,353,273.99 |
2,619,759.75 |
73,353,273.99 |
|
7 |
G |
21 |
208,923,051.55 |
9,948,716.74 |
208,923,051.55 |
|
8 |
H |
21 |
191,325,984.81 |
9,110,761.18 |
191,325,984.81 |
|
9 |
I |
14 |
29,564,176.46 |
2,111,726.89 |
29,564,176.46 |
|
10 |
J |
35 |
417,469,486.63 |
11,927,699.81 |
417,469,486.63 |
|
11 |
K |
35 |
392,712,472.00 |
11,220,356.34 |
392,712,472.00 |
|
12 |
L |
28 |
418,986,902.07 |
14,963,817.93 |
418,986,902.07 |
|
13 |
M |
28 |
73,353,273.99 |
2,619,759.75 |
73,353,273.99 |
|
14 |
N |
21 |
152,409,097.68 |
7,257,576.08 |
152,409,097.68 |
|
15 |
O |
21 |
269,230,216.78 |
12,820,480.51 |
269,230,216.78 |
|
16 |
P |
14 |
57,750,000.00 |
4,125,000.00 |
57,750,000.00 |
|
17 |
Q |
14 |
3,024,500.00 |
216,035.71 |
3,024,500.00 |
|
18 |
R |
14 |
152,918,785.89 |
10,194,585.72 |
152,918,785.89 |
|
19 |
S |
7 |
15,588,000.00 |
2,226,857.14 |
15,588,000.00 |
|
20 |
T |
14 |
124,603,166.31 |
8,900,226.16 |
124,603,166.31 |
|
21 |
U |
14 |
37,477,919.77 |
2,676,994.26 |
37,477,919.77 |
|
22 |
V |
7 |
33,600,000.00 |
4,800,000.00 |
33,600,000.00 |
After performing the calculations above, the normal direct costs, which were previously IDR 5,778,378,378.38, increased to IDR 6,313,951,548.58. Hence, the cost control becomes greater than before, with an increase of IDR 535,573,170.2. The total cost after acceleration amounts to IDR 6,949,573,170.2.
Table 3
|
Table 3 Time and Cost Control |
|||||
|
No |
Activity |
Normal duration (days) |
Acceleration duration
(days) |
Normal Cost (IDR) |
Cost after acceleration
(IDR) |
|
1 |
A |
126 |
105 |
64,910,318.73 |
72,122,575 |
|
2 |
B |
28 |
28 |
763,494,628.39 |
763,494,628.12 |
|
3 |
C |
35 |
28 |
855,116,379.33 |
1,026,139,655.15 |
|
4 |
D |
35 |
28 |
903,506,599.34 |
1,084,207,919.12 |
|
5 |
E |
56 |
35 |
418,475,973.64 |
575,404,463.64 |
|
6 |
F |
21 |
21 |
73,353,273.99 |
73,353,273.99 |
|
7 |
G |
21 |
21 |
208,923,051.55 |
208,923,051.55 |
|
8 |
H |
21 |
21 |
191,325,984.81 |
191,325,984.81 |
|
9 |
I |
14 |
14 |
29,564,176.46 |
29,564,176.46 |
|
10 |
J |
35 |
35 |
417,469,486.63 |
417,469,486.63 |
|
11 |
K |
35 |
35 |
392,712,472.00 |
392,712,472.00 |
|
12 |
L |
28 |
28 |
418,986,902.07 |
418,986,902.07 |
|
13 |
M |
28 |
28 |
73,353,273.99 |
73,353,273.99 |
|
14 |
N |
21 |
21 |
152,409,097.68 |
152,409,097.68 |
|
15 |
O |
21 |
21 |
269,230,216.78 |
269,230,216.78 |
|
16 |
P |
14 |
14 |
57,750,000.00 |
57,750,000.00 |
|
17 |
Q |
14 |
14 |
3,024,500.00 |
3,024,500.00 |
|
18 |
R |
14 |
14 |
152,918,785.89 |
152,918,785.89 |
|
19 |
S |
7 |
7 |
15,588,000.00 |
15,588,000.00 |
|
20 |
T |
14 |
14 |
124,603,166.31 |
124,603,166.31 |
|
21 |
U |
14 |
14 |
37,477,919.77 |
37,477,919.77 |
|
22 |
V |
7 |
7 |
33,600,000.00 |
33,600,000.00 |
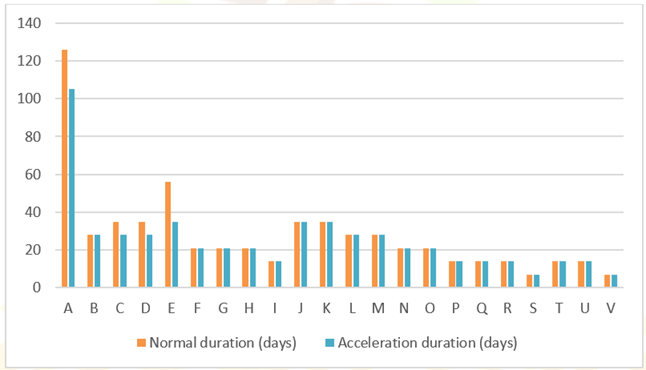
Based on the calculations above, it can be observed that
time and cost control change, resulting in more efficient time and cost
management. The calculation indicates a time acceleration of 105 days, compared
to the previous normal duration of 126 days, with a probability percentage of
99.74%. This means the project can be completed faster than 126 days.
Consequently, the project duration accelerates by 21 days and 0.83% per day.
Regarding cost control, the initial cost of IDR 6,414,000,000.00 increases to
IDR 6,313,951,548.58 when considering only the direct costs, showing an
increase of 0.92% per day. This amounts to a total of IDR 6,949,573,170.2.
Thus, the outcome of time and cost control demonstrates their interdependence;
if the project duration is accelerated, the cost will also increase
accordingly.
4. CONCLUSIONS and RECOMMENDATIONS
The implementation of time and cost control measures in the construction project of Loka POM in Aceh Tengah Regency has proven to be highly effective in optimizing project management, demonstrating the practical implications of employing such measures in construction projects. Through Critical Path Method analysis. This acceleration was further supported by probability calculations using the Program Evaluation and Review Technique, indicating completing the project within the shortened duration. Additionally, efficient cost management was achieved through cost control measures, resulting in a significant adjustment of the initial total cost. These findings highlight the importance of implementing comprehensive time and cost control measures to enhance project management efficiency. Overall, the conclusions drawn from this study are in line with established principles of project management and emphasize the significance of optimizing both time and cost parameters for successful project outcomes. The results provide valuable insights for project managers and stakeholders, offering a clear path toward improving project efficiency and achieving desired outcomes. Further research could explore the theoretical and methodological implications of these findings in diverse project management contexts, contributing to a deeper understanding of effective project optimization strategies.
CONFLICT OF INTERESTS
None.
ACKNOWLEDGMENTS
We extend our appreciation to Universitas Muhammadiyah Aceh for providing access to resources and facilities essential for conducting this research. Their support has been invaluable in the completion of this study.
REFERENCES
Al-Enezi, S. S. S., & Al-Sabah, R. (2023). Comparing Time and Cost Performance of DBB and DB Public Construction Projects in Kuwait. Journal of Engineering Research. https://doi.org/10.1016/j.jer.2023.11.016
Ammar, T., Abdel-Monem, M., & El-Dash, K. (2023). Appropriate Budget Contingency Determination for Construction Projects: State-of-the-Art. Alexandria Engineering Journal, 78, 88-103. https://doi.org/10.1016/j.aej.2023.07.035
Astari, N. M., Subagyo, A. M., & Kusnadi. (2021). Perencanaan manajemen proyek dengan metode CPM (Critical Path Method) dan PERT (Program Evaluation and Review Technique). Jurnal Konstruksia, 13(1), 164-180. https://doi.org/10.22225/pd.4.2.246.13-21
Aziz, R. F. (2014). RPERT: Repetitive-Projects Evaluation and Review Technique. Alexandria Engineering Journal, 53(1), 81-93. https://doi.org/10.1016/j.aej.2013.08.003
Beste, T., & Klakegg, O. J. (2022). Strategic Change Towards Cost-Efficient Public Construction Projects. International Journal of Project Management, 40(4), 372-384. https://doi.org/10.1016/j.ijproman.2022.04.006
Daoud, A. O., El Hefnawy, M., & Wefki, H. (2023). Investigation of Critical Factors Affecting Cost Overruns and Delays in Egyptian Mega Construction Projects. Alexandria Engineering Journal, 83, 326-334. https://doi.org/10.1016/j.aej.2023.10.052
Ketut, N. S. I. (2015). Rencana waktu yang paling mungkin pada proyek konstruksi dengan bantuan program @risk. PADURAKSA: Jurnal Teknik Sipil Universitas Warmadewa, 4(2), 13-21. https://doi.org/10.22225/pd.4.2.246.13-21
Permatasari, T. R., Setyaning, L. B., & Aziz, U. A. (2023). Analisis penjadwalan menggunakan metode Critical Path Method (CPM) pada pembangunan gedung Dindikbud Kabupaten Purworejo. Jurnal Surya Beton, 7(2), 169-175.
Pramesti, H. R., & Listyawan, A. B. (2023). Analisa pengendalian waktu dengan metode Critical Path Method (CPM) pada proyek Pembangunan Pondok Iqro’ Surakarta. Prosiding Seminar Nasional Teknik Sipil, Universitas Muhammadiyah Surakarta, 560-566.
Rahma, K. A., & Kamandang, Z. R. (2023). Analisis penjadwalan proyek Gedung bertingkat menggunakan metode CPM (Critical Path Method) dan PERT (Program Evaluation and Review Technique) (Studi kasus: Proyek Pembangunan tahap I Rumah Sakit Muhammadiyah Gresik). Jurnal Ilmiah Universitas Batanghari Jambi, 23(2), 1275-1279. http://dx.doi.org/10.33087/jiubj.v23i2.4126
Rani, H. A. (2016). Manajemen Proyek Konstruksi. Yogyakarta: Deepublish.
Rani, H. A. (2021). Fungsionalitas Manajemen Proyek dalam Kesuksesan Proyek Konstruksi. Yogyakarta: Deepublish.
Saleh, S. S., Alansari, I. S., Hamiaz, M. K., Ead, W., Tarabishi, R. A., Farouk, M., & Khater, H. A. (2023). I-OPC: An Intelligent Optimal Path Computation System using Critical Path Prediction and Deep Learning for a Time-Sensitive Network. Alexandria Engineering Journal, 84, 138-152. https://doi.org/10.1016/j.aej.2023.10.025
Syammaun, T., Rani, H. A., & Rahmat, F. (2019). Optimalisasi waktu dan biaya Dengan Metode Precedence Diagram Method. Tameh: Journal of Civil Engineering, 8(1), 1-12.
Trietsch, D., & Baker, K. R. (2012). PERT 21: Fitting PERT/CPM for use in the 21st century. International Journal of Project Management, 30(4), 490-502. https://doi.org/10.1016/j.ijproman.2011.09.004
Wicaksono, A. B., & Setiawan, B. (2023). Analisa pengendalian waktu menggunakan metode Critical Path Method (CPM) pada proyek struktur rangka atap baja Stasiun KCIC Karawang. Jurnal Darma Agung, 31(3), 50-58. http://dx.doi.org/10.46930/ojsuda.v31i3.3330
Yang, J. B., & Kao, C. K. (2012). Critical Path Effect-Based Delay Analysis Method for Construction Projects. International Journal of Project Management, 30(3), 385-397. https://doi.org/10.1016/j.ijproman.2011.06.003
 This work is licensed under a: Creative Commons Attribution 4.0 International License
© Granthaalayah 2014-2024. All Rights Reserved.