THE RELATIONSHIP BETWEEN BENDING STRENGTH AND POROSITY IN CERAMIC BRICK THAT CONTAINS VERMICULITE
Dr. Umut Önen 1![]()
![]() ,
Dr. Tahsin Boyraz 2
,
Dr. Tahsin Boyraz 2![]()
![]()
1 Assistant
Professor, Metallurgical and Materials Engineering, Mersin University, Mersin, Turkey
2 Associate
Professor, Metallurgical and Materials Engineering, Sivas Cumhuriyet
University, Sivas, Turkey
|
|
|
ABSTRACT |
|
|
This study
focused on the characterization, product, and relationship between bending
strength and porosity of ceramic bricks with added vermiculite. To achieve
this goal, pre-made bodies containing 0%, 10%, and 20% calcined vermiculite
by weight were mixed in to create the body compositions. Alumina ball
manufactories homogenized fusions (60 rpm, 24 hours) were molded through
uniaxial dry pressing (100 MPa). Additionally, the arranged samples were
heated to a temperature of 800-1000 °C for a duration of 1 hour. Tests
involving phase analysis (XRD), microstructure (SEM), mechanical properties
(three point bending), and physical characteristics (Porosity, water
absorption, shrinkage and bulk density) were carried out on the demitasse
bodies that were manufactured. The data that was collected was displayed in
graphs and tables, showing the results. As a result, the packages containing
samples of vermiculite were effectively created, and the best parameters were
easily displayed. The findings indicate that the quality of flawed packages
improves as calcined vermiculite levels rise. Following the characterization
results, the correlation between bending strength and porosity was
investigated. Correlations, t-tests, and p-values were computed. The
inclusion of vermiculite in ceramic bricks results in a significant negative
correlation of -0.769 between their bending strength and porosity
characteristics. |
|||
|
Received 02 April 2024 Accepted 05 May 2024 Published 31 May 2024 Corresponding Author Dr. Umut
Önen, umutonen@mersin.edu.tr DOI 10.29121/IJOEST.v8.i3.2024.593 Funding: This research
received no specific grant from any funding agency in the public, commercial,
or not-for-profit sectors. Copyright: © 2024 The
Author(s). This work is licensed under a Creative Commons
Attribution 4.0 International License. With the
license CC-BY, authors retain the copyright, allowing anyone to download,
reuse, re-print, modify, distribute, and/or copy their contribution. The work
must be properly attributed to its author.
|
|||
|
Keywords: Ceramic, Brick,
Vermiculite, Bending Strength, Porosity, Correlation |
|||
1. INTRODUCTION
Due to
the abundance of clay in the world and the ease, simplicity and cost of brick
production, bricks are widely used in many areas, especially as building
materials. Due to the brick industry's ability to add different compounds
during the mixing process, research has been conducted to highlight the effect
of these additions on fired clay bricks. To improve energy efficiency, it is
necessary to enhance the thermal insulation properties of bricks. One method
for producing bricks involves adding pore-forming additives. Thermal
decomposition and volatilization are used to form pore-forming materials, such
as organic residues, wood sawdust, coal dust, polystyrene, papermaking sludge,
powder limestone and heat-resistant porous materials in brick body have been
widely used. In this sense, vermiculite is a material that can be utilized as a
pore former. Sutcu (2015), Muñoz et al. (2014), Zhang et al. (2018), Monteiro & Fontes Vieira (2014), Muñoz et
al. (2016), Zhang (2013), Effting et al. (2007), Aouba et al. (2016), Muñoz et al. (2020), Sarani et al. (2018), Achik et al. (2021), Elavarasan et al. (2021), Sutcu et al. (2015), Phonphuak et al. (2019).
'Vermiculite' is named after the Latin word 'Vermicularis', which means wormlike, and it is formed by the abrupt exposure of crystals to high temperature, resulting in curved, elongated, and twisted columns. One of the groups of phyllosilicate minerals, Vermiculite is a mica-like mineral that has a shiny flake. The expansion of vermiculite occurs at temperatures between 650-950 °C. The expansion process is known as exfoliation. The expansion and convection of vermiculite into loose, lightweight fragments, similar to ''popcorn'', is similar to that of ''popcorn'', and is separated by air entrainment when heated. The natural occurrence of vermiculite comprises hydrated Mg/Fe/Al silicate minerals (mica-like), which form a laminate structure and come in a range of light brown/grey/gold colors. Vermiculite is also a very adaptable mineral with amazing qualities including low density, odorlessness, inertness, ease of handling, low thermal coefficient, strong thermal and absorption capacity, acoustic insulation, fire resistance, refractory nature, and non-combustion material. To exfoliate or expand its size, this material is mined, pulverized, and heated to over 300°C, ranging in size from 210 mm in diameter. Most applications require vermiculite to be exfoliated. Vermiculite's thermal conductivity, low density, and high melting temperature make it a viable option for fillers in the production of heat-insulating refractory materials. The material that is most commonly found in vermiculite is made up of Al2O3 (10-13), SiO2 (57%-42 wt%), Fe2O3 (5-17), MgO (14-12), H2O (8-18), and FeO Suvorov & Skurikhin (2003), Anitha et al. (2023), Rashad (2016) . Research findings suggest that vermiculite holds promise as a building material and can serve as an aggregate in lightweight concrete and plaster due to its exceptional thermal, fire, and sound insulation properties. Notably, vermiculite exhibits low specific gravity, high flame and heat resistance, and a significant ion exchange capacity, rendering it valuable in various sectors including construction, agriculture, animal husbandry, and wastewater treatment Onen et al. (2017), Spirina & Flerova (1975), Suvorov & Skurikhin (2002), Silva Jr et al. (2014). Vermiculite's potential use as a building material is a possibility given the studies' results. Due to its exceptional thermal, fire, and sound insulation properties, it is also suitable for use as an aggregate in lightweight concrete and plaster. According to Park and Ngayakamo, Kalalani vermiculite can be used as a raw ingredient in the production of porcelain insulators of high strength Ngayakamo & Park (2019).
Correlation analysis assesses the existence and strength of linear relationships between two variables, as indicated by the correlation coefficient. This coefficient ranges from 1 to -1, with negative values signifying a negative relationship, positive values indicating a positive relationship, and values nearing zero suggesting a weak relationship. Perfect correlation occurs when the coefficient is either 1 or -1. In the field of ceramics and materials science, correlation coefficient (r), along with t-tests and p-values, are commonly employed for various studies. These include investigating correlations between powder properties and sintering behaviours, phase transitions and luminescent properties, as well as crystalline phases and optical reflectance Prasada et al. (2010), Lee & Kim (2009), Park & Shin (2002).
This study aims to assess the correlations between bending strength and porosity properties in ceramic brick doped with vermiculite. The correlation coefficient will quantify the degree and direction of the relationship between these quantitative variables, using the Pearson correlation coefficient due to the continuous nature of our data. Additionally, the significance of these correlations will be tested to determine their reliability and statistical validity.
2. MATERIALS AND METHODS
The properties of brick bodies
were studied through the use of vermiculite obtained from the Organic Mining
region in Sivas, Turkey. The body compositions were formed by adding ready-made
brick bodies (Corum Brick, Turkey) and calcined vermiculite %0 - 20 by weight.
An electric furnace with a temperature of 1050 degrees C was used to calcine
the raw vermiculite for one hour. Brick bodies that were already made were
dried and turned into powder. XRF (Thermo ARL) analysis results for calcined
and raw vermiculite, as well as ceramic brick, are presented in Table 1. B10V900 was the code for the samples, which included B: Brick; 10V: 10%
vermiculite addition and 900: 900 °C firing temperature. The mixtures were wet
mixed in alumina ball mills at 60 rpm for 24 hours and dried in the oven at 110
degrees for 24 hours. The powder mixtures, which were dried and made ready for
shaping, were shaped into 10x30x70 mm dimensions by uniaxial dry pressing under
100 MPa pressure. After preparation, the press samples were fired at 800-1000
degrees Celsius for an hour. The produced brick samples were tested for
mechanical, physical properties, microstructure, and phase analysis.
A digital calliper was used to
measure and calculate the shrinkage percentage of the sintered samples.
Archimedes' principle (ASTMC373-88) was used to calculate density, porosity,
and water absorption tests. The samples were tested for bending strength at
three points using a mechanical tester with a load sensing of 1 N and a power
of 5 kN. The strength values of the samples were determined by the average
results of five measurements taken for each sample. Using the naked eye, the
color analysis of the samples was evaluated under visible light. Color changes
can be identified as either increasing or decreasing darkening and color
differences depending on the increasing additive ratios and firing
temperatures. The samples were scanned
with Mira3XMU FE-SEM (Tescan, Czech Republic) and the energy dispersive
spectrum (EDX) analysis were performed as well. Graphs and tables were used to
present the obtained data, and comments were made. A Panalytical X'Pert Powder
X-ray diffraction (XRD) analyzer used for X-ray evaluation was employed to
analyze the samples in terms of 40 to 700 Angstrom. The Pananalytical X'Pert
High Score program was used to determine the phases of the XRD patterns. Onen et al. (2017), Spirina & Flerova (1975), Silva
Jr et al. (2014).
Table 1
|
Table 1 The Chemical Makeup of Vermiculite and Brick Powders that have been Raw and Calcined |
|||
|
%w |
Calcined vermiculite |
Raw vermiculite |
Brick |
|
TiO2 |
2,4 |
2,18 |
1,10 |
|
CaO |
3,9 |
3,54 |
7,35 |
|
SiO2 |
40,61 |
36,9 |
46,60 |
|
Al2O3 |
19,48 |
17,7 |
15,30 |
|
MgO |
18,05 |
16,4 |
6,54 |
|
CaO |
3,9 |
3,54 |
7,35 |
|
Fe2O3 |
12,31 |
11,2 |
10,17 |
|
K2O |
2,91 |
2,64 |
2,59 |
|
Na2O |
0,17 |
0,15 |
1,21 |
|
MnO |
0,17 |
0,15 |
- |
|
LOI |
- |
9,14 |
9,21 |
The Pearson correlation
coefficient was employed for correlation analyses, and subsequently, a t-test
was conducted to assess whether the correlation coefficient significantly
deviated from zero. The significance of the correlation was determined by
calculating a p-value based on the t-distribution table.
3. RESULTS AND DISCUSSIONS
Table 2, Figure 1 and Figure 2 presents the outcomes of physical and mechanical assessments, including
water absorption, bulk density, porosity, and shrinkage. It was observed that
as the sintering temperature increased, there was a rise in shrinkage, bending
strength and bulk density values, while water absorption and porosity values
decreased. These trends were consistent across samples with vermiculite
additions as well.
Table 2
|
Table 2 Test Results of Samples with and without Vermiculite Additives |
|||||
|
Samples |
Bulk density |
Water Absorption |
Shrinkage |
Bending Strength |
Porosity |
|
gr/cm3 |
% |
% |
MPa |
% |
|
|
B00V800 |
1,55 |
25,06 |
5,51 |
9,05 |
39,17 |
|
B10V800 |
1,59 |
24,04 |
5,55 |
9,24 |
36,52 |
|
B20V800 |
1,61 |
20,44 |
5,62 |
9,51 |
35,52 |
|
B00V900 |
1,58 |
24,29 |
6,02 |
10,52 |
38,25 |
|
B10V900 |
1,60 |
23,61 |
6,41 |
11,02 |
35,01 |
|
B20V900 |
1,62 |
19,89 |
6,82 |
11,55 |
33,82 |
|
B00V1000 |
1,61 |
23,48 |
6,52 |
13,82 |
36,15 |
|
B10V1000 |
1,62 |
22,40 |
7,35 |
14,83 |
33,56 |
|
B20V1000 |
1,63 |
19,63 |
7,75 |
15,96 |
30,52 |
Between Figure 1 and Table 2, the results of
physical measurements are presented. As the sintering temperature increases,
the results show an increase in, shrinkage, bulk density and bending strength
values. The sintering temperature increased, leading to a decrease in porosity
and water absorption values. Vermiculite added samples also experienced
increases and decreases.
The test results showed that
there was an increase in the % shrinkage with the increase of vermiculite
addition and sintering temperature. While this increase was 5.51% in pure brick
samples fired at 800 degrees, it was measured as 6.522% in samples fired at
1000 degrees. The shrinkage in samples with 20% vermiculite added was found to
be 5.62% in bricks fired at 800 degrees and 7.75% in bricks fired at 1000
degrees. Porosity results decreased with increasing vermiculite and sintering
temperatures. While it was 39.17% for pure bricks fired at 800 degrees, it was
36.15% for bricks fired at 1000 degrees. While this rate was 35.52% in samples
with 20% vermiculite added and fired at 800 degrees, it was 30.52% in samples
produced at 1000 degrees. Similarly, the densities increased in proportion to
the sintering temperature and the amount of vermiculite. While the density
obtained for pure bricks at 800 degrees is 1.55 g/cm3, the density
for 1000 degrees is calculated as 1.61 g/cm3. In 20% vermiculite
added samples, these values were measured as density 1.61 g/cm3
for 800 degrees and 1.63 g/cm3 for 1000 degrees. Water absorption
values also decreased with increasing temperature and additive
amount. While it was 25.06% at 800 degrees without additives, it was found to
be 23.48% at 1000 degrees. For baked bricks with vermiculite addition, these
values are 20.44% and 19.63%. The strength test results showed
that there was an increase with increasing sintering temperature and the
addition of vermiculite. The measured value of 9.05 MPa in bricks fired without
additives at 800 degrees became 13.82 at 1000 degrees. The 3-point bending
strength results of 20% vermiculite added samples are 9.51 MPa and 15.96 MPa (Table 2, Figure 2).
Figure 1
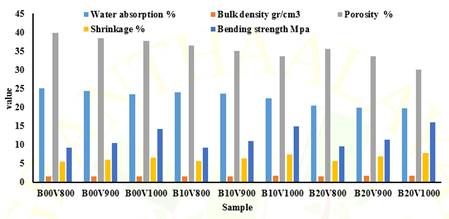
|
Figure 1 The Test Results of Bricks and Vermiculite-Added Brick Samples |
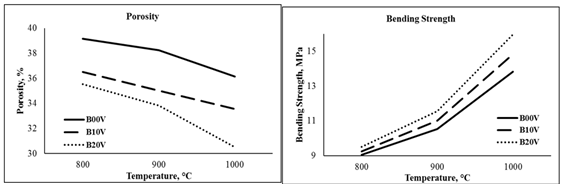
|
Figure 2 The Bending Strength and Porosity Graphs of Brick Samples are Presented Here |
Figure 3 shows that the brownish
colour of the samples increased from light to dark with increasing vermiculite
when examined. The sintering temperature increase resulted in the colour
becoming darker.
Figure 3
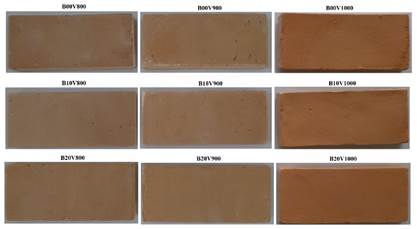
|
Figure 3 Macro Images of Bricks Samples |
Phlogopite, tridymite, anorthite and quartz phases
were detected in the XRD graphs obtained after firing of bricks with and
without vermiculite added. Anorthite (96-900-0363), tridymite (96-901-3394) and
quartz (96-900-9667) phases were detected in pure bricks fired at 1000 degrees.
Firing temperature caused an increase in the apparent peak and intensity of the
tridymite and anorthite phases, as observed. In bricks fired at 1000 degrees
with 20% vermiculite, phlogopite, tridymite, anorthite and quartz phases were
detected as the firing temperature increased and the peak densities of
crystallized anorthite and tridymite phases in the material increased (Figure 4).
Figure 4
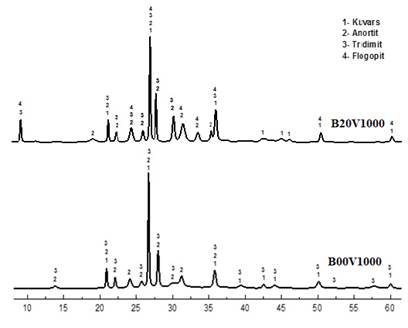
|
Figure 4 The XRD Patterns of Brick Samples Sintered at 1000 °C with No Doping and 20% Vermiculite Added |
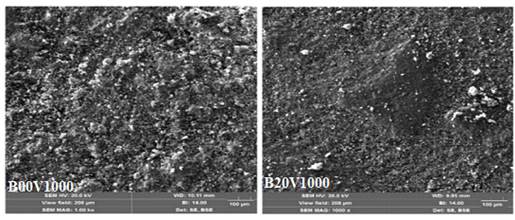
It was calculated that with
increasing firing temperature and increasing vermiculite, the porosity of the
samples decreased and their density increased. In SEM images, it was observed
that the micropores in the structure became smaller as the temperature and
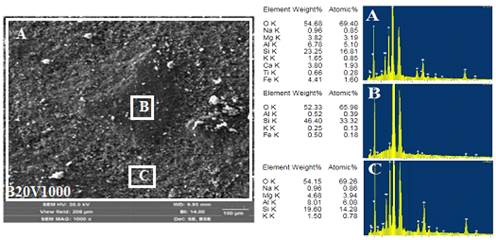
vermiculite content increased. General A and B, C regional results were used to
evaluate the EDX analysis results of brick samples baked at 1000 degrees with
20% vermiculite. XRF data confirms that the overall results from region a are
correct. The X-ray pattern findings of the sample are in accordance with
regional points B and C. There is quartz phase at point B and phlogopite phase
at point C (Figure 5 and Figure 6).
Figure 5
|
Figure 5 SEM Images of B20V800 and B20V1000 Brick Samples |
Figure 6
|
Figure 6 EDX Analyses of B20V1000 Brick Samples. |
4. Pearson Correlation coefficient, t-test and p value
This study is aimed at calculating the relationships between bending
strength and porosity properties in ceramic bricks doped with vermiculite. The
strength of the relationship between two quantitative variables, regardless of
whether it is positive or negative, is represented by the correlation
coefficient. The Pearson correlation coefficient will be used since our data is
based on continuous variables. The statistical measure of the strength of the
association between two variables and their relationship with one another is
known as the Pearson correlation coefficient, sometimes known as Pearson's r. To
put it simply, the Pearson correlation coefficient determines how much a change
in one variable affects another. The significance of the correlations will also
be tested. The final step is to create the graphics.
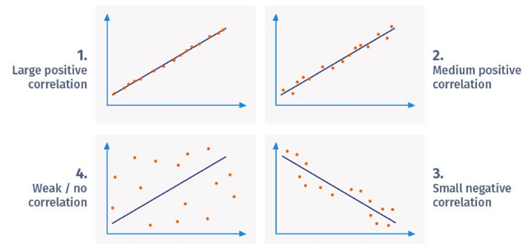
A linear relationship between
two variables can be determined by correlation. To put it differently, it
illustrates whether changes in variables have an impact on each other.
Correlation coefficient is a value used to show the relationship between variables.
The variable takes a value between -1 and 1 when calculated with the formula
below. A negative relationship is indicated by negative values, and a positive
relationship is indicated by positive values. A perfect relationship exists
when the values are 1 or -1. When the values approach 0, the relationship
between the variables decreases (Figure 7).
Figure 7
|
Figure 7 Pearson Correlation Coefficient Examples. |
The statistical significance of
the correlation between Pearson's coefficient and other factors is high. The
relationship between two variables is the subject of examination. It endeavors
to depict the relationship between two variables by drawing a line through
their data. The Pearson correlation coefficient equation 1 was used to
calculate the relationship between the variables. A positive or negative
outcome can be expected from the relationship that is calculated. If the result
is negative, there is a negative correlation between the two variables, and
when the result is positive, there is a positive correlation relationship
between the variables.
Pearson correlation coefficient
(r):
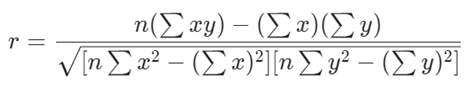 (1)
(1)
N = The total number of point
pairs.
Σxy = Pair scores' sum of
products is xy
Σx = The total sum of x values
Σy = The total sum of y values
Σx2 = Sum of
squared x values
Σy2 = Sum of
squares of y values
Based on the survey sample, a
t-test can be used to assess whether the Pearson correlation coefficient is
substantially different from zero. The sample size is denoted by n, and the
correlation coefficient by r.
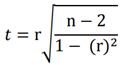 (2)
(2)
To ascertain the significance
and validity of the Pearson correlation coefficient, a t-test is conducted
based on the examined sample. This test determines whether the coefficient
significantly differs from zero. Subsequently, a p-value is derived from the
computed test statistic t. If the obtained p-value falls below the designated
significance level, typically set at 5%, the null hypothesis is refuted;
otherwise, it is retained.
In the context of a t-test, the
conventional threshold for significance is typically set at p = 0.05.
Essentially, the p-value represents the likelihood of observing a mean
difference purely by chance, assuming there is no true disparity within the
population. When the p-value obtained from a t-test is below 0.05, the result
is deemed statistically significant. Conversely, if the p-value exceeds 0.05,
the finding is considered insignificant. The p-value is derived from the t
distribution table and is calculated as 2 times the probability of obtaining a
value greater than the observed t statistic, where T follows a t distribution
with degrees of freedom equal to n – 2.
Figure 8
|
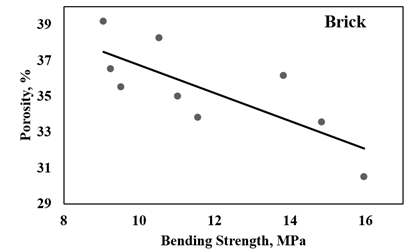
Figure 8 Bending Strength - Porosity Correlation Graphs of Ceramic Bricks. |
A correlation coefficient of
-0.769 was determined for ceramic brick (Figure 8). The negative slope indicates that as one variable increases, the
other variable decreases, illustrating a negative linear relationship. This
suggests that changes in one variable are inversely related to changes in the
other variable.
When the correlation coefficient
(r) exceeds 0.5 or falls below -0.5, it indicates that the data points closely
align with the best-fit line, indicating a strong negative correlation. In this
study, a strong negative correlation of -0.769 was observed between the bending
strength and porosity properties of vermiculite-enhanced ceramic brick. The
calculated t-test values were -6,365. Based on the t distribution table, the
p-value was determined to be less than 0.001 for ceramic brick (refer to Table 3). Consequently, it has been established that there exists a robust
negative association between 3-point bending strength and porosity in
vermiculite-augmented ceramics.
Table 3
|
Table 3 Correlation Coefficient (r), t-test and p Values of Ceramic Brick |
|||
|
Materials |
Correlation coefficient, r |
t |
p |
|
Ceramic Brick |
-0,769 |
-6,365 |
˂0,001 |
5. CONCLUSIONS and RECOMMENDATIONS
Benefitful outcomes were achieved through the investigation of
vermiculite's use in brick manufacturing in this study.
1)
As the sintering temperature increases, the results show an increase in
bulk density, shrinkage, and bending strength values. The sintering temperature
increased, leading to a decrease in porosity and water absorption values.
Vermiculite added samples also experienced increases and decreases.
2)
The red-brownish color of the sintered samples, due to the iron oxide
content, increased from light to dark with the addition of vermiculite and
increasing sintering temperatures.
3)
Phlogopite, Anorthite, Quartz, and Tridymite were revealed in the XRD
pattern of bricks sintered at 1000 °C, which were not doped. The firing
temperature increased, resulting in an increase in the apparent peak and
intensities of the tridymite and anorthite phases.
4)
There is a strong negative correlation of -0.769 between the bending
strength and porosity properties of vermiculite-added ceramic bricks.
5)
The calculated t-test value is -6,365. From the t distribution table,
the p value was found to be p˂0.001 for all three ceramic materials.
As a result, it has been revealed that there is a strong negative relationship between 3-point bending strength and porosity in vermiculite added ceramics.
CONFLICT OF INTERESTS
None.
ACKNOWLEDGMENTS
None.
REFERENCES
Achik, M., Benmoussa, H., & Oulmekki, A. (2021). Evaluation of Technological Properties of Fired Clay Bricks Containing Pyrrhotite Ash, Construction and Building Materials, 269. https://doi.org/10.1016/j.conbuildmat.2020.121312
Anitha, A., Kalpana, V.G., & Muthupriya, P. (2023). Influence of Vermiculite and Sintered Fly Ash in Robustness and Hardened Properties of Light Weight Self-Compacting Concrete, J. Ceram. Process. Res, 24(1), 182-189.
Aouba, L., Bories, C., Coutand, M., Perrin, B., & Lemercier, H. (2016). Properties of Fired Clay Bricks with Incorporated Biomasses: Cases of Olive Stone Flour and Wheat Straw residues, Construction and Building Materials. 102(1), 7-13. https://doi.org/10.1016/j.conbuildmat.2015.10.040
Effting, C., Güths, S., & Alarcon, O. E. (2007). Evaluation of the Thermal Comfort of Ceramic Bricks, Materials Research, 10(3), 301-307. https://doi.org/10.1590/S1516-14392007000300016
Elavarasan, S., Priya, A.K., & Kumar, V. K. (2021). Manufacturing Fired Clay Brick Using Fly Ash and M−Sand, Materials Today: Proceedings, 37(2), 872-876. https://doi.org/10.1016/j.matpr.2020.06.042
Lee, J. H., & Kim, Y. J. (2009). A Correlation Between a Phase Transition and Luminescent Properties of Sr2SiO4:Eu2+ Prepared by a Flux Method, J. Ceram. Process. Res, 10(1), 81-84.
Monteiro, S.N., & Fontes Vieira, C.M. (2014). On the Production of Fired Clay Bricks from Waste Materials: A Critical Update, Construction and Building Materials, 68, 599-610. https://doi.org/10.1016/j.conbuildmat.2014.07.006
Muñoz, V. P., Morales O. M.P., Letelier G. V., Mendívil G. M.A. (2016). Fired Clay Bricks Made by Adding Wastes: Assessment of the Impact on Physical, Mechanical and Thermal Properties, Construction and Building Materials, 125, 241-252. https://doi.org/10.1016/j.conbuildmat.2016.08.024
Muñoz Velasco, P., Morales Ortíz, M.P., Mendívil Giró, M.A., Muñoz Velasco, L. (2014). Fired Clay Bricks Manufactured by Adding Wastes as Sustainable Construction Material-A Review, Construction and Building Materials, 63, 97-107. https://doi.org/10.1016/j.conbuildmat.2014.03.045
Muñoz, P., Letelier, V., Bustamante, M.A., Marcos-Ortega J., Sepúlveda J.G. (2020). Assessment of Mechanical, Thermal, Mineral and Physical Properties of Fired Clay Brick Made by Mixing Kaolinitic Red Clay and Paper Pulp Residues, Applied Clay Science, 198. https://doi.org/10.1016/j.clay.2020.105847
Ngayakamo, B., Park, S., (2019). Evaluation of Kalalani Vermiculite for Production of High Strength Porcelain Insulators, Science of Sintering, 51(2). https://doi.org/10.2298/SOS1902223N
Onen, U., Ercenk, E., & Yılmaz, Ş. (2017). Development of Machinable Glass-. Ceramics Produced from Vermiculite. Acta Phys. Pol. A. 131, 168-170. https://doi.org/10.12693/APhysPolA.131.168
Park, K.H., & Shin, D.W. (2002). The Correlation Between the Crystalline Phases and Optical Reflectance in Glass Ceramics for IR Reflector, J. Ceram. Process. Res, 3(3), 153-158.
Phonphuak, N., Saengthong, C., & Srisuwan, A. (2019). Physical and Mechanical Properties of Fired Clay Bricks with Rice Husk Waste Addition as Construction Materials, Materials Today: Proceedings, 17(4), 1668-1674. https://doi.org/10.1016/j.matpr.2019.06.197
Prasada, D. H., Leea, J., Lee, H.W., Kim B.K., & Park, J.S. (2010). Correlation between the Powder Properties and Sintering Behaviors of Nano-Crystalline Gadolinium-Doped Ceria, J. Ceram. Process. Res, 11(5), 523-526.
Rashad, A. M. (2016). Vermiculite as a Construction Material-A Short Guide for Civil Engineer, Construction and Building Materials, 125, 53-62. https://doi.org/10.1016/j.conbuildmat.2016.08.019
Sarani, N.A., Kadir, A.A., Abdul Rahim, A.S., & Mohajerani, A. (2018). Properties and Environmental Impact of the Mosaic Sludge Incorporated into Fired Clay Bricks, Construction and Building Materials, 183, 300-310. https://doi.org/10.1016/j.conbuildmat.2018.06.171
Silva Jr, C.N., Pimentel, P.M., Oliveira, R.M.P.B., Melo D.M.A., & Jsilva, E.C. (2014). Preparation of Glass-Ceramics from Vermiculite Clay Mineral, J. Ceram. Process. Res, 15(5), 360-365.
Spirina, V. S., & Flerova, M. I. (1975). Expanded Vermiculite as Heat Insulation Material. Refractories, 16(3-4), 201-203. https://doi.org/10.1007/BF01661229
Sutcu, M. (2015). Influence of Expanded Vermiculite on Physical Properties and Thermal Conductivity of Clay Bricks, Ceramics International, 41(2), Part B, 2819-2827. https://doi.org/10.1016/j.ceramint.2014.10.102
Sutcu, M., Alptekin, H., Erdogmus, E., Er, Y., & Gencel, O. (2015). Characteristics of Fired Clay Bricks with Waste Marble Powder Addition as Building Materials, Construction and Building Materials, 82, 1-8. https://doi.org/10.1016/j.conbuildmat.2015.02.055
Suvorov, S. A., & Skurikhin, V. V. (2002). High-Temperature Heat-Insulating Materials Based on Vermiculite. Refractories and Industrial Ceramics, 43(11-12), 383-389. https://doi.org/10.1023/A:1023449128786
Suvorov, S. A., & Skurikhin, V. V. (2003). Vermiculite-a Promising Material for High Temperature Heat Insulators, Refractories and Industrial Ceramics, 44(3), 186-193. https://doi.org/10.1023/A:1026312619843
Zhang, L. (2013). Production of Bricks from Waste Materials-A Review, Construction and Building Materials, 47, 643-655. https://doi.org/10.1016/j.conbuildmat.2013.05.043
Zhang, Z., Wong, Y.C., Arulrajah, A., Horpibulsuk, S. (2018). A Review of Studies on Bricks using Alternative Materials and Approaches, Construction and Building Materials, 188, 1101-1118. https://doi.org/10.1016/j.conbuildmat.2018.08.152
 This work is licensed under a: Creative Commons Attribution 4.0 International License
© Granthaalayah 2014-2024. All Rights Reserved.