
|
|
|
|
APPLICATION OF REMOTE SENSING AND GEOGRAPHIC INFORMATION SYSTEM (GIS) TO ANALYSE THE IMPACT OF LAND USE ON THE WETLANDS IN PORT HARCOURT AND OBIO/ AKPOR L.G.A. RIVERS STATE, NIGERIA
Richard J. U. 1
|
|
|
|


Article Type: Research Article
Article Citation: Richard J. U., and Ibochi Andrew Abah. (2020). APPLICATION OF REMOTE SENSING AND GEOGRAPHIC INFORMATION SYSTEM (GIS) TO ANALYSE THE IMPACT OF LAND USE ON THE WETLANDS IN PORT HARCOURT AND OBIO/ AKPOR L.G.A. RIVERS STATE, NIGERIA. International Journal of Research -GRANTHAALAYAH, 8(5), 355 – 364. https://doi.org/10.29121/granthaalayah.v8.i5.2020.242
Received Date: 16 May 2020
Accepted Date: 31 May 2020
Keywords:
Change Detection
GIS
Land Use/ Cover
Landsat Image
Supervised Classification
Wetlands
ABSTRACT
The study area is in verge the state of wetlands extinction due to over utilization and lack of regulations that will ensure effective management of its resources. The study areas: Port Harcourt and Obio/ Akpor L.G. As are undergoing rapid urban and industrial expansion due to available natural resources and these activities have degraded the wetlands which hither-to represent the source of living for the people. This study investigated the impact of land use/ land cover on wetlands in Port Harcourt and Obio/ Akpor L.G. As using GIS and remote sensing approach. The study was conducted using Landsat satellite image of 2000, 2007, and 2013 to analysed change in land use/ cover as a result of the aforesaid activities. The supervised classification method in ENVI 5.0 software was adopted and change detection analysis was computed in order to examine change in land use that has impacted on wetlands habitat. The change results show percentage decrease in water body by -0.39% from 2000 to 2007 and -0.70% from 2000 to 2013, built-up areas also increased by 11.95% from 2000 to 2007 and 28.47% from 2000 to 2013. Similarly, wetlands decreased by -13.52% from 2000 to 2013. Therefore, it was concluded that urbanization in built-up, industrial, and dredging activities are the main causes of wetlands loss in the area with most wetlands being converted to built-up areas and dredged sites. The study justified the ability of remote sensing and GIS software for modelling wetlands change over these periods.
1. INTRODUCTION
Wetlands in Africa covered a total land area of 5.6 million square kilometer representing 16 per cent of the continent land mass [1]. It has also been estimated that wetlands cover 6 per cent land areas in the world [2]. In Nigeria wetlands covers an estimated land area of 28,000km2 [3], while in south-eastern Nigeria wetlands accounted for 22,895km2 of land area [4]. [5] Classified wetlands as one of the special aquatic sites for many biodiversity. Wetlands serve as special habitat for plants, animals, and others aquatic species in the world. It limits flood and storm impact, protects and improved water quality and quantity, provides important fish spices and wildlife habitat, site for recreational activities, hunting, and fishing [6], [7], [8]. Wetlands according to [9] stated that it has ecological, economical and aesthetic functions. The important of wetlands in the world was realized with a conference held by over 150 members countries and in that conference, 2nd February was marked every year for the celebration of wetlands during the Iranian city of Ramsar convention in 1971 [10].
Wetlands have been divided according to its formation, nutrient status, thermal characteristics, and vegetation types [10]. It is characterized as marsh wetlands, swamp wetlands, bog wetlands, and fen wetlands [11]. Also, other researchers categorized wetlands as marsh, swamp, bog, fen, wet prairie, farmed wetland, and wet meadow [12]. Similarly, [13] stated that wetlands can be identified by the soils and vegetation type and further characterized wetlands as marshes, swamps, and bogs. [14] Classified wetlands as exceptional with 150ft buffer, intermediate with 50ft buffer, and ordinary without transition area buffer wetlands. Wetlands areas are not easily identified but researchers have proposed attribute of wetlands. [15] Listed abundance of water, hydric soil, and presence of plants in the soil as the attribute of wetlands. Also [16] listed in their manual vegetation, soil, and hydrology as the means of recognizing wetlands areas. Wetlands recognition encourages precise determination and delineation of wetlands areas. However, the various classifications and identification may be due to individual country guidelines on wetlands delineation.
At unthreatened stage and condition wetlands can provide favourable condition for food storage, recreational uses, shoreline protection, fishing, bird watch, hunting, and erosion mitigation. However, when impacted either directly or indirectly such as draining wetlands for agricultural purpose, filling wetlands to provide useable land for building, inputs of storm water, pollutants generated by land development, and dredging to reclaimed land these activities can change the type of wetlands or eventual loss of it [7]. Other threat to wetlands includes pollution from point and non-point source, and frequent use of fertilizers and insecticides from adjourning land [10]. In USA for example over 50% of the wetlands lost due to conversion of wetlands to other land use [17]. To reduce these impacts some countries adopted wetlands protection measure through institutional policy framework that will guaranty undisturbed biotic and abiotic species within wetlands.
Wetlands mapping is very important in order to ascertain whether it is functioning at ecological sustained level or whether it is becoming degraded. Remote sensing and GIS technology are effective methods to monitor and map wetlands. Also, GIS is an indispensable tool that can be used to monitor damages to the valuable resources such as wetlands [18]. [19] Applied remote sensing and GIS software in Canaan Valley West Virginia to map wetlands in the area. The author uses Landsat data of five epoch, and data analysis were conducted using ERDAS IMAGINE and ArcGIS 10.0, The study concluded that 56.17% of the area as wetlands. Similarly, the study conducted by [20] using remote sensing and GIS in Nyando River Kenya shows that only 26% of the mapped area is wetlands and the rest of the land has been impacted by human activities resulting from agricultural activities. [21] Uses NDVI to compare the growth of vegetation in riparian forest of Cienega San Bernardino in the Arizona of US-Mexico border. The observations were made for 27 years during the driest months and the study concluded that green vegetation occurs at location where gabions were used as compared to the control sites. The studies also summarized the importance of gabions in wetlands restoration. [22] Applied remote sensing and GIS to evaluate riparian habitat in Vermillion River basin in east-central Illinois USA. The dataset used are US Geological Survey land use/ land cover data, manually digitized land cover, and Landsat Thematic Mapper. The study concluded that TM and digitized map are suitable for riparian habitat evaluation. The utilization of aerial photographs for timely evaluations of changes in riparian and wetland areas was elaborated [23]. The used of remote sensing and GIS for wetland inventory, wetlands functional assessment for large geographical extent, riparian habitat inventory, and watershed assessment and the application of natural habitat integrity index formula was elaborated [24]. The literature reviews above suggested the benefit of remote sensing and GIS for the sustainable management of wetlands in the world.
However, in Nigeria previous work on wetlands were mainly based on regulations governing the sustainable management of wetlands [25]. The existing policies and legislations documents on wetlands in Nigeria have not yielded any efficient management practice of wetlands due to lack of enforcement [26]. The benefit of wetlands in South-East Nigeria to people dwelling around it was study with 48.2% of the people having perception economic and environmental benefit of wetlands [27]. Also, the ecological and socio-economic effects of wetlands use in Ilesa South-Western Nigeria using Landsat image of 1986 and 2008 together with GPS data and ILWIS 3.4 and ArcView 3.2 was studies, it was concluded that the settlement and agricultural practices are the significant contributors to wetlands degradation [28]. In addition, the studies conducted by [29] in Ile-Ife Osun State, Nigeria using multispectral remote sensing data together with GPS field data and ILWIS 3.2 for geospatial analysis was carried out and the study concluded that anthropogenic factors such as agriculture, residential and commercial land uses as the factors responsible for wetlands degradation in the study area. The review of literature above on wetlands in various parts of the world in general and Nigeria in particular shows that none of these studies has been carried out in Port Harcourt and Obio/Akpor L.G.A. River State Nigeria, especially in the field of remote sensing and GIS software application with regards to monitoring and mapping, inventory, and sustainable management of wetlands in the study area. The objectives of the study include;
· To determine change in wetlands areal extent over the study area.
· To identifies potential causes of wetlands degradation over the study location.
2. METHODOLOGY
2.1. STUDY AREA
The study area covered Obio/Akpor and Port Harcourt L.G.A., Rivers State, South-South Nigeria (Figure 1). It is located within latitude 04º 54’ 35” N - 04º 44’ 05” N and longitude 06º 50’ 05” E - 07º 07’ 30” E in Zone 32N. The elevation of the area varies from 20m towards the coast to 25m off the coastal area. The equatorial location of the study area has influence on the temperature. The average temperature varies between 25°c and 28°c with an annual rainfall between 2000mm in October and 2500mm in April. The vegetation types found in this area include raffia palm, mangrove forest, and light rain forest [30], but at the southern part with abundance of salt water, Nypa palm are found in cluster with mangrove forest. The hydrology of the area is salt water found mostly in the southern part with tributaries from the ocean and fresh water are located in the inter land canals, and streams. The area is made up of three major soil types; fluvisols, nitisols, and ferralsols [31]. Fluvisols are soil type found on alluvial plains, river fans, valleys and tidal marshes on all continents and in all climate zones especially in the equatorial region. These characteristics suggested that the study area in located in the wetlands of the Niger Delta region of Nigeria, therefore, this study is required to determine the extent, location, and distribution of wetlands potential.
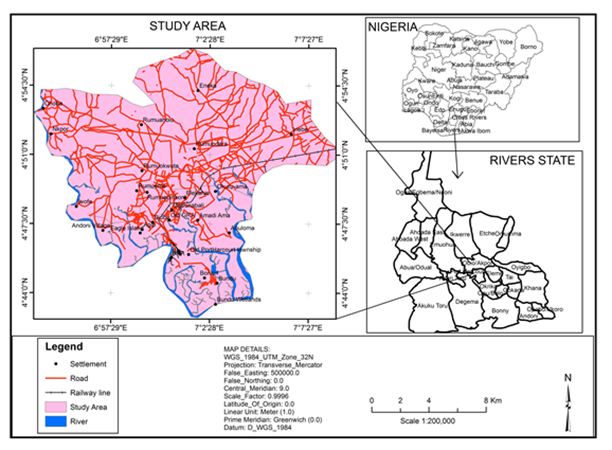
Figure 1: Study Area
2.2. DATASET AND SOFTWARE
The study was carried out using satellite images of year 2000 with spatial resolution 28.8m, 2007 ETM+, and 2013 ETM+ all with path and row 188 and 57 respectively. The imagery date for 2007 image was January 3rd, 2007, while 2013 image was acquired January 3rd, 2013 and both images have spatial resolution of 30m. [32] Uses three Landsat epochs (1991, 2000, and 2009) to monitor change in land use/ cover in Zimbabwe. Band 432 was used from each epoch to performed classification of land use/ cover types. The imageries were downloaded from Landsat satellite image website (http://glovis.usgs.gov/), which was made freely available for research students. The Nigeria L.G. As shape file obtained from the Office of the Surveyor General of the Federation (OSGOF). The general field knowledge of the study area offers great advantage in image classification.
The satellite images were processed using ENVI 5.0 which has greater capacity for raster analysis and processing, while ArcGIS 10.1 was used to performed map compilation and production. [33] Uses ILWIS 3.2 to monitor land use change in Begasheka wetlands of Ethiopia. Finally, PANCROMA was used to remove strip lines from the image.
2.3. DATA PROCESSING
Landsat data required some image processing before they can be used to perform any analysis, especially when they have different spatial resolution. In this study, the Landsat image of year 2000 has 28.5m spatial resolution which was resampled to 30m resolution by using PANCROMA (www.PANCROMA.com). In this way, the three Landsat epochs was represented in the same spatial resolution (30m) which is critical for performing any forms of change detection analysis in all GIS raster software. In addition, the images of 2007 and 2013 contained gaps in them which required filling before it can be used in the analysis. Landsat satellite image developed gaps (missing data) due to failure of the Landsat Scan Line Collector in May 31, 2003 [34], [35], [36]. The Landsat image of year 2000 being the adjust image was used to fill the 2007 and 2013 images being the target image using Pancroma software. [37] Performed is gap filing on 2009 image using Frame_ and _ Fill_Win32 program from NASA. Landsat Gap filling operations replaces missing data created by gaps in the target image (image with gaps) to produce a fill image without gaps.
The study area shape file was created in ArcGIS 10.1 from Nigeria L.G.As. shape file data produced in WGS 84, UTM Zone 32N. The study area shape file was used to clip the Landsat Images of year 2000, 2007, and 2013 from the raster clip of the Arc Toolbox in ArcGIS [38] and then saved in Tiff file format for ease of compatibility in ENVI. The clipping operation limits the images to the study area and also create image of equal rows and columns. The classification of images was done in ENVI 5.0 using Level 1 classification scheme as suggested by [39], [40]. The supervised image classification method was adopted [41]. But [42] used the hybrid classification methods (supervised and unsupervised classification) to monitor vegetation change in Pasvik, Norway and Kola, Russia. The supervised classification of image involves creating a training site for each land use/ cover type. A total of six (6) land use/ land cover types were identified and training sites assigned to them from the region of interest dialog box in ENVI. The land use/ cover include; water bodies, built-up, mangrove/vegetation, sand dune, wetlands, and farmland. The colour assigned to each land use/ cover from classification image followed the standard as recommended by [39].
2.4. CHANGE DETECTION
The change in land use/ cover was performed from the change detection statistics found in the basic tools of ENVI. The change analysis was performed between image 2000 and 2007 and another between image 2000 and 2013 to obtained change in land use/ land cover over these periods.
Table 1: Total area per class in land use/ land cover calculated in hectares
|
Lulc Type |
2000 |
2007 |
2013 |
|||
|
|
Area (Ha.) |
% (Ha.) |
Area (Ha.) |
% (Ha.) |
Area (Ha.) |
% (Ha.) |
|
Water body |
1752.9 |
4.75 |
1608.0 |
4.36 |
1494.2 |
4.05 |
|
Built-up Area |
9329.0 |
25.29 |
13737.0 |
37.23 |
19831.1 |
53.75 |
|
Mangrove/Vegetation |
11370.6 |
30.82 |
6094.3 |
16.52 |
3480.6 |
9.43 |
|
Sand dune |
1399.5 |
3.79 |
35.1 |
0.10 |
465.1 |
1.26 |
|
Wetlands |
9394.0 |
25.46 |
14571.8 |
39.50 |
4407.5 |
11.95 |
|
Farmland |
3648.5 |
9.89 |
849.1 |
2.30 |
7216.7 |
19.56 |
|
Total |
36895.3 |
100 |
36895.3 |
100 |
36895.3 |
100 |
Table 2: Total change in area per class in land use/ land cover between 2007 – 2000 and 2013 – 2000
|
Lulc Type |
2007 - 2000 |
2013 - 2000 |
||||
|
|
Area (Ha.) |
% Total Change |
% Change Per Class |
Area (Ha.) |
% Total Change |
% Change Per Class |
|
Water body |
-144.9 |
-0.39 |
-8.27 |
-258.7 |
-0.70 |
-14.76 |
|
Built-up Area |
4408 |
11.95 |
47.25 |
10502.1 |
28.47 |
112.58 |
|
Mangrove/Vegetation |
-5276.3 |
-14.30 |
-46.40 |
-7890 |
-21.39 |
-69.39 |
|
Sand dune |
-1364.4 |
-3.70 |
-97.49 |
-934.4 |
-2.53 |
-66.77 |
|
Wetlands |
5177.8 |
14.03 |
55.12 |
-4986.5 |
-13.52 |
-53.08 |
|
Farmland |
-2799.4 |
-7.59 |
-76.73 |
3568.2 |
9.67 |
97.80 |
|
Total |
|
0.000 |
|
|
0.000 |
|
Table 1 above represents total area in hectares of land use/ cover per class and the percentage of each class with respect to total area of land use/ cover in the three epochs (2000, 2007, and 2013). Similarly, table 2 represented change in land use/ land cover from 2000 to 2007 and from 2000 to 2013 respectively. In addition, the percentage change in land use/land cover from the initial state to the final state was computed. This is necessary to determined percentage change from initial state to the final state image per class. The percentage change is computed in ENVI 5.0 software as (Final state - Initial state)/ Initial state.
3. RESULTS AND DISCUSSIONS
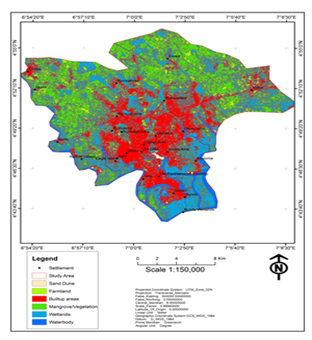
Figure 2: Land use/ land cover map of year 2000
Figure 2 as shown above is the land use/ cover map of the study area image in 2000. The total area per class calculated in hectares and percentages is equally presented in table 1 above. In figure 2 the total area cover by sand dune in the 2000 image was 1399.5ha this represents 3.79% of the total area. Also farm land accounts for total area of 3648.5ha which represents 9.89% of the areal extent. Similarly, built-up areas covered a total area of 9329.0ha this translated to 25.29% of the area. And finally, mangrove/ vegetation covered total area of 11370.6ha this represents 30.82% of the land cover, wetlands occupied 9394.0ha represented 25.46% of the total area and water body covered a total area of 1752.9ha represented 4.75% of the total area.
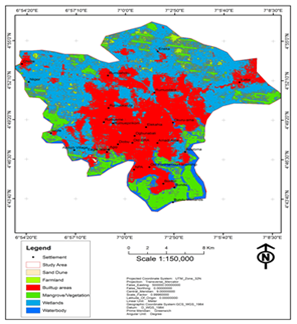
Figure 3: Land use/ land cover map of year 2007
The classification results of the 2007 satellite image calculated in hectares and tabulated in table 1 was shown in figure 3 above. In this image sand dune represented by Sahara sand colour accounted for total area of 35.1ha representing 0.10% of the total area. Farm land covers an area of 849.1ha which represents 2.30% of the total land cover. Built-up land use occupied total area of 13737.0ha represented 37.23% total cover extent. Mangrove/ vegetation as shown in the map with Quetzel green colour covered an area of 6094.3ha this translated to 16.52% of the total land use/ cover area. Wetlands shown on the map with Moorea blue colour is 14571.8ha this represents 39.50% of the study area extent. Finally, water body covers an area of 1608.0ha represented 4.30% of the area.
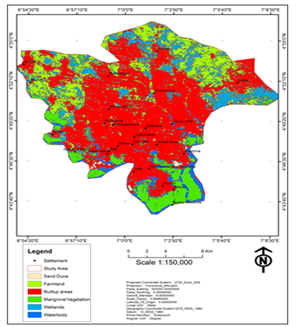
Figure 4: Land use/ land cover map of year 2013
The land use/ land cover classification image of the year 2013 was shown in figure 4 above and the total area per class in hectares was also tabulated in table 1. The area of land use occupied by sand dune was 465.1ha this translated to 1.26% of the total area. Farm land total area covered 7216.7ha representing 19.56% of the land use/ cover. The area of built-up was 19831.1ha representing 53.75% of the total area. Mangrove/ vegetation land cover accounts for total area 3480.6ha which is 9.43% of the total image areal extent. Similarly, wetlands covered an area of 4407.5ha representing 11.95% of the land area. Finally, water body accounts for an area of 1494.2ha representing 4.05% of the image area. In all the years the percentages are sum to 100 as shown in the table above.
The percentage increase or decrease from initial to the final year was also computed and the results are shown in table 2. In 2000 image the area covered by sand dune was 1399.5ha and in 2007 image it was 35.10ha representing a net decrease of -1364.4ha. Similarly, in 2013 image the area covered by sand dune was 465.1ha representing -934.4ha loss of sand from 2000 to 2013. The change between these epochs suggested that in 2000 image more dredging work was carried out in other to reclaimed land from the existing wetlands, but by 2007 the dredged areas were converted to built-up resulting in lower area in 2007 and in 2013 more sand has been dredge again along the shoreline to reclaimed land for development which resulted to increase in area of sand dune. The percentage decrease of sand dune from 2000 to 2007 was -3.70% and from 2000 to 2013 was -2.53% respectively. For the built-up areas the percentage increase from 2000 to 2007 image was 11.95% and from 2000 to 2013 image was 28.47%. This suggested that there is progressive urban development in built-up areas with some being built on wetlands and on reclaimed shoreline resulting in reduction of water body and wetlands [43]. It was observed by [44] that such transformation of wetlands to built-up areas was responsible for temperature flux in Kolkata, India. Similarly, the percentage decrease in water body from 2000 to 2007 image was -0.39% and from 2000 to 2013 was -0.70% suggesting a steady loss of water body due to increase of built-up activities and shoreline reclamation for residential and industrial purposes. The percentage increase or decrease of wetlands in the study area from 2000 to 2007 image was computed as 14.03% and from 2000 to 2013 was -13.52%. The percentage increase in wetlands obtained from 2000 to 2007 was as a result of miss classification of some vegetation as wetlands, however, the decrease of wetlands in 2013 was a reflection of real situation in the area in which wetlands decrease by -13.52% over these periods. The decrease or loss of wetlands was as a result of rapid urbanization, industrial, and commercial development [29] of the area with most multinational companies situated along water body and these companies embarked on reclamation of wetlands for industrial development. In addition, some private residence located around wetlands reclaimed land by gradually dumping of domestic waste in wetlands adjourning their homes over long period for development- a situation found in the entire water fronts in the study area. Some of the wetlands have been converted to dumpsites due to disposal of solids and liquids waste leading to loss and degradation of wetlands for their intended use- a situation found in Ogbunabali wetlands.
4. CONCLUSION
The application of remote sensing and geographic information system in the management, monitoring, mapping, and inventory of wetlands is gaining recognition in the world. Most wetlands in the world today are under threat due to over utilization of its resources either directly or indirectly. The threats to wetlands habitat can be artificial or natural causes and these includes; urbanization, agricultural practice, industrial activities, dredging, mining, storm and flood occurrences, sea level rise etc. Remote sensing and GIS software provide useful method for analysing impact of land use on wetlands. The impact of land use/ cover on wetlands in the study area was investigated using Landsat satellite images of three epochs (2000, 2007, and 2013) and ENVI 5.0 software to classified land use/ cover type. The loss of wetlands was due to changes in land use over these periods especially the urbanization of the area. The change detection results indicated that built-up area has increase by 11.95% from 2000 to 2007 and 28.47% from 2000 to 2013. The results also show reduction of water body by -0.39% in 2000 to 2007 and -0.70% in 2000 to 2013. The increase in built-up and dredging activities is the direct cause of wetland loss in the area. Hence, management of wetlands habitat is important as they provide the following functions; fishes, woods, hydroelectricity, roads, bridges, agricultural activities, industrial use, recreational purpose, etc.
For further study of wetlands in the area, inventory of available wetlands should be development which will be used to determine whether particular wetlands is functioning at ecologically sustained level or not. Also, wetlands regulations should be implemented by all stakeholders in other to mitigate over utilization of wetlands resources which resulted in degradation of all wetlands habitat.
SOURCES OF FUNDING
None.
CONFLICT OF INTEREST
None.
ACKNOWLEDGMENT
None.
REFERENCES
[12] Ohio EPA (2013). Ohio Wetlands, Fact Sheet, Division of Surface Water, pp. 1.
[16] US Army Corps of Engineers (1998). Recognizing Wetlands, pp. 4.
[35] Pat S., Esad M., Gyanesh C. (2004). SLC Gap-Filling Products Phase One Methodology, pp. 1-5.
|
|
 This work is licensed under a: Creative Commons Attribution 4.0 International License
© Granthaalayah 2014-2020. All Rights Reserved.