
|
|
|
|
CLIMATE CHANGE IMPACTS ON PROJECTED PV POWER POTENTIAL UNDER RCP 8.5 SCENARIO IN BURUNDIMarc Niyongendako *1
|
|
|
|


Article Type: Research Article
Article Citation: Marc Niyongendako, Agnidé Emmanuel Lawin,
Célestin Manirakiza, Serge Dimitri Yikwé Buri Bazyomo, and Batablinlè Lamboni.
(2020). CLIMATE CHANGE IMPACTS ON PROJECTED PV POWER POTENTIAL UNDER RCP 8.5
SCENARIO IN BURUNDI. International Journal of Research -GRANTHAALAYAH, 8(5),
1-14. https://doi.org/10.29121/granthaalayah.v8.i5.2020.37
Received Date: 03 May 2020
Accepted Date: 19 May 2020
Keywords:
Burundi
PV Power Potential
Climate Change Impacts
Solar Irradiance
Temperature
ABSTRACT
This work focuses on analysis of climate change effects on Photovoltaic (PV) power output in the Eastern and Northeastern of Burundi. Monthly temperature data from meteorological stations and solar irradiance data provided by SoDa database were considered as observed dataset for the historical period 1981-2010. Projection climate data from eight Regional Climate Models of CORDEX for Africa were used over the near future period 2021-2050. The change in temperature and solar irradiance were analyzed and the effects of these climate changes were assessed to show their impacts on PV power potential. The results indicated increasing trends and change in temperature for about 2°C over this near future period. The solar irradiance change was revealed negative with a high interannual variation for all regions and the mean decrease ranges between 2 and 4 W/m². The findings revealed also a negative change in PV power potential close to zero for all regions with a high change occurred in NLL. Indeed, the contribution of each parameter to PV power potential change was negative all over regions. However, the projected climate change does not predict a huge PV power potential change by 2050. Therefore, Burundi may invest in producing electricity energy from PV systems.
1. INTRODUCTION
It is evident that industrial revolution has made several increasing changes in the atmospheric components concentration. The anthropogenic emission of greenhouse gases (GHG) and aerosols has impacted weather and climate conditions. Then climate change and variability have been observed since the 19th century and the average temperature trends on a global scale showed an increasing warming trend [1]. Therefore, various extreme climatic events are frequently seemed to occur worldwide since these last five decades as results of climate change [2]. One of the main contributing sectors to GHG emissions is the energy sector, due to its high dependency on fossil fuels [3]. Renewable energy systems, notably solar energy, can be an effective climate change mitigation alternative [3]. However, most renewable resources are dependent on weather and climate, a dependency that could affect the feasibility of future low-carbon energy supply systems [4]. Among renewable resources, solar resource is considered as an unlimited potential of energy and available at human scale. Photovoltaic (PV) power generation is one of solar energy systems which transform directly solar light into electricity using solar cells. Photovoltaic (PV) electricity generation depends on solar irradiance, named surface downwelling shortwave radiation (RSDS), and other climatic variables affecting panel efficiency, like surface air temperature (Tas) and surface wind velocity [4]. Therefore, climate change may affect PV power generation for a given PV systems.
This study
aims to evaluate the impacts of climate change on projected photovoltaic power
potential in Burundi. We assess how the change in climate parameters will
affect the yield of electricity generation. The motivation to use
renewable resources of energy generation comes from the purpose to mitigate
climate change however climate change directly affects renewable energy
resources. The performance of PV systems is largely influenced by internal and
external factors such as the structural features, visual loss, radiation,
shading, temperature, wind, pollution, and electrical losses [5]. Climate change
will impact temperature and irradiance and therefore will alter the output
capacity of PV systems [5]. PV systems
present a negative linear relationship between the energy output and the
temperature change, while the increase of solar radiation is proportional to
the PV energy output [6], [7]. PV systems have
been developed and now many of
solar photovoltaic technologies are performed and reviewed to improve
the performance of solar PV power systems and to adapt to future trends and
climate change toward the world [8], [9].
Many studies have been carried out to characterize the impacts of climate change on solar energy over global or regional scale in the world. Crook et al. [10] investigated the climate change impacts on future photovoltaic and concentrated solar power (CSP) energy output. These authors indicated that PV power output from 2010 to 2080 is likely to increase by a few percent in Europe and China, see little change in Algeria and Australia, and decrease by a few percent in western USA and Saudi Arabia. The impact of climate change on photovoltaic power generation in Europe is also studied by Jerez et al. [4]. Their results indicated that the alteration of solar PV supply by the end of this century compared with the estimations made under current climate conditions should be in the range of -14% to +2%, with the largest decreases in northern countries. Impacts of future climatic changes on the photovoltaic (PV) energy have been investigated for West African countries. The results show negative trends of solar irradiation for almost all countries of the region except for Cape Verde. Furthermore, temperature trends are positive with a maximum of 0.08 K/year predicted by MIROC for Niger and minimum of 0.03K/year predicted for Cape Verde [6]. Seasonal trends in solar radiation available at the earth's surface and implication of future annual power outputs changes on the photovoltaic systems with one and two tracking axes were also studied in the same region [11] Projections of long-term changes in solar radiation based on CMIP5 climate models and their influence on energy yields of photovoltaic systems is assessed globally and for selected key regions with major solar power production capacity [7]. The impact of solar radiation and temperature changes on energy yields of PV systems under the RPC8.5 scenario indicates statistically significant decreases in PV outputs in large parts of the world, but notable exceptions with positive trends in large parts of Europe and the South-East of China [7]. The impact of climate change on wind and solar resources in southern Africa is studied by estimating the risk of climate-change on wind and solar resource potential [12]. The findings show a median change close to zero by 2050 in the long-term mean of both wind speed and Global Horizontal Irradiance (GHI), both used as indicators of changes in electricity production potential. Although the extreme possibilities range from about -15% to +15% changes, these are associated with low probability. Another study conducted in East Africa aimed to provide a concise understanding of key trends, patterns and impacts of climate change in East Africa. It also presented the expected and current impacts of climate change on the energy sector of East Africa [13].
At a country or local scale, climate change impacts on solar
energy particularly on photovoltaic power
potential have attracted more attention for many researchers [14] The UK solar energy
resource and the impact of climate change were investigated across different
regions of the UK by using the UKCP09 probabilistic climate change projections [15].
It was found that the current average UK annual solar resource is 101.2 W/m²,
ranging from 128.4 W/m² in the south of England to 71.8 W/m² in the northwest
of Scot land. The effect of projected changes in irradiance and temperature on
the performance of photovoltaic systems in Greece was also examined [16].
The spatiotemporal analysis indicates significant increase in mean annual
temperature (up to 3.5°C)
and mean total radiation (up to 5W/m²)
by 2100. The performance of photovoltaic systems exhibits a negative linear
dependence on the projected temperature increase which is outweighed by the
expected increase of total radiation resulting in an up to 4% increase in
energy output.
In Burundi, climate changes impact on renewable resources
have been investigated and more attention has been concentrated on hydropower
and wind power. A spatio-temporal
analysis of climate change impact on future wind power potential in Burundi [17]studied
diurnal and monthly wind speed and revealed an increase in projected wind power
density in the west lowland of Burundi. Another study on wind power potential
in near future climate scenarios: the case for Burundi (East Africa) [18] revealed an increase in wind power
potential all over the study area with higher values during summer time. On the other hand, a decrease in hydropower
potential has been projected in the same area for near future [19].
Concerning solar energy, a study conducted by Lawin et al. [20] described
the projected trend and variability of main climate variables in Burundi (solar
irradiance and temperature) that contribute to the generation of solar energy.
Then a need of
understanding the projected change of these parameters and the behavior of the
PV powers systems in generation of solar electricity is prominent and could
help to make a good decision on planned PV power generation in Burundi.
Actually, Burundi is a country which experiences a chronic shortage and
deficit of electrical energy. Indeed, energy resources which are mainly of
hydroelectric origins, are not enough to deal with increased demand for energy [20].
Furthermore, there is no important power plant for energy generation built in
eastern region which can produce sufficient electricity regarding the need of
local population.
In this goal, we conduct a research in Eastern of Burundi to highlight changes of temperature and solar radiation in order to analyze the eventual impact of the climate changes on solar PV power potential. The specific objectives of our research are: to analyze changes of solar irradiance and surface air temperature, to evaluate their impact on PV power generation and to highlight the contribution of each parameter on the PV power potential change. The study is especially conducted in eastern lowlands, northern lowlands and eastern arid plateaus of Burundi. Specifically, the study analyzes the pattern of these two parameters in the historical period 1981-2010 and the projected near future period 2021-2050, detects their changes and evaluates the effects of climate changes on PV power generation.
2. MATERIALS AND METHODS
2.1. STUDY AREA
Figure1 presents the study area including eastern and northeastern parts of Burundi. Burundi is a small East Africa country located between longitudes 28.8°–30.9° East and latitudes 2.3°–4.45° South [21]. Bounded to the North by the Republic of Rwanda, to the West by the Democratic Republic of Congo, and to the East and South by the Republic of Tanzania, Burundi covers an area of 27,834 km2 which belongs to two major watersheds: The Nile basin with an area of 13,800 km2 and Congo River basin with 14,034km2 of area. The climate in Burundi, as an East African country, is mainly influenced by the North-South movement of the Intertropical Convergence Zone (ITCZ), the topography of the country and El-Nino Southern oscillation (ENSO) [22]. Then the annual mean of climate variables such as precipitation, temperature and wind speeds, depends mainly to the climate zone location [22]. The interest study area covers the East and Northeast of Burundi and is divided into three sub-regions considering their landforms: The Eastern lowlands of Kumoso (ELL), the Eastern arid plateaus (EAP) and the Northern lowlands of Bugesera (NLL) [20]. The ELL is a region located to the extension of the border with Republic of Tanzania whereas NLL is covering two provinces (Kirundo, Muyinga) located in the Northeast of the country [20] The main different between the three regions is elevation as shown in Figure 1. This elevation defines the climate of each region and then temperature is high in lowlands regions. The annual mean temperature varies from 19 °C for EAP to 22 °C for ELL and NLL, and their altitudes also vary from 1,400–2,000 meters for EAP to 1,100–1,400 meters for ELL and NLL [23]. The mean yearly solar irradiance for these regions is closely the same and varies from 232 W/m2 for EAP to 248 W/m2 observed in NLL.
2.2. DATA USED
Data of two climate parameters are considered in this study: solar irradiance and surface air temperature as observed and projected data. The observed data used are grouped into two sets of data. The first set of data is a collection of observed data from the synoptic stations of the Geography Institute of Burundi (IGEBU). Monthly and annual mean temperature data for seven stations located in the study area are used over the historical period (1981–2010). These climate stations are presented in Figure1 and their geographic information and collected time duration are given in Table 1.
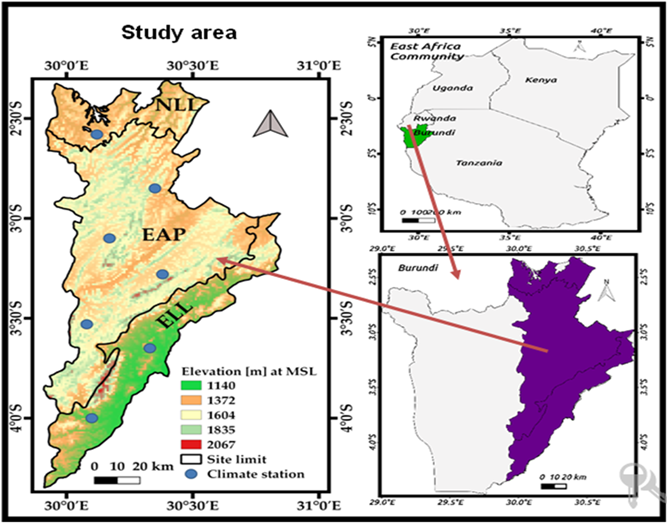
Figure 1: Study area location
Due to the lack of solar irradiance data measured in the stations of our study area, the second set of observed data is provided by the SoDa database available at http://www.soda-is.com [24]. Furthermore, due to the lack of long-term solar irradiance measurement, data from 1985–2005 are used as an observational solar irradiance dataset with spatial resolution of 20 km. The SoDa server provides hourly, daily, monthly and annually irradiation over Europe, Africa, and Atlantic Ocean which is accessible on free basis [16].
Table 1: Geographic characteristics of meteorological stations used.
|
Name |
B.W* |
Region |
Latitude
South |
Longitude
East |
Period |
|
KIRUNDO |
Nile |
NLL |
2.58 |
30.12 |
1980-2010 |
|
MUYINGA |
Nile |
EAP |
2.85 |
30.35 |
1980-2010 |
|
CANKUZO |
Nile |
EAP |
3.28 |
30.38 |
1980-2010 |
|
KARUZI |
Nile |
EAP |
3.10 |
30.17 |
1986-2010 |
|
MURIZA |
Nile |
EAP |
3.53 |
30.08 |
1980-2010 |
|
KINYINYA |
Congo |
ELL |
3.65 |
30.33 |
1980-2010 |
|
MUSASA |
Congo |
ELL |
4.00 |
30.10 |
1980-2010 |
B.W*:
Basin watershed.
The SoDa irradiance is satellite-derived data of HelioClim-1 Daily solar irradiance v4.0. HelioClim-1 databases use the Heliosat-2 method to process the Meteosat images. The Heliosat-2 method converts images acquired by meteorological geostationary satellites such as Meteosat (Europe), GOES (USA) or GMS (Japan), into data and maps of solar radiation received at ground level [16]. Table 2 provides the statistical characterizations of data collected for temperature and solar irradiance at annual scale and their regions.
Table 2: Data collected over the period1981–2010 for temperature and over the period 1985–2005 for solar irradiance at the annual scale.
|
Variable |
Region |
Mean |
Maximum |
Minimum |
Stdev* |
|
Tas* |
NLL |
20.52 |
21.77 |
19.52 |
0.62 |
|
|
EAP |
19.45 |
20.16 |
18.66 |
0.31 |
|
|
ELL |
21.74 |
22.37 |
21.03 |
0.60 |
|
Rsds* |
NLL |
248.56 |
260.75 |
239.17 |
5.34 |
|
|
EAP |
236.07 |
248.13 |
225.04 |
5.30 |
|
|
ELL |
232.19 |
241.71 |
221.58 |
5.09 |
Tas*:
annual mean temperature in (°C)
Rsds*: monthly
means surface solar Irradiance in (W/m2),
Stdev*:
standard deviation.
Climate projections data used are daily surface air temperature and solar irradiance taken from eight regional climate models available in the context of Coordinated Regional Climate Downscaling Experiment (CORDEX) over Africa at 0.44° resolution for the period 1950–2100 [25] and accessed online https://www.cordex.org. Table 3 presents used climatic models, home institute, and model short name adopted in this paper. Climatic models are complex programs based on atmospheric circulation including its chemistry and radiation, oceanic circulation including its biochemistry, land-surface, river routing and sea ice modeling [6]. The differences between them are mainly related to the physical parameterization of each component of the model structure. IPCC has established four Representative Concentration Pathway (RCP) scenarios which are linked to the concentration of greenhouse gas emission during the 21st century. According to the socio-economic technological and policy development activities that disturb the concentration of carbon dioxide in the atmosphere, there are RCP2.6, RCP4.5, RCP6.0 and RCP8.5 where the associated number corresponds to the radiative forcing reached at the end of 21st century [26].
Table 3: The used climatic models.
|
Global Climate Model Name |
Institute ID |
Model Short Name |
|
CanESM2 |
CCCma |
CCCma |
|
NRM-CM5 |
CNRM-CERFACS |
CNRM |
|
EC-EARTH |
ICHEC |
ICHEC |
|
IPSL-CM5A-MR |
IPSL |
IPSL |
|
MIROC5 |
MIROC |
MIROC |
|
MPI-ESM-LR |
MPI-M |
MPI |
|
NorESM1-M |
NCC |
NCC |
|
GFDL-ESM2M |
NOAA-GFDL |
NOAA |
In this study, experiments performed following RCP 8.5, which is the highest forcing radiative scenario, are considered for future period in CORDEX database. The period 2021–2050 is considered for near future with the reference 1981-2010 as historical period for these two parameters. The RCP 8.5 is based on the A2r scenario which combines assumptions about high population and relatively low income growth with modest rates of technological change and energy intensity improvements, leading in the long term to high energy demand and greenhouse gas emissions in the absence of climate change policies [27]. This set of data is the up-to-date ensemble of high-resolution Regional Climate Model (RCM) projections, and models data have been bias corrected using historical observed data. Monthly and annually mean data used in this study have been performed from climate models daily data using CDO software.
2.3. METHODS
2.3.1. BIAS CORRECTION
RCM temperature and solar irradiance outputs were corrected for their biases in mean and standard deviation for each calendar month, following the methodology presented in Haerter et al. [28] and used by Panagea et al. [16] The bias in mean is corrected by subtracting the differences found between observed and modeled values and a correction to the model data is performed to conform to the variability of the historical data. This procedure takes the sequence of anomalies and scales them consistently with the observed historical variability. In the case where data follow normal distribution the transfer function is linear and is of the form shown in the following equation:
![]() (1)
(1)
Where ![]() is
the final adjusted time series,
is
the final adjusted time series, ![]() is
the raw model predictions for the scenario period,
is
the raw model predictions for the scenario period, ![]() and
and ![]() are
the mean of observed and modeled data for the control period, respectively, and
are
the mean of observed and modeled data for the control period, respectively, and
![]() and
and ![]() are
the standard deviations of observed and modeled data for the control period,
respectively. The final adjusted model time series exhibits the appropriate
baseline mean and standard deviation with respect to the observed data [20].
are
the standard deviations of observed and modeled data for the control period,
respectively. The final adjusted model time series exhibits the appropriate
baseline mean and standard deviation with respect to the observed data [20].
2.3.2. EFFECTS OF CLIMATE CHANGES ON PV POWER POTENTIAL ASSESSMENT
Solar
radiation and the ambient air temperature are the main inputs of PV energy
production. We calculated the impact of climate change using these two
variables of long-term changes on the output PV power energy. To achieve this
purpose, the methodology used by Crook et al. [10] and repeated by Panagea et al. [16] and Wild et al. [7] was followed. This method defines the efficiency of PV, ![]() , which depends on the temperature by:
, which depends on the temperature by:
![]() (2)
(2)
Where ![]() and
and ![]() are the reference efficiency and the reference
temperature respectively in which the performance of PV module is estimated by
the manufacturer and
are the reference efficiency and the reference
temperature respectively in which the performance of PV module is estimated by
the manufacturer and ![]() is
solar irradiance on the horizontal plane. The coefficients
is
solar irradiance on the horizontal plane. The coefficients ![]() and
and
![]() depend
on the cell material and structure. According to Parida et al. [29]and
Skoplaki et al. [30]
mono-crystalline silicon cells are the most produced and for this type of cell
depend
on the cell material and structure. According to Parida et al. [29]and
Skoplaki et al. [30]
mono-crystalline silicon cells are the most produced and for this type of cell ![]() =0.0045 and
=0.0045 and![]() .
Still based on these two studies,
.
Still based on these two studies,![]() ,
the temperature of modules is given by:
,
the temperature of modules is given by:
![]() (3)
(3)
Where T is the air ambient temperature in °C, C1, C2 and C3 depend on the material
properties, and, in the chosen case in this paper (mono-crystalline silicon
cells), their values are C1= -3.75°C, C2= 1.14 and ![]() .The
output power of PV system is assumed to be:
.The
output power of PV system is assumed to be:
![]() (4)
(4)
Consider the following PV power potential output change presented in equation 5:
 (5)
(5)
In order
to estimate the percentage of change in PV power potential output, the fractional change ![]() is calculated from
the ratio between (5) and (4) according to Crook et al. [10].
The first advantage of this fractional change is to
eliminate
is calculated from
the ratio between (5) and (4) according to Crook et al. [10].
The first advantage of this fractional change is to
eliminate ![]() in equation (5) and the second one allowed comparing the
future output energy to the reference period.
in equation (5) and the second one allowed comparing the
future output energy to the reference period.
We can normally attribute changes
in PV power output to changes in Temperature ![]() and
Global solar irradiance
and
Global solar irradiance ![]() for PV. Then to calculate the relative
contributions from change in temperature
for PV. Then to calculate the relative
contributions from change in temperature ![]() and change in solar irradiance
and change in solar irradiance ![]() ,
PV power output change was calculated with respectively either G or T held
constant at their baseline period (1980–2010) mean so either
,
PV power output change was calculated with respectively either G or T held
constant at their baseline period (1980–2010) mean so either ![]() or
or ![]() .
.
3. RESULTS AND DISCUSSIONS
3.1. CHANGES IN PROJECTED SOLAR RADIATION AND AIR TEMPERATURE
The change in PV energy output was estimated for the projection period 2021–2050 according to the reference period 1981-2010 defined as control period for both temperature and solar irradiance.
The maps
presented in Figure 2 display a spatial
distribution of ensemble models mean of surface air temperature after bias
correction for the reference period 1981-2010, projected period 2021-2050 and
the linear trends of the annual mean change of surface air temperature.
The analysis of this figure shows positive changes in surface air temperature varying from 0.6°C to 2.5 °C. The highest change occurs in ELL whereas the lowest change value is observed in EAP region. It is also observed that ELL region is hotter for both periods with annual mean which can reach 23.5 °C in 2050. The findings reveal also a distinct warming in lowland region ELL and NLL of around 2°C and very lowest warm is observed in EAP region with about 0.6°C. In general, all climate models predict a positive trend in surface air temperature. These results are in agreement with many previous works which project increasing trend in surface air temperature in regional [6] or global scale as well as in local scale [16].
The same computation has been applied to solar irradiance. Figure 3 presents the spatial distribution of annual mean of ensemble models of surface downward solar radiation under all-sky conditions (RSDS) (W/m2/year) after bias correction for the reference period 1981-2010, for projected period 2021-2050 and the linear trends of annual mean change of solar irradiance. It is observed that solar irradiance mean change is negative for all regions and the mean decrease ranges between 2 and 4 W/m².The highest decrease change value is observed in NLL whereas the lowest decreasing change value is observed in ELL region. The highest annual mean value of solar irradiance occurs in NLL region for both reference and projected periods whereas the lowest annual mean value is observed in ELL region. In general, ensemble models mean projects a negative change of solar irradiance for all regions. The decrease in projected solar irradiance and the increase in surface air temperature may affect the PV power potential because PV energy output is largely depending on these two parameters. However, as located in subtropical zone, Burundi experiences the relatively highest solar radiation with moderate temperature. Then Burundi may invest in the exploitation of this potential solar resource.
|
|
|
|
|
(A) Reference Period |
(B) Projected Period |
(C)Temperature Change |
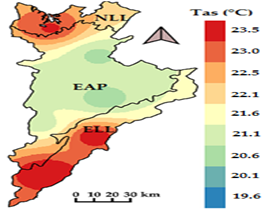
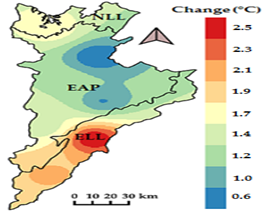
Figure 2: annual mean temperature for
reference period(A), projected period(B) and their annual mean change(C).
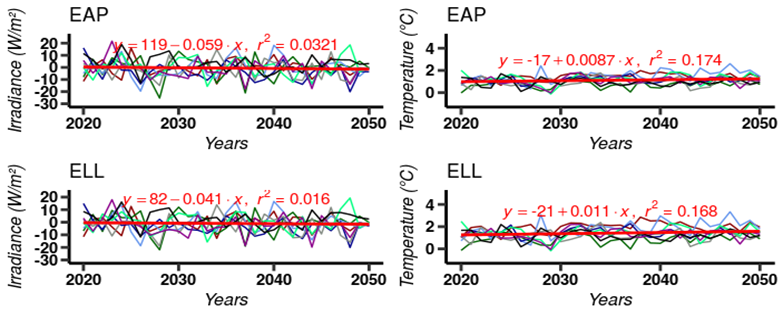
Time series of linear trend changes in solar radiation and
surface air temperature are presented in Figure 4 for all models in all regions
of study area. Each model realization is represented as a line with specific
color different from others, while the red line in each plot represents the
median of the linear trends of the eight models over the period 2021-2050. This
figure shows that mean trends changes in all regions are negative close to zero
for solar irradiance whereas mean trends change of surface air temperature are
positive in all regions. The median of linear trend changes of surface air
temperature for all eight models is close to 1.5°C for all site of study area.
The interannual variation change is very significant for solar radiation where
changes vary from -30 to 20 W/m². For surface air temperature the interannual
variation change is ranged between 0 and 3°C for all models in all regions. The
analysis of the figure shows also that there is an increasing trend in
temperature and linear decreasing trends of solar radiation. This implies that
the projected warming climate and the decrease in solar radiation over the
region may affect negatively the PV power potential.
|
|
|
|
|
(A) Reference Period |
(B) Projected Period |
(C)Solar irradiance Change |
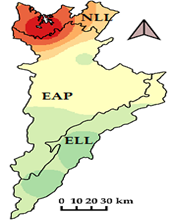
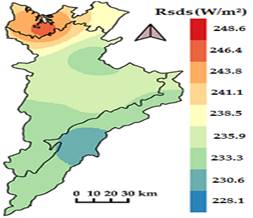
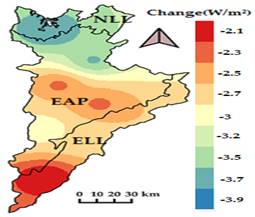
Figure 3: annual mean solar irradiance
for reference period (A), projected period (B) and their annual mean change(C).
In summary, this section presents
linear trends of annual mean changes in solar radiation and temperature over
all regions of the study area and considering all models used. The results show
that solar radiation presents a decreasing trend and a negative change; while
for surface air temperature, all models predict an increasing trend with
a positive change over all regions studied. These trends revealed no positive
effect of climate change expected on PV power output because the response of PV
is directly proportional to the increase of solar radiation and inversely
proportional to the increase of air temperature [6].
Ours findings are in agreement with the results of Panagea
et al. [16]
for temperature which indicated significant increase in mean annual (up to
3.5°C) while there are discrepancy for total radiation where they found
increasing in annual mean (up to 5W/m²)
by 2100. Similar results were also found by Burnett et al. [15]
which revealed that climate change will increase the average solar resource in
the south of the UK, while marginally decreasing it in the Northwest.
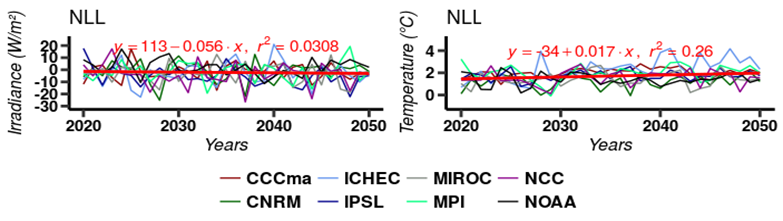
(A) Solar irradiance
(W/m²) (B)
Surface air Temperature (°C)
Figure 4: Time series of linear trends of solar irradiance (A) and surface air temperature (B) for all models used over all regions
3.2. IMPACT OF CLIMATE CHANGE ON PV POWER POTENTIAL
All
models means and ensemble models mean percentage change of PV power potential
2021–2050 versus 1981–2010 period under the RCP8.5 scenario have been presented
in Figure 5. The results
show that all models and the ensemble models mean projected changes for PV
potential present negative values in the entire domain under RCP8.5, except for
NOAA which predicts positive values in all regions.
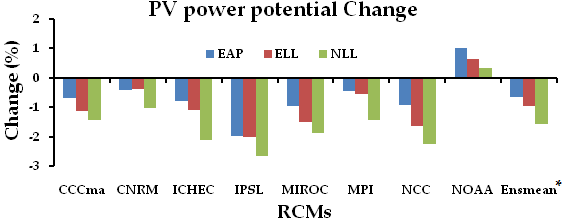
Figure 5: Models means and ensemble models
mean percent of PV power potential change.
Ensmean*: Ensemble models mean
The ensemble mean predicts a high PV power potential change
of -1.56% in NLL whereas the lowest change of -0.65% is observed in EAP. The PV
potential changes range from -3 % to + 1% for all models and NLL appears as
where the negative change is very high in opposite with EAP where the change is
small compared with other regions for all models. The IPSL model shows the
highest negative change for all regions.
Figure 6 shows trends of percentile changes in the PV power output between 2021 and 2050 according to the reference period (1981–2010) for all regions. This figure presents the box plots of annual mean percentage change of PV power output for each model over EAP region (A), ELL region (B) and NLL region(C). To quantify the spread of models projection changes, trends of all models are presented in terms of boxes in Figure 6 for different regions studied. The lower and upper end line of the boxes represents the 25% and the 75% quartile, respectively. The range between both quartiles is defined as “inter quartile range”. The middle black line of the boxes presents the median which divides the diagram into two halves, each including 50% of the data. This representation is therefore not less prone to outliers, which are presented as empty balls in the graph.
As one can observe, trend of projected change of PV power potential is decreasing. These eight boxes represent the average annual mean changes of PV power potential from 2021–2050 for each model over the three regions considered. This figure shows that the CNRM and NOAA models predict the largest positive changes while IPSL model predicts the lowest negative changes for all regions. This representation shows also that the inter quartile range (50% of data set) for all models cover the interval range from –3% to 2% change of PV power potential where the median line pass close to zero. The extremes part for each model extends the range of the PV power potential change to -10% and +7%.
|
A)
|
|
B)
|
|
C)
|
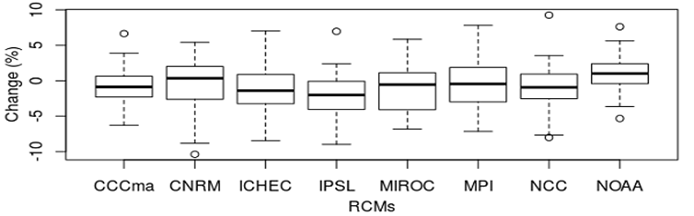

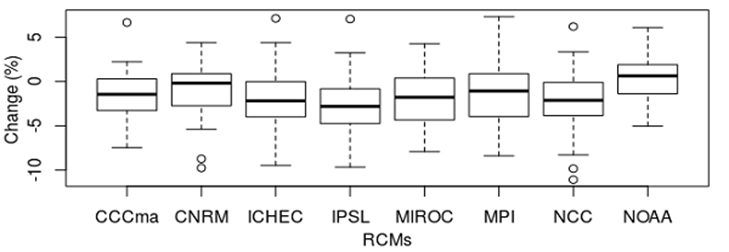
Figure 5: Box plots PV
potentials change for EAP (A), for ELL (B) and for NLL (C) using all models.
The summary of this section points out that the change in PV power potential estimated by eight models of CORDEX for Africa is ranged from -5% to 5% and the ensemble models mean projects a slight decrease of PV power potential for about -1.5% for NLL, -0.9 % for EAP and -0.6 % for ELL. The similar findings in southern Africa have shown a median change close to zero by 2050 in the long-term mean of Global Horizontal Irradiance (GHI) [12]. On the other hand, this decrease of PV power output found in our study seems likely small compared to the results of Jerez et al. [4] in Europe where the alteration of solar PV supply by the end of this century should be in the range from -14% to + 2%, with the largest decreases in Northern countries. Furthermore, the findings of Wild et al. [7] estimated that the impact of solar radiation and temperature changes on energy yields of PV systems under the RPC 8.5 scenario indicates statistically significant decreases in PV outputs in large parts of the world.
3.3. CONTRIBUTION OF TEMPERATURE AND SOLAR RADIATION IN THE PV POWER OUTPUT CHANGE
The relative contributions Δ𝑇 and Δ𝐺 are assessed by setting the projected change in irradiance and temperature, respectively, equal to zero in the calculations for the potential percentage change in the PV energy output in equation (5) following the methodology presented in Crook et al. [10].
In Figure 7, the model annual mean of PV output change is
estimated for projected period, by setting the irradiance change equal to zero
(left panel, ΔG=0)
and by setting the temperature change equal to zero (right panel, ΔT=0).
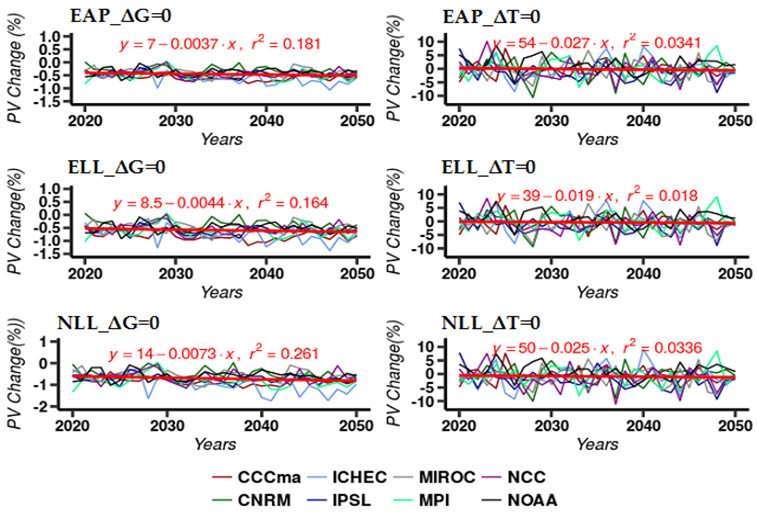
Figure 7: Time series of PV power
potential changes for EAP, for ELL and for NLL using all models caused only by change in temperature (left
panel) or solar radiation (right panel)
Figure 7 presents also the PV percentage change for EAP, for ELL and for NLL. The change in temperature results in a slight decrease of PV energy output up to 1% with a very low interannual variation between -1% and 0.5%. The red line which represents the ensemble models mean shows a decreasing trend with a slight slope. The solar irradiance does not present homogenous pattern for all models but the PV power potential changes caused only by solar radiation range from -10 to 10%. The ensemble models mean represented by the red line pass close to zero and presents a decreasing trend. The contribution of each parameter varies from one region to another which is in accordance with the results of Crook et al. [10]. The change in temperature and irradiance are negative which prove the no compensation resulting in their changes. Contrariwise, the study conducted in Greece [16] has concluded that increase in temperature is outweighed by the expected increase of total radiation resulting in an up to 4% increase in energy output.
The PV output change caused by only temperature does not present large variation because the temperature change itself does not make huge variation (about 2°C). However, for solar radiation, the vast range of change (±30W/m²) explains the large interannual variation of PV output change caused by solar irradiance.
The table 4 summarizes the contribution of solar irradiance and surface air temperature on PV power potential.
Table 4:
Contribution of climate change to PV power potential changes (%).
|
Temperature
contribution, ΔG=0 |
Solar irradiance
contribution, ΔT=0 |
|||||
|
Models |
EAP |
ELL |
NLL |
EAP |
ELL |
NLL |
|
CCCma |
-0.58 |
-0.81 |
-0.83 |
-0.11 |
-0.30 |
-0.60 |
|
CNRM |
-0.31 |
-0.38 |
-0.50 |
-0.11 |
-0.01 |
-0.52 |
|
ICHEC |
-0.60 |
-0.74 |
-0.96 |
-0.21 |
-0.36 |
-1.20 |
|
IPSL |
-0.50 |
-0.60 |
-0.70 |
-1.60 |
-1.40 |
-2.00 |
|
MIROC |
-0.39 |
-0.50 |
-0.59 |
-0.58 |
-1.02 |
-1.33 |
|
MPI |
-0.51 |
-0.63 |
-0.83 |
0.06 |
0.08 |
-0.62 |
|
NCC |
-0.44 |
-0.54 |
-0.65 |
-0.52 |
-1.16 |
-1.71 |
|
NOAA |
-0.38 |
-0.50 |
-0.58 |
1.50 |
1.20 |
0.90 |
|
Mean |
-0.46 |
-0.59 |
-0.71 |
-0.20 |
-0.38 |
-0.89 |
As said earlier, the range of mean change is negative and close to zero for both climate parameters. The models which predict highest negative changes in PV power potential due to the temperature projected increase are ICHEC for EAP and NLL with -0.60% and -0.96% respectively and CCCma for ELL with -0.81% of change. In the same way IPSL predicts highest negative changes in PV power potential due to the solar irradiance projected decrease with -1.6%, -1.4% and -2.0 % respectively for EAP, ELL and NLL. On the other hand, CNRM projects lowest negative change for all regions considering temperature whereas NOAA projects positive change for all regions due to solar radiation. The ensemble models mean shows the average change of all models for both temperature and solar irradiance contribution. It was remarked that the sum of these two contributions gives the global PV potential change obtained earlier for each region.
4. CONCLUSIONS
The climate change impacts on
photovoltaic power potential have been performed in Burundi considering
historical period and near future period. Observed data of surface air
temperature provided by meteorological stations from Geographical Institute of
Burundi (IGEBU) and solar radiation data taken from Soda database were used
over the historical period (1981-2010). Furthermore, simulated data from eight
Regional Climate Models available in the context of CORDEX over Africa were used over the near future period
2021-2050 after bias correction in order to reproduce the future climate
conformably to observed data. The changes for main climate parameters in solar
energy like temperature and solar irradiance were analyzed. Then, the impacts
of this climate change over solar power systems were performed to show PV power
potential change according to the methodology developed by Crook et al. [10] and resumed by other many authors. The contribution of
each parameter to the PV power change was also analyzed.
The results for linear trend changes of temperature and solar irradiance show that solar radiation presents a decreasing trend and a negative change; while for surface air temperature, all models predict an increasing trend with a positive change over all regions. The interannual changes revealed downward trends in average of solar irradiance change with a high interannual variation and showed also general upward trends in surface air temperature but with very low interannual variation. It has been observed that solar irradiance mean change is negative for all regions and the mean decrease ranges between 2 and 4 W/m² while the mean of linear trend changes in surface air temperature for all eight models is close to 1.5°C for all site of study area.
For PV power potential change, the
findings pointed out the percent change in PV power potential estimated by
eight models ranging from -5% to 5%. The ensemble models mean projected a
slight decrease in PV power potential for about -1.5% for NLL, -0.9% for ELL
and -0.6% for EPA. The change in solar radiation and in surface air temperature
does not predict huge change in PV potential but the interannual variation
seems to be higher.
The contribution of each parameter varies from one region to
another and the change in temperature and solar irradiance are negative which
prove the no compensation resulting in their changes. The PV power output
change caused by only temperature does not present large variation because the
temperature change itself does not make huge variation (about 2°C). However,
for solar radiation, the vast range of change (±30W/m²) explains the large
interannual variation of PV power output change caused by solar irradiance. The
ensemble models mean change shows the average change of all models either for
temperature and solar irradiance contribution and it was remarked that the sum
of these two contributions gives the global PV potential change. The PV power change described and analyzed for three
regions in the eastern of Burundi does not show huge change but high variation
of PV power potential change. This means that Burundi may invest in the PV
power plant in this region to produce electricity energy from photovoltaic
systems.
SOURCES OF FUNDING
None.
CONFLICT OF INTEREST
None.
ACKNOWLEDGMENT
The authors gratefully acknowledge the German Federal Ministry for Education through the German Academic Exchange Service (DAAD) for supporting this research work. The authors also gratefully acknowledge the Geographical institute of Burundi for providing rainfall and temperature data for the selected stations in the study area.
REFERENCES
|
|
 This work is licensed under a: Creative Commons Attribution 4.0 International License
© Granthaalayah 2014-2020. All Rights Reserved.