
Effectiveness of Audit Committee Characteristics and Audit Quality on Financial Performance: A study of Selected Listed Companies in India
H. Rajashekar 1![]() , Abhay R 2
, Abhay R 2![]()
1 Professor,
Department of Studies in Commerce, University of Mysore, Mysuru City, India
2 Research
Scholar, Department of Studies in Commerce, University of Mysore, Mysuru City,
India
|
|
|
ABSTRACT |
|
|
The aim of
this investigation is to evaluate the effect of the “Audit Committee
Characteristics” and “Audit Quality” on the “financial performance” of NSE
listed companies in India. Content analysis has been done using the top 10
NSE-listed companies for 2020 to 2022 measuring the values of ROA, ROE, and
market capitalization. The application of a theoretical framework of agency
theory has also been employed and implications identified to analyze the
effect of these research-dependent variables on the independent variables.
The result of this investigation manifest that the companies that have higher
results are less probable to require a greater AC. While, on the other hand,
the companies that have lower ROE and ROA are in need of
greater “audit quality” and “characteristics of the AC”. |
|||
|
Received 20 September 2022 Accepted 22 October 2022 Published 10 November 2022 Corresponding Author Abhay R, abhayrajumysore@outlook.com DOI10.29121/granthaalayah.v10.i10.2022.4876 Funding: This research
received no specific grant from any funding agency in the public, commercial,
or not-for-profit sectors. Copyright: © 2022 The
Author(s). This work is licensed under a Creative Commons
Attribution 4.0 International License. With the license
CC-BY, authors retain the copyright, allowing anyone to download, reuse,
re-print, modify, distribute, and/or copy their contribution. The work must
be properly attributed to its author.
|
|||
|
Keywords: Audit Committee, Audit Committee
Characteristics, Audit Quality, Financial Performance, and Agency Theory |
|||
1. INTRODUCTION
According to Beasley (2009),
An AC is increasingly responsible for the quality of financial reporting and
oversight of the audit processes in large public companies. The AC function has
evolved in India over the years with recommendations of the Confederation of
Indian Industries (CII), Kumaramanglam Birla Committee, new rules of the
Securities and Exchange Board of (SEBI) and the amended Companies Act, 2013.
Now-a-days, an AC is viewed as an oversight function of CG, financial reporting
process, internal control structure, and audit functions.The recently modified
“Companies Act, 2013” has made an initiation of the compulsion AC and it is
needed to satisfy some conditions, particularly in the regulations. In regard to auditing, the Act mandates that every listed
company and other public companies with a paid-up capital of more than Rs. 10
Crores or a turnover of INR 100 crores or outstanding loans or borrowing
exceeding INR 50 crores (as per the latest audited accounts) to form an audit
committee comprising at least 3 directors, the majority of whom have to be
independent as well as a Nomination and Remuneration Committee, in which at
least half the members have to be independent. The enhanced regulatory functions of the audit profession
have shifted concentration to the accountability of the ACs whose principal aim
is to oversee the yearly financial reporting and related internal authorities.
2. Review of Literature and Hypothesis Development
1)
The
link between “characteristics of the AC” and the “financial performance” of
companies:
The notion of an AC was generally suggested by AICPA in the year 1967 as the initiation of an AC to help the reporting procedure. The AC is a section of the corporate governance (CG) mechanism by which best practice is initiated so that the company can reach its objectives. The Companies Act, 2013 was a sustained prolonged act that was approved to acknowledge the inadequacies of the prior Companies Act, 1956. This standard legislation has had a pre-established effect on CG. As soon as it came to CG, the companies act put importance on making sure that proper freedom of the board members, specifically the directors, for efficient authorization and control is there Aslam and Haron (2020). The objective was to safeguard and give a greater advantage to the stakeholders and other related concerned participants. The legal distress is the significance of endorsing the principles of responsibility, liability, and transparency.
Moreover, it puts answerability on the board of directors for any misdeed or omission initiated in the company within full knowledge. The law further gives suggestions and regulations on the creation of committees that implement auditing, with particular regard to the volume, under inference, experience, and percentage of females in the committee, regularity, and qualifications. Following the establishment of the law, it became mandatory for all parties to abide by the guidelines relating to the features of an AC. Modern literature in reference to the link between features of the AC and the performance of firms in this notion of India and other areas has initiated inconclusive outcomes.
For instance, various researchers scrutinize the effect of the AC’s characteristics such as independence, and frequency of meetings in improving performance. The scholars applied fixed effects regression evaluation on data of 235 companies on the NSE for the past 10 years. The outcomes manifested a remarkable positive alignment between independence and frequency of meeting with an aggregate capital performance on Indian companies. In a similar context, others also evaluate the inference of encounters and proficiency of the committee on the financial well-being of companies Chaudhry et al. (2020). The results of those investigations manifest that the financial and authorizing compatibility of the committee proactively enhances asset-yielding and earning margins.
2)
The
link between audit quality and the financial performance:
The term audit quality is basically a process implemented by auditors to make sure that the client companies obey auditing standards, following particular quality control processes assisted in consistently fulfilling the standards in their results. Various investigations have stated “audit quality” with different types of variations. According to some researchers, “audit quality” is the probability that auditors will identify violations in the accounting system of the client and report those misdeeds Bacha et al. (2020). Previous investigations have analyzed the role and efficiency of external auditors in regard to firms' performance. It has been manifested that the presence of a powerful, experienced, and professional auditor improves the performance of the firm. This is since the auditor follows accountabilities in a more appropriate and professional approach. Looking at the independence of auditors, committee memberships, and audit fees on the asset returns of those companies, it was evident that the independence has a strong positive and considerable effect on the performance of those companies Al-ahdal and Hashim (2021). Moreover, the external audit standard and size of the AC are significantly and positively correlated with the performance as per various past results of regression investigation. The researchers also mentioned that the insufficiency of undue impact on the committee of audit has a positive interlink with the overall victory of firms. In contrast, external auditors have a consequentional effect on the performance of those firms. Scholars have argued that wider audit standards would improve the form of value indicating a link between these two.
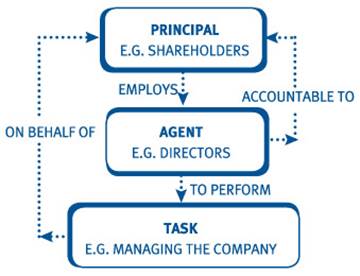
3. Agency Theory
This investigation is theoretically unpinned by Agency theory. This theory puts forward for discussing the link between the principle such as authority and agent. Principles deploy an agent to implement the task in the interest of the main principles including delegation of control, decision-making, and so on Ado et al. (2020). In different companies, where the capital includes years holders it plays the role of principals and managers as their agents. The shareholders also deploy managers to act accordingly in the interest of the main principle. But in the real world, company managers frequently have various other goals and many conflicts within the principal objectives between the shareholders.
The issues arising out of those concerns of interest between those parties are called agency issues. At first, observing expenses of the costs incurred to direct the functions implemented by the agent. Secondly, bonding expenses or those costs to make sure that the agent will not play against the principal core, or in basic words, to please the agent that the principal will give compensation in case the agent actually implements the action EL Gharbaoui and Chraibi (2021). Third, the residual expenses are the value of capital equivalent to the diminished prosperity encountered by the principal because of the differences of interest.
Figure 1
|
Figure 1 Agency Theory Source EL Gharbaoui
and Chraibi (2021) |
The implication of the theory in this investigation is that the AC that is a part of the CG has a supervisory action in making sure that the financial statements published by the companies show the actual situation of the company. In addition to that, the ACs have the control to determine the incentive provided to the providers of audit services to create high-audit standards Ahmeti et al. (2022). Yet, on the contrary, the AC is a part of the overall organization that has an interest in manifesting a good and healthy situation of the Company to the external users through financial statements. As a reason, these investigations try to observe the way features of the AC at different companies enhance the audit standard through incentive provisions.
The hypothesis proposed in the study are:
H0: “characteristics of the AC” and “audit quality” do not impact firms' performance.
H1: The size of the AC affects “audit quality”.
H2: “audit quality” impacts the “financial performance” of companies.
4. Research Methodology
4.1. Data Collection and Sample Size
The investigation concentrates exclusively on the companies listed in NSE. The secondary quantitative method has been considered and the sample size was limited to 10 which shows the primary sectors of the Indian economy depending on the full capitalization of the market. The data for the study was collected from the official websites and annual reports of those companies.
Table 1
|
Table 1 Top 10 NSE Listed Companies in India |
|||||
|
Company Name |
Last Price |
% Chg |
52 wk High |
52 wk Low |
Market Cap (Rs. cr) |
|
Reliance |
2,540.55 |
-0.20 |
2,856.15 |
2,180.00 |
1,718,880.11 |
|
TCS |
3,214.80 |
-0.83 |
4,043.00 |
2,926.10 |
1,176,311.84 |
|
HDFC Bank |
1,515.25 |
0.07 |
1,722.10 |
1,271.60 |
843,988.04 |
|
Infosys |
1,542.65 |
-0.69 |
1,953.90 |
1,355.00 |
649,120.65 |
|
ICICI Bank |
909.55 |
0.54 |
943.25 |
642.15 |
633,999.41 |
|
HUL |
2,527.45 |
0.36 |
2,734.00 |
1,901.55 |
593,847.44 |
|
SBI |
577.15 |
0.58 |
586.20 |
425.00 |
515,083.97 |
|
Bharti Airtel |
822.45 |
1.56 |
841.45 |
628.75 |
465,613.91 |
|
HDFC |
2,496.55 |
-0.46 |
3,021.10 |
2,026.00 |
453,705.68 |
|
ITC |
357.30 |
0.75 |
357.30 |
207.00 |
443,190.18 |
|
Bajaj Finance |
7,163.00 |
0.10 |
8,045.00 |
5,220.00 |
433,668.96 |
|
Source Tradebrains,
2022 |
|||||
4.2. Variables and Model
Specification and Multivariate Techniques
This investigation considered 3DV, 2 IDV, and 2 control variables. The dependent variables are ROA and ROE Dsouza (2021). The independent variables are “audit quality” and the “characteristics of the AC”. Whereas the control variables are leverage and firm size. The study applied data from the top 10 companies over a period from 2020 to 2022. In case 2021 is considered to be the middle year between 2020 and 2022 then 2020 is the past year that can be considered as 52 weeks low while 2022 is the upcoming year therefore, it can be referred as 52 weeks high (1 year comprises of 48 weeks that is 12X4). In the above table, HDFC bank has been considered twice thus, only once the bank have been taken below to determine the performance of the chosen bank through analysing the characteristics of the ACs. Multiple investigations have manifested that apply in data for evaluation has different advantages. It enables precise administration of individual variation. The values obtained from the annual reports of these top 10 companies has been evaluated and analysed based on the figures of central tendency and this helped in giving a more accurate description of the overall data.
4.3. Research Design and Approach
The investigation employed Expo-fact research. It is considered to be appropriate for the investigation as this examination is focused on achieving significant data on the status of particular phenomena and after some generally appearing factors without any situational manipulation. Furthermore, it applies a quantitative approach with the archival method that uses a secondary type of data from the annual reports of the company after identifying the companies from different sectors through NSE. The determination of the sample size is done by applying the purposive method of sampling. That is the choice of sampling depending on a few criteria predetermined. Apart from that, the collected data have been statistically tested through descriptive statistics, and correlation in the data analysis tool that is Microsoft Excel (Ms Excel).
5. Results and Analysis
The ROA and ROE have been considered to be dependent variables where ROA has been referred to the financial ratio indicating the profitability of an organisation in connection with overall assets. On the other hand, ROE has been considered to be the measurement of the financial performance that has been above calculated through dividing the net income by the equity of the shareholders of the organisations. In this aspect, both ROA and ROE have been productive to evaluate financial performance and profitability of those chosen organisations as identified in the NSE. As the sample has been stated to be limited to only 10 companies therefore, HDFC bank have been included once to obtain the results from different statistical methods. Market capitalisation is the market value of the equity of the organisations. The company shares are required to be multiplied with the price of each (per) share in the competitive market. The dependent and independent variables are required to be considered to further analyse the results of the statistical tests.
Table 2
|
Table 2 Descriptive Statistics Between 2021 and 2022 |
|||
|
0.143883595 |
0.08 |
||
|
Mean |
7.839891917 |
Mean |
0.11555556 |
|
Standard Error |
7.619678679 |
Standard Error |
0.03851807 |
|
Median |
0.181720762 |
Median |
0.06 |
|
Mode |
#N/A |
Mode |
0.02 |
|
Standard Deviation |
22.85903604 |
Standard Deviation |
0.11555422 |
|
Sample Variance |
522.5355286 |
Sample Variance |
0.01335278 |
|
Kurtosis |
8.999003403 |
Kurtosis |
-0.0035506 |
|
Skewness |
2.999776308 |
Skewness |
0.99233236 |
|
Range |
68.74223362 |
Range |
0.33 |
|
Minimum |
0.053907396 |
Minimum |
0.01 |
|
Maximum |
68.79614102 |
Maximum |
0.34 |
|
Sum |
70.55902726 |
Sum |
1.04 |
|
Count |
9 |
Count |
9 |
|
Confidence Level (95.0%) |
17.57101054 |
Confidence Level (95.0%) |
0.08882284 |
|
Source Excel |
|||
The dependent variables have been chosen to obtain the mean, median, mode and other values. The mean value is 7.8, standard error is 7.61, median is 0.18 and others for ROE. The mean value of ROA is 0.11, standard error is 0.03 while median is 0.06 and others.
Table 3
|
Table 3 Descriptive Statistics Between 2020 and 2021 |
|||
|
0.113258009 |
0.06 |
||
|
Mean |
6.561769522 |
Mean |
0.097777778 |
|
Standard Error |
6.403424993 |
Standard Error |
0.039573342 |
|
Median |
0.16852052 |
Median |
0.04 |
|
Mode |
#N/A |
Mode |
#N/A |
|
Standard Deviation |
19.21027498 |
Standard Deviation |
0.118720025 |
|
Sample Variance |
369.0346648 |
Sample Variance |
0.014094444 |
|
Kurtosis |
8.997736337 |
Kurtosis |
-0.191504114 |
|
Skewness |
2.999490404 |
Skewness |
0.77565434 |
|
Range |
57.98189186 |
Range |
0.37 |
|
Minimum |
-0.194977773 |
Minimum |
-0.05 |
|
Maximum |
57.78691409 |
Maximum |
0.32 |
|
Sum |
59.0559257 |
Sum |
0.88 |
|
Count |
9 |
Count |
9 |
|
Confidence Level (95.0%) |
14.76632451 |
Confidence Level (95.0%) |
0.09125629 |
|
Source Excel |
|||
The mean is 6.5 however standard error is 6.4, median is 0.1 while the mean value is 0.098, 0.04, 0.04 and others according to the above table.
Table 4
|
Table 4 Correlation Test Between 2021 and 2022 |
||
|
|
0.14388 |
0.08 |
|
0.143884 |
1 |
|
|
0.08 |
-0.3044 |
1 |
|
Source Excel |
|
|
Correlation denotes the association among two variables specifically the strength between those chosen variables where ROA and ROE as dependent variables have been correlated with each other. The ROE value is 0.14388 while ROA value is 0.08 however, correlation results are 1 and -0.3044 for ROE and ROA.
Table 5
|
Table 5 Correlation Test Between 2020 and 2021 |
||
|
|
0.1133 |
0.06 |
|
0.1133 |
1 |
|
|
0.06 |
-0.237 |
1 |
|
Source Excel |
||
The result from this statistical method shows 1 and -0.237 as per the ROE and ROA values. Regression test identifies the input y as the dependent variable while input x as the independent variables to obtain the results. The “audit quality” has been considered to be independent variables where auditors are stated to be responsible for keeping an eye on the companies on account of adherence or violation of the accounting standards and accounting system by those companies. The total assets are referred as the summation of different book values of every asset that has been owned by the companies. The auditors are liable to check the book values of the assets in correspondent to adherence and disobey of the accounting standards of the companies. Therefore, the total assets have been synonymous with audit quality to identify the independent variable to conduct the regression test. ROA as dependent while decrease and increase of total assets as the effect of audit quality has been taken in terms of analysing the regression results.
Table 6
|
Table 6 The Table Given Below Represents the Market Capitalization, Net Profit, Total Assets, ROA, Total Equity, and ROE of the top 10 NSE-listed Indian Companies for the Year 2020 to 2021 and 2021 to 2022 |
||||||||||||
|
2021-2022 |
2020-2021 |
|||||||||||
|
Company |
Market
Capitalization |
Net
profit |
Total
assets |
Total
equity |
ROE |
ROA |
Market
Capitalization |
Net
profit |
Total
assets |
Total
equity |
ROE |
ROA |
|
Reliance |
17,81,841 |
67,845 |
8,78,674 |
4,71,527 |
0.14 |
0.08 |
13,15,998 |
53,739 |
8,73,673 |
4,74,483 |
0.11 |
0.06 |
|
TCS |
13,61,453 |
48,453 |
1,41,514 |
89,846 |
0.54 |
0.34 |
11,82,074 |
42,481 |
1,30,759 |
87,108 |
0.49 |
0.32 |
|
HDFC
Bank |
8,41,070 |
38,150.90 |
20,68,535.05 |
554.55 |
68.80 |
0.02 |
8,41,070 |
31,856.77 |
17,46,870.52 |
551.28 |
57.79 |
0.02 |
|
Infosys |
8,02,162 |
22,110 |
99,387 |
69,306 |
0.32 |
0.22 |
5,82,880 |
19,351 |
93,939 |
71,531 |
0.27 |
0.21 |
|
ICIC |
5075.48 |
233.39 |
14,112.98 |
1,705.12 |
0.14 |
0.02 |
4025.8 |
161.93 |
12,304.33 |
1,475.09 |
0.11 |
0.01 |
|
HUL |
4,81,396 |
8,818 |
69,737 |
48,525 |
0.18 |
0.13 |
5,71,133 |
7,954 |
68,116 |
47,199 |
0.17 |
0.12 |
|
SBI |
5,12,139 |
31,676 |
5,31,255.45 |
2,46,360.79 |
0.13 |
0.06 |
5,12,138 |
20,410 |
4,77,577.94 |
2,25,248.09 |
0.09 |
0.04 |
|
Bharti |
4,303 |
42,549 |
28,48,545 |
7,89,298 |
0.05 |
0.01 |
491663.93 |
-1,50,835 |
27,77,471 |
7,73,601 |
-0.19 |
-0.05 |
|
ITC |
3,08,882 |
15503.13 |
77259.55 |
61399.57 |
0.25 |
0.20 |
2,11,058 |
13382.88 |
73819.3 |
59004.62 |
0.23 |
0.18 |
|
Bajaj |
2,307.53 |
6,350.49 |
1,68,016.08 |
42,055.88 |
0.15 |
0.04 |
1,06,005 |
3,955.51 |
1,38,283.55 |
35,938.74 |
0.11 |
0.03 |
|
Source
MS EXCEL |
||||||||||||
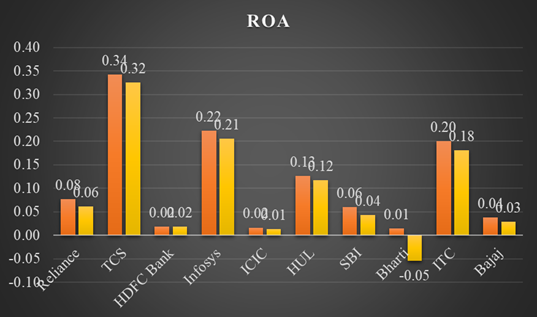
The maximum value of market capitalization in the year 2020 was Rs.17818414 Reliance company, while it was also highest for the next year at Rs.1315998. Relying on the value of market capitalization, it is evident that reliance has the maximum growth in “financial performance”, and the size of the company is also higher than any other. The table given above further illustrates the characteristics of the research variables applied in this investigation. Whereas, on the contrary, the least number of ROA in 2021 is 0.014 Bharti Airtel company Bharti Airtel Limited (2022). The performance of Reliance can be understood through ROA and ROE where ROA value is 0.08 which is still better than HDFC bank, ICICI bank and others hose ROA are 0.02, 0.02 and others Reliance (2022).
Conversely, the performance of Bajaj can be analysed through ROE which is around 0.11 and ROE is 0.03 Bajaj Finance (2022). The total asset of Reliance is 878674 in 2021 to 2022 while total assets have decreased in 2020 and 2021. Therefore, the performance has improved in 2021 and 2022 as compared with 2020 and 2021 indicating certain negative relationship between the variables. In terms of SBI, total assets have been around 531255.45 in 2021 and 2022 while total assets have 477577.94 in 20220 and 2021 SBI (2022). The figure given below gives a visual representation of ROA for the top 10 companies in the past three years. It indicates only one negative value which is -0.05 for Bharti Airtel company indicating inadequate AC characteristics and “audit quality” of the company, while it is highest at 0.32 for TCS TCS (2022). The figure indicates the inadequate AC size of Bharti Airtel company as the size of the AC or the regularity of the meetings and even the “audit quality” reflects on the “financial performance” of companies. As a reason, here, the only Bharti company has negative “financial performance”.
As evidence for this, the company, in its director’s report has mentioned taking some of the majorly material assessment practices in their last year to analyze the ESG problems that may affect their businesses The Economic Times (2022). Apart from that, observing the maximum value of ROE, it is higher for 2021 at 68.80, while it is 57.794 in 2022 yet both these ROE is given by HDFC bank HDFC Bank (2022). It indicates enhanced performance of the authority towards looking after internal system of HDFC according to “audit quality” and “characteristics of the AC”.
Figure 2
|
Figure 2 ROA
for Both 2020-2021 and 2021-2022 Source MS EXCEL |
6. Conclusion
This investigation aimed to identify the effect of ACC on the “financial performance” of firms listed with NSE. The findings of this investigation have showed that ACC has an extremely positive impact on the ROE and ROA of these companies and among them, Reliance and HDFC bank show the greater results indicating a strong regulatory system and internal authority. These findings have also been backed up using the vertical background in the literature review part. As evidence for a requirement for stronger ACs and “audit quality”, the companies that have shown negative or lower values of total assets or profit or in demand for higher or greater ACs and periodic meetings.
CONFLICT OF INTERESTS
None.
ACKNOWLEDGMENTS
None.
REFERENCES
Ado, A.B., Rashid, N., Mustapha, U.A. and Ademola, L.S. (2020). The Impact of "Audit Quality" on the "Financial Performance" of Listed Companies Nigeria. Journal of Critical Reviews, 7(9), 37-42. https://doi.org/10.31838/jcr.07.09.07.
Al-ahdal, W.M. and Hashim, H.A., (2021). Impact of Ac Characteristics and External "Audit Quality" on Firm Performance : Evidence from India. CG: The International Journal of Business in Society. https://doi.org/10.1108/CG-09-2020-0420.
Aslam, E. and Haron, R. (2020). CG and Banking Performance : The Mediating Role of Intellectual Capital Among OIC Countries. CG : The International Journal of Business in Society. https://doi.org/10.1108/CG-08-2020-0312.
Bacha, S., Ajina, A. and Saad, S.B. (2020). CSR Performance and the Cost of Debt : Does "Audit Quality" Matter?. CG : The International Journal of Business in Society. https://doi.org/10.1108/CG-11-2019-0335.
Bajaj Finance (2022, October 25th). Annual Report 2021-2022.
Bharti Airtel Limited (2022, October 25th). Integrated Report and Annual Financial Statements 2021-22.
Chaudhry, N.I., Roomi, M.A. and Aftab, I. (2020). Impact of Expertise of Ac Chair and Nomination Committee Chair on "Financial Performance" of Firm. CG: The International Journal of Business in Society, 20(4), 621-638. https://doi.org/10.1108/CG-01-2020-0017.
Dsouza, S. (2021). Impact of Internal "Audit Quality" on Financial Stability. Journal of Commerce and Accounting Research.
EL Gharbaoui, B. And Chraibi, A. (2021). Internal "Audit Quality" and "Financial Performance” : A Systematic Literature Review Pointing to New Research Opportunities. Revue Internationale des Sciences de Gestion, 4(2).
HDFC Bank (2022, October 25th). Annual Report 2021-2022.
HUL (2022, October 25th). Hindustan Unilever Limited Integrated Annual Report 2021-22.
ICIC Bank (2022, October 25th). Annual Report 2021-2022.
ITC Limited (2022, October 25th). Report And Accounts 2022. Itcportal.com.
Money Control (2022, October 25th). HDFC Bank : Profit and Loss.
Reliance (2022, October 25th). Financial Reporting.
SBI (2022, October 25th). Annual Report 2021 - 22.
TCS (2022, October 25th). Investor Relations.
The Economic Times (2020, October 25th). ACs Need to Play More Active Role: CEPR.
The Economic Times (2022, October 25th). Bharti Airtel Director Report.
Tradebrains (2022, October 25th). Top 10 Companies in India by Market Capitalization.
 This work is licensed under a: Creative Commons Attribution 4.0 International License
© Granthaalayah 2014-2022. All Rights Reserved.

