NEXUS BETWEEN POPULATION VARIABLES AND ECONOMIC GROWTH IN NIGERIA: DIRECTION OF CAUSALITY
Fasoye Qosim 1![]() , John Akintayo Omimakinde 2
, John Akintayo Omimakinde 2![]() , Elizabeth Adeteju
Omimakinde 3
, Elizabeth Adeteju
Omimakinde 3
1,2,3 National
Centre for Technology Management, Obafemi Awolowo University, Ile-Ife, Nigeria
|
|
|
ABSTRACT |
|
|
The study
investigated the direction of causality between population variables and
economic growth in Nigeria between
1986 and 2020 using VAR Granger Causality/Block Exogeneity Wald Tests. The results
of the findings revealed the existence of feedback effects among economic
growth, death rate, birth rate and secondary school enrollments. The results
further showed that population growth and per capita GDP growth are
completely independent, and that higher population growth rate did not
translate to higher economic growth in Nigeria. The study concluded that an
average population growth rate in Nigeria was not seen as being productive as
it did not translate to economic growth. |
|||
|
Received 16 April 2022 Accepted 15 May 2022 Published 13 June 2022 Corresponding Author Fasoye
Qosim, DOI 10.29121/granthaalayah.v10.i5.2022.4616 Funding: This research
received no specific grant from any funding agency in the public, commercial,
or not-for-profit sectors. Copyright: © 2022 The
Author(s). This work is licensed under a Creative Commons
Attribution 4.0 International License. With the
license CC-BY, authors retain the copyright, allowing anyone to download,
reuse, re-print, modify, distribute, and/or copy their contribution. The work
must be properly attributed to its author.
|
|||
|
Keywords: GDP, VAR, Causality, Population, Death
Rate, Birth Rate |
|||
1. INTRODUCTION
The empirical debates on the intertemporal research into population growth, birth and mortality situation have been topical research issues in most of the developed economies. Reasons for this inadequate focus on population-related research in the developing nations were partly blamed on the unavailability of favourable environment that enables such task Pitchford (1968) However, right from the Malthusian days, population boom has been a thing of serious concern. Malthus in 1798 was the first to raise this concern, stipulating those natural resources become inadequate when population growth exceeds production growth.
Defining population depends on the view of the researcher, the discipline, and the goal, aim and objective of the research. Population is such fundamental for so many scientists that make use of data regularly in analysis. Because of these different meanings and interpretations attributable to population, the term is mostly left undefined, with the user and the listeners left to determine the relevance of population in their area of focus Pitchford (1968), National Population Commission (2016) Despite the definition of population according to economic and statistical profession, a more general definition of population can be referred to as the economic, legal, political, and social relationships in a country between individuals that produce, reproduce, and transform the daily conditions of life (e.g., involving work, commerce, property, and the production, exchange and consumption of material goods; establishing and maintaining family life from birth to death), which individuals are legally permitted to engage in World Bank (2015), Tai-Hsin and Xie (2013)
In Nigeria, the study of population and its day-to-day interaction within its immediate environment cannot be overemphasized. This is because it gives clear understanding of all situations, both economic, politically, socially, legally among others occurring within the society. Nigeria has an annual population growth rate of 2.8%. The Nigeria’s population was also estimated at 193 million by the year 2016. This number is even expected to double in 44 years National Population Commission (2016)
In exploring the effect of population on economic growth, and in determining whether the interrelationship is positive or negative as it has been done in various studies, it would not be sufficiently determined if the main components of population were not examined as they contribute or restrict economic growth. Thus, the two major constituents of population are the rate of birth and death, better identified as the fertility and mortality rates; and these two factors have a way of influencing productivity in any economy Tai-Hsin and Xie (2013) Also, the developing economies which seem to be less productive have a high fertility rate when compared with most other developed economies. Hence, they are more densely populated than the developed economies but majorly, lack basic resources to support their population Flegg (1980), Flegg (1988)
Population growth serves as the primary unit of the social economy that provides labour for fostering economic growth Tai-Hsin and Xie (2013) Hence, a dwindling population stands the risk of running out of adequate labour force supply from the working age group of the society Yujie (2017), Cai (2018) There have been series of academic argument on the actual effect of population growth, fertility, population dividend, among others, have on economic growth. Studies are mainly divided into three major categories: the positivism, the negativism, and the neutral schools of thought. The positivism school argued that population growth, with adequate human capital development, tends to influence economic growth positively. Studies that concur with this argument include Bloom et al. (2004), Boarnet (1994), Brezis and Young (2016)
It was also posited in literature that population growth will always inhibit economic growth as the resources needed for daily maintenance of the current population rate of increase cannot be easily reproduced without affecting capital formation processes. This manifests in the food crisis experience in most part of the country while there also is a significant reduction in productivity Galor and David (2000), Inyang (2003), Cai (2018) While it is generally believed in most studies from the developed and developing economies that population growth causes economic growth Pesaran and Shin (1998), Brezis and Young (2016) there is every possibility that economic growth can cause population growth.
It was expressly stated that abundance of food production amid a well-structured environment has the capacity to encourage population growth Inyang (2003) Studies also supported that improvement in the general economic wellbeing causes population growth either by encouraging migration or by increase in birth rates Wolfe et al. (1982), Cai (2018), Galor and David (2000) Hence, it becomes pertinent to explore population – economic growth interaction as it concerns the Nigerian economy.
This study is organised into five sections: Section one is the Introduction, Section two focuses the review of literature; section three deals with Methodology, variable measurement, and sources of data. Section four discusses the results with their detailed analysis. Finally, Section five contains the main conclusion of findings.
2. LITERATURE REVIEW
In an attempt to enhance the productivity and the reduction of zero population – output interaction, the role of population in societal development was explored and the findings of revealed that continuous development facilitation requires simultaneous increase in population Teitelbaum (1974) It however opined that awareness must continually be created in order to avoid situations of extreme population growth, beyond the level of productivity, which the study termed population bomb.
The pressure on food supplies, resources, employment opportunities, and social services was necessitated by population explosion continued to further aggravate the fragile socio-economic structure and promote additional political instability in the region Gonzalez (1971) The rate of growth in population was found to behave outpaced that of food production in Nigeria through an empirical interaction among population, environment, and food provision of the most populous country in Africa Inyang (2003)
Contrary to the above, ageing population was found in literature to have significantly contributed to low labour force participation, reduction in savings and the attendant concerns about its futuristic restrictive effect on economic growth especially among the OECD countries Bloom et al. (2010) The numerous issues and challenges facing ageing population in Korea were viewed through productivity, economic growth, and old age income security Phang (2011) The results of the findings indicated that the Korean old-aged seem to remain in the labour market in higher proportion than those of Western industrialized countries. Hence, the Korean pattern is similar to that of Japan, European Union, or OECD countries. The study therefore concluded that reinforcement of the ageing Korean could help sustaining economic growth.
Recent literature emphasizes that greater productivity can only be enhanced through the interaction between the ancient and modern population -economic growth relationship in the developed economies Brezis and Young (2016) The measure of Total Factor Productivity (TFP) emanating from the Solow-Swan model and the Lorenz curve was employed to analyse the effectiveness of investments in the selected States of USA and the results of the study revealed that population distribution affects investment expansion and general economic growth Chenavaz and Octavio (2015) It has also been supported that improvement in the general economic wellbeing causes population growth either by encouraging migration or by increase in birth rates Lee (1990), Cai (2018), Galor and David (2000) These studies opined that any increase in economic growth can increase family’s earning capacity, causing a simultaneous rise in population.
Findings in literature have shown divergent views on the impact of various aspects of population on economic growth. While some emphasized a strong negative relationship Cai (2018), Yujie (2017) some emphasized the positive interaction Drèze and Murthi (2001), Lee (1990), Frimpong and Adu (2014) while others are neutral Tai-Hsin and Xie (2013), Galor and David (2000), Phang (2011), Engle and Granger (1987) Further research into this relationship is therefore of immense importance.
3. METHODOLOGY
To explore the empirical relationship between population and economic growth in Nigeria, this study shall rely on the Solow’s growth model. The relationship between population factors such as fertility and mortality rates determine physical capital investment, and this determines economic growth.
Therefore, assume S(t) representing total savings is a constant fraction s of total income Y(t), the following equation was derived:
![]() Equation 1
Equation 1
Assume also that population grows at a constant rate, while dividing through by population (Pt), therefore P (t + 1) = (1 + n) Pt becomes
![]() Equation 2
Equation 2
The equation above represents per capita contribution of labour and capital to total output, where k = K / P and y = Y / P. thus, it explains the per capita stock in the next period (t + 1) adjusted by the growth rate of population. It should be noted that growing population reduces the per capita stock, thus the more (n), which is the number of populations, the less the growth in (k) which is the capital stock growth rate per time and (y), the growth rate of output reduces. The growth rate of output sY(t) can thus be estimated by the following equation:
![]() Equation 3
Equation 3
Through logarithmic transformation, we arrive at the following estimable equation:
![]() Equation
4
Equation
4
Where,
Yt represents total output and
Kt denotes a matrix of all population variables that determines the capital stock for productivity.
3.1. MODEL SPECIFICATION
Following the theoretical framework above, the theoretical basis for this study hinges on Solow growth model and is in line with related empirical works Payne and Ewing (1997), Galor and David (2000), Yujie (2017)
Therefore, the baseline equation for this study is as follows:
![]() Equation 5
Equation 5
Where Ht represents matrix of all explanatory variables at time t.
By formulating a log-linear model that encompasses all the explanatory variables, the model becomes
![]() Equation
6
Equation
6
Where,
GDP is GDP per capita (proxy for economic growth);
BTR is Birth Rate.
DTR is Death Rate.
SER is Secondary School Enrollments.
INV is Gross Capital Formation (proxy for the level of domestic investment in the economy).
INFL is Rate of Inflation.
αis the slope
ε is Stochastic error term; and
βi represents the coefficients of the variables
3.2. TECHNIQUE OF ANALYSIS
The objective of this study was achieved by the use of Vector autoregressive (VAR) technique. The choice of this stochastic process is because it is used to capture the linear interdependencies among multiple time series. VAR technique is adjudged as a method of investigating the dynamic interactions and shock transmission among variables as it provides information on impulse responses and variance decomposition. VAR models make all variables interact in the regression with the past values of one another. The models are dynamic and as such can explain the structure of time series better than the Ordinary Least Square (OLS) estimation technique.
The models also override the need for structural modelling by treating endogenous variables in the system as a function of the lagged values of all endogenous variables in the system. The direction of causality between population variables and economic growth in Nigeria growth can be captured by the model stated as follows:
![]() Equation
7
Equation
7
![]() Equation
8
Equation
8
Where GDP represent the Gross Domestic Product, and POP represents a matrix of all population variables that are assumed to have direct impact on economic growth. These variables include fertility or birth rate (BTR), mortality or death rate (DTR) and secondary school enrolment rate (SER). K represents the optimal lag length selected by the various lag length selection criteria while we shall determine the stability of the variables through appropriate unit root techniques.
3.3. MEASUREMENT AND SOURCES OF DATA
The study made use of annual time series secondary data over the study period. The description and measurement of variables and the sources of data are presented in Table 1 below.
Table 1
|
Table 1 Description and Measurement of Variables |
|||
|
VARIABLES |
DESCRIPTION |
MEASUREMENTS |
SOURCE OF DATA |
|
GDP
per capita (GDP) |
Economic
Growth |
Percentage
growth ratio of GDP divided by population |
Central
Bank of Nigeria Statistical Bulletin (2018). |
|
BTR |
Birth
Rate as a measure of birth and the number of children per woman. |
Birth
rate measured as the rate of increase in population per thousand. |
World
Bank’s World Development. Indicator (WDI, 2018). |
|
DTR |
The
rate of mortality among the citizens. |
Death
rate measured as the rate of decrease in population |
World
Bank’s World Development. Indicator (WDI, 2018). |
|
SER |
Secondary
school enrollments to represent the level of human capital in the economy |
School
enrolment per thousand of the population |
World
Bank’s World Development. Indicator (WDI, 2018). |
|
INV |
Gross Capital
Formation which captures the level of domestic investment in the economy. |
Gross
Capital Formation as a percentage of GDP. |
World
Bank’s World Development. Indicator (WDI, 2018). |
|
INFL |
Changes
in the prices of goods and services. It is an economic shock and determines
the level of economic stability. |
Inflation
rate |
Central
Bank of Nigeria Statistical Bulletin (2018). |
4. ANALYSIS AND INTERPRETATION OF RESULTS
4.1. DESCRIPTIVE STATISTIC ANALYSIS
The descriptive characteristics of all the variables in the model are presented in the Table 2 below. It was observed that there were shifts in the mean and standard deviation values of the variables.
Table 2
|
Table 2 Descriptive Analysis of Variables |
|||||
|
Variable |
Mean |
Std. Deviation |
Min. |
Max. |
Skewness |
|
LGDP |
6.472184 |
0.950302 |
5.034656 |
8.077658 |
0.469511 |
|
LBTR |
1.821349 |
0.059567 |
1.721158 |
1.91442 |
0.104305 |
|
LDTR |
4.638343 |
0.220983 |
4.203199 |
4.844187 |
-0.679172 |
|
LSER |
3.380716 |
0.470987 |
2.029308 |
4.0682 |
-1.063553 |
|
LINV |
2.577131 |
0.557562 |
1.697265 |
3.818 |
0.792215 |
|
LINFL |
2.168553 |
1.605233 |
-3.479103 |
4.340669 |
-1.783273 |
|
Source: Author’s computation from the data
extracted from CBN statistical bulletin (2018) and World Bank’s World
Development Indicator (WDI, 2018) |
|||||
4.2. PATTERN OF GROWTH OF POPULATION VARIABLES AND ECONOMIC GROWTH IN NIGERIA (1986 – 2020)
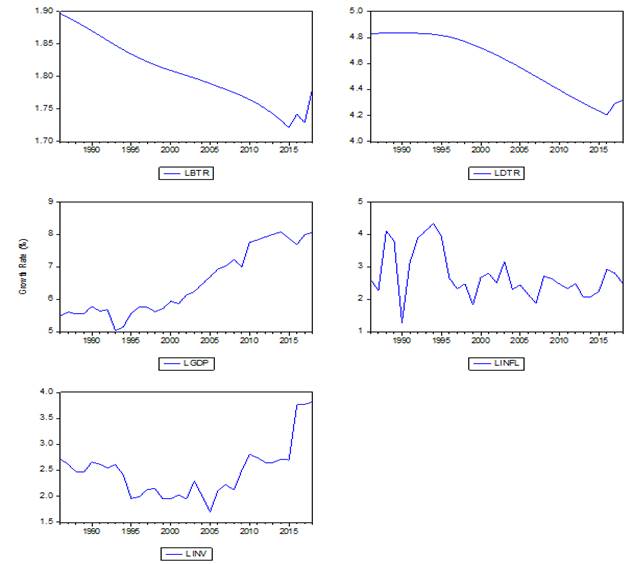
Figure 1 below describes the pattern of movement among the selected population variables (birth rate, death rate and secondary school enrolments) and GDP per capita (proxy for economic growth) as well the control variables (which include Gross capital formation and inflation rate) used in the study. It contains six panels, one for each variable.
Figure 1
|
Figure 1 Trend of population growth variables and economic growth in Nigeria (1986 – 2018) Source: Author’s graphical illustration from the data extracted from CBN statistical bulletin (2018) and World Bank’s World Development Indicator (WDI, 2018) |
The first panel in the top left corner of Figure 1 describes the growth rate of birth of the number of children per woman per thousand of population. From the panel, it is revealed that the birth rate in Nigeria continued to fall from 1.90 % growth rate in 1986 to as low as 1.73% in 2015. It rose to 1.75% in the beginning of 2016 and then fell but in 2018 it began to rise again. Similarly, the morbidity growth rate (which is contained in the second panel in the top right corner) followed the same pattern of growth rate of birth rate but at a higher rate. The implication of this is that the growth rate of the number of children per woman per thousand of population outpaces that of death rate between 1986 and 2018.
The third panel describes the growth rate of GDP per capital (proxy for economic growth). The panel revealed a downward movement in GDP per capital from 6.7% growth rate in 1980 to 5.4% in 1986. The following year witnessed a slight increase, and the tempo was maintained, though not smooth increase, till 1989. The value of GDP per capital in 1990 and 1991 was at lowest ebb but began to rise in 1992. The economy was on the recovery path again when it rose nonstop from 1993 to 2008; fell again in the year 2009 and began to rise in the subsequent years. Also, the increase in growth rate which commenced in the year 2010 was distorted a bit in 2015 and 2016 but rose again in 2017 and maintained the tempo in the year 2018.
It was shown in the fourth panel that inflation rate was increasing at a decreasing rate in Nigeria in the early 80s. The scenario changed in the year 1986 when Nigerian economy experienced an alarming rate of inflation. The period captured the Structural Adjustment Period (SAP, 1986) when the economy experienced unprecedented increase in population growth due to the various policies introduced by government which led to workers’ pay rise and reduced concentration on agriculture. As at this period, Nigerian economy continued to experience an increased rate of inflation. The rate was skyrocketed in in 1988 but fell in 1989. It began to rise again in the year 1990 and had the highest growth rate of 4.3% in 1994 in the annals of Nigeria history. There was a drastic fall in the growth rate of inflation in Nigeria commencing from 1995 and this was maintained till 1999. From the year 2000 to date, growth rate of inflation in Nigeria has been relatively stable having one to two percent fluctuations till the end of the study period.
The U-shaped like curve of growth rate of Gross Capital Formation (which captures the level of domestic investment in the economy) is depicted in the fifth panel. Here, the growth rate of investment is divided into three phases. The first phase describes a continuous fall in the growth rate of gross capital formation from 3.6% in the year 1981 to 1.96% in 1995. The momentum changed in the second phase when it rose and fell moderately between 1997 and 2007. There was an upsurge in the growth rate of investment in the third phase of the curve. Nigerian economy has been experiencing an increased investment growth rate from 2008 till date.
The sixth panel which shows a relatively positive curve depicts the growth rate of Secondary school enrolments in Nigeria between 1986 and 2018. This was basically used to measure the level of human capital in the economy. The continuous upward movement in growth rate of Secondary school enrolments in Nigeria during the study period was not unconnected with population explosion in the country. The fall in the in-growth rate of the variable as depicted in the panel in the years 1991, 1999 and 2010 was as a result of higher morbidity rate over fertility rate during the affected years. The result is partly in line with the main fulcrum of Malthus’ theory which declares population and means of sustenance do not increase at the same rate, such that population increases in geometrical progression and the food supply in the arithmetic sequence, population is likely to elude food supply, creating an imbalance which directly results into overpopulation.
4.3. UNIT ROOT TESTS
The results of unit root tests are reported in Table 3 Since the results revealed that all the variables are stationary either at levels or at first difference but at different levels of significance, it becomes econometrically reasonable to conduct the cointegration test.
Table 3
|
Table 3 Unit Root Tests Results |
||||||
|
Augmented Dickey-Fuller (ADF) Test |
Philips-Perron (PP) Test |
|||||
|
Variables |
Level |
1stDifference |
Status |
Level |
1stDifference |
Status |
|
LGDP |
0.847077 |
-5.593236* |
I
(1) |
0.780021 |
-5.607499* |
I
(1) |
|
LBTR |
-3.168513* |
-0.248508 |
I
(0) |
-1.99593 |
-5.533858* |
I
(1) |
|
LDTR |
-0.241762 |
-1.691480*** |
I
(1) |
-2.303125 |
-2.541952** |
I
(1) |
|
LSER |
2.025809 |
-4.358029* |
I
(1) |
1.612119 |
-4.289108* |
I
(1) |
|
LINV |
-0.021999 |
-5.617715* |
I
(1) |
-0.041946 |
-5.620903* |
I
(1) |
|
LINFL |
-1.290035 |
-6.963094* |
I
(1) |
-1.262546 |
-1.
96035** |
I
(1) |
|
Critical
values |
Level |
1stDifference |
Critical
values |
Level |
1stDifference |
|
|
1% |
-2.628961 |
-2.630762 |
1% |
-2.627238 |
-2.628961 |
|
|
5% |
-1.950117 |
-1.950394 |
5% |
-1.949856 |
-1.950117 |
|
|
10% |
-1.611339 |
-1.611202 |
10% |
-1.611469 |
-1.611339 |
|
|
Source: Author’s computation from the data
extracted from CBN statistical bulletin (2018) and World Bank’s World
Development Indicator (WDI, 2018) |
||||||
Note: * = 1%, ** = 5% and *** = 10% levels of significance
ADF: automatic maximum lag length is based on Akaike Information Criterion (AIC)
PP: automatic maximum lag length is based on Newey-West Bandwidth
4.4. ORDER OF LAG SELECTION
The maximum number of lags was determined using LR test statistic, Final Prediction Error (FPE), Akaike information criterion (AIC), Schwarz information criterion (SC) and Hannan-Quinn information criterion (HQ). The results are presented in Table 4 It was evident that almost all the lag selection criteria produced the same results. The LR, FPE AIC and SC indicated 1 as the optimal lag order. The selection of lag length is therefore based on the outcome of LR, FPE AIC and SC criteria which depict 1 as the optimal lag order. Thus, the lag length of order 1 indicated by SC criterion wan therefore employed in the analysis.
Table 4
|
Table 4 Lag Selection Order Criteria |
|||||
|
Lag |
LogL |
LR |
FPE |
AIC |
SC |
|
0 |
96.62315 |
NA |
8.97e-08 |
-4.874903 |
-4.702525 |
|
1 |
262.4437 |
288.0041* |
3.40e-11* |
-12.76019* |
-11.89831* |
|
Source: Author’s computation from the data
extracted from CBN statistical bulletin (2018) and World Bank’s World
Development Indicator (WDI, 2018) |
|||||
Note
*Indicates lag order selected by the criterion
LR: sequential modified LR test statistic (each test at 5% level)
FPE: Final prediction error
AIC: Akaike information criterion
SC: Schwarz information criterion
HQ: Hannan-Quinn information criterion
4.5. JOHANSEN COINTEGRATION TEST
Following the results in the Table 4 which revealed that all the variables are stationary either at levels or at first difference and at different levels of significance, there is the need to determine the long-run relationship among the variables. To achieve this, Johansen cointegration test was employed to determine the existence of long-run relationship among GDP per capita, birth rate, mortality rate, secondary school enrolments, gross capital formation and inflation ratein Nigeria between 1980 and 2018.
It was evidenced from the Johansen cointegration test results in the Table 5 and Table 6 that the null hypothesis of no cointegration among the variables at 5% level of significance for the model specification was rejected. This implies accepting the alternative hypothesis that population dynamics as measured by fertility and morbidity rates do not affect economic growth in Nigeria. The truce statistics revealed that there are cointegrating relationships among the variables. Similarly, the unrestricted cointegrationMax-Eigenvalue statistic reports that there exist six cointegration equations at 5% level of significance. This implies that the variables have long-run relationship.
Table 5
|
Table 5 Johansen Cointegration Test Results: Unrestricted Cointegration Rank Test (Trace) |
||||
|
Hypothesised
No of CE(s) |
Eigenvalue |
Trace
statistic |
5%
critical value |
Prob** |
|
None
* |
0.868817 |
199.6356 |
95.75366 |
0.0000 |
|
At
most 1 * |
0.806334 |
124.4826 |
69.81889 |
0.0000 |
|
At
most 2 * |
0.501697 |
63.74261 |
47.85613 |
0.0008 |
|
At
most 3 * |
0.343937 |
37.97040 |
29.79707 |
0.0046 |
|
At
most 4 * |
0.319432 |
22.37493 |
15.49471 |
0.0039 |
|
At
most 5 * |
0.197401 |
8.136324 |
3.841466 |
0.0043 |
|
Source: Author’s computation from the data
extracted from CBN statistical bulletin (2018) and World Bank’s World
Development Indicator (WDI, 2018) |
||||
Note:
Trace test indicates 6cointegratingeqn(s) at 5% level of significance
* denotes rejection of the hypothesis at 5% level of significance
**MacKinnon-Haug-Michelis (1999) p-values
Table 6
|
Table 6 Johansen Cointegration Test Results: Unrestricted Cointegration Rank Test (Maximum Eigenvalue) |
||||
|
Hypothesised
No of CE(s) |
Eigenvalue |
Max-Eigen
statistic |
5%
critical value |
Prob** |
|
None
* |
0.868817 |
75.15292 |
40.07757 |
0.0000 |
|
At
most 1 * |
0.806334 |
60.74002 |
33.87687 |
0.0000 |
|
At
most 2 * |
0.501697 |
25.77221 |
27.58434 |
0.0837 |
|
At
most 3 * |
0.343937 |
15.59547 |
21.13162 |
0.2494 |
|
At
most 4 * |
0.319432 |
14.23861 |
14.26460 |
0.0505 |
|
At
most 5 * |
0.197401 |
8.136324 |
3.841466 |
0.0043 |
|
Source: Author’s computation from the
data extracted from CBN statistical bulletin (2018) and World Bank’s World
Development Indicator (WDI, 2018) |
||||
Note:
Max-eigenvalue test indicates 2cointegratingeqn(s) at the 5% level of significance
* denotes rejection of the hypothesis at the 5% level of significance
**MacKinnon-Haug-Michelis (1999) p-values
4.6. VAR GRANGER CAUSALITY TESTS
In this section, causality between population growth and economic growth in Nigeria was investigated by VAR Granger Causality/Block Exogeneity Wald Tests. The cointegration tests conducted in this study showed that there exist at least six cointegration equations at 5% level of significance among the variables. This implies that there exist long-run relationships among the variables included in the estimated VAR models in Nigeria during the study period. The results of the estimated VAR Granger Causality/Block Exogeneity Wald Tests were presented in Table 7
Table 7
|
Table 7 Results of VAR Granger Causality Tests |
|||||||||
|
Independent Variables |
Inferences |
||||||||
|
Dep.
Var. |
LGDP |
LBTR |
LDTR |
LSER |
ECT |
LGDP |
LDTR |
LDTR |
LSER |
|
LGDP |
- |
0.130646 |
5.469184*** |
3.036772 |
20.16189* |
N |
N |
X |
N |
|
LBTR |
0.088914 |
- |
280.2419* |
1.063583 |
100.3191* |
N |
N |
X |
N |
|
LDTR |
3.27841 |
94.37873* |
- |
4.02791 |
344.2296* |
N |
X |
N |
N |
|
LSER |
2.412725 |
8.432166* |
18.51556* |
- |
9.603571 |
N |
X |
X |
N |
|
Source: Author’s computation from the data
extracted from CBN statistical bulletin (2018) and World Bank’s World Development
Indicator (WDI, 2018) |
|||||||||
Note: * = 1%, ** = 5% and *** = 10% levels of significance
X indicates presence of causality.
N indicates absence of causality
The results from the Table 7 showed the presence of causality among the variables used in the study. In the first column of the table, the results revealed that there exists absence of causality among the variables. It can be observed that GDP growth does not Granger-cause birth rate, death rate and secondary school enrolments. Hence, there is no causal relationship between population growth and GDP growth. This implies that there is not any causation from economic growth to the population variables.
The second segment of the table revealed that birth rate Granger-caused death rate at 1% level of significance (LBTR → LDTR). This could be attributable to higher percent of infertility cases which cut across gender. Another noticeable factor for the results may be the tendency toward later marriages and a rise in unmarried cohabitation which are linked to the postponement of parenthood and thus reduced fertility. An increase in the rate of stillbirths and decreased use of contraceptive pills due to fears of side effects have been linked with increased infertility rate which constituted in no small measure to high morbidity rate in Nigeria. Similarly, it was also shown that birth rate Granger-caused secondary school enrolments at 1% level of significance (LBTR → LSER). This is an indication that high fertility rate encourages greater secondary school enrolments which represent the level of human capital in the economy. It was also observed that birth rate does not Granger-cause GDP growth. This is an indication that there is no evidence of causation from fertility rate to economic growth
More so, in the third column of the table, the results of the analysis revealed a unidirectional causality from death rate to GDP growth, birth rate and secondary school enrolments. It was found out that death rate Granger-caused GDP growth; death rate Granger-caused birth rate and death rate Granger-caused secondary school enrolments (LDTR → LGDP; LDTR → LBTR and LDTR → LSER). It was shown that morbidity rate Granger-caused fertility rate at 1% level of significance (LDTR → LBTR). This is a unidirectional causality running from the rate of decrease in population to the number of children per woman in the economy. The implication of this is that death rate in the country significantly affects the number of births per thousand of population. This culminated in the reduction of active labour force participation which hinders output and general productivity. Morbidity rate was equally found to have Granger-caused secondary school enrolments at 1% level of significance (LDTR → LSER). This implies death rate takes toll on secondary school enrolments which represent the level of human capital in the economy. Also, morbidity rate Granger-caused GDP growth at 10% level of significance (LDTR → LGDP). This is an indication that there is an evidence of causation from morbidity rate to economic growth.
The last segment of the table revealed that the absence of causality among the variables. It was shown that secondary school enrolments did not Granger-cause birth rate, death rate and GDP growth. Hence, there is not any causation from secondary school enrolments to other population variables and economic growth. Finally, the results revealed the existence of feedback effects among economic growth, death rate, birth rate and secondary school enrolments.
5. CONCLUSION
The results of VAR Granger Causality/Block Exogeneity Wald Tests revealed the existence of feedback effects among economic growth, death rate, birth rate and secondary school enrolments. The findings of this study showed that population growth and per capita GDP growth are completely independent, and that higher population growth rate did not translate to higher economic growth in Nigeria. It is therefore recommended that Government and the general public should adopt measures to check the crude death rate of Nigeria as it affects economic growth negatively.
CONFLICT OF INTERESTS
None.
ACKNOWLEDGMENTS
None.
REFERENCES
Bloom, D. E. Canning, D. and Fink, G. (2010). Implications of Population Ageing for Economic Growth. Oxford review of economic policy, 26(4), 583-612. https://doi.org/10.1093/oxrep/grq038
Bloom, D. E. Canning, D. and Sevilla, J. (2004). The Effect of Health on Economic Growth : A Production Function Approach. World development 32(1), 1-13. https://doi.org/10.1016/j.worlddev.2003.07.002
Boarnet, M. G. (1994). An Empirical Model of Intra-Metropolitan Population and Employment Growth. Papers in Regional Science, 73(2), 135-152. https://doi.org/10.1111/j.1435-5597.1994.tb00607.x
Brezis, E. S. and Young, W. (2016). Population and Economic Growth: Ancient and Modern. The European Journal of the History of Economic Thought, 23(2), 246-271. https://doi.org/10.1080/09672567.2014.881897
Cai, F. (2018). Population dividend and economic growth in China, 1978-2018. China Economic Journal 11(3), 243-258. https://doi.org/10.1080/17538963.2018.1509529
Chenavaz, R. and Octavio, E. (2015). Population distribution, effective area and economic growth, Applied Economics, 47(53), 5776-5790. https://doi.org/10.1080/00036846.2015.1058907
Drèze, J, and Murthi, M. (2001). Fertility, education, and development : evidence from India. Population and development Review 27(1), (2001), 33-63. https://doi.org/10.1111/j.1728-4457.2001.00033.x
Engle, R. F. and Granger, C. W. J. (1987). Cointegration and Error Correction : Pepresentation, Estimation and Testing, Econometrica, 55(1), 251-276. https://doi.org/10.2307/1913236
Flegg, A. T. (1980). The interaction of fertility and size distribution of income : A comment, 468-472. https://doi.org/10.1080/00220388008421773
Flegg, A. T. (1988). The Demographic Effects of Income Redistribution and Accelerated Economic Growth Revisited.Oxford bulletin of economics and statistics 50(2), 183-194. https://doi.org/10.1111/j.1468-0084.1988.mp50002006.x
Frimpong, P. B. and Adu, G. (2014). Population health and economic growth in Sub-Saharan Africa : a panel cointegration analysis. Journal of African Business, 15(1), 36-48. https://doi.org/10.1080/15228916.2014.881227
Galor, O, and David, N. W. (2000). Population, Technology and Growth : From Malthusian Stagnation to the Demographic Transition and Beyond. American economic review, 90(4), 806-828. https://doi.org/10.1257/aer.90.4.806
Gonzalez, A. (1971). Population Growth and Socio-Economic Development: The Latin American Experience, Journal of Geography, 70(1), 36-46. https://doi.org/10.1080/00221347108981577
Inyang, I. (2003). Population, Environment and Food Provision in Nigeria, International Journal of Environmental Studies, 60(1), 7-17. https://doi.org/10.1080/00207230304750
Lee, B. S. (1990). The Effects of Income Level, Income Distribution, Education and Urbanization on Fertility Rates among 28 Administrative Regions of China.Korea journal of population and development, 91-111. https://pubmed.ncbi.nlm.nih.gov/12283836/
National Population Commission, (2016). Nigerian Population Review (NPC).
Payne, J. E. and Ewing, T. E. (1997). Evidence from lesser developed countries on the Fisher hypothesis : A cointegration analysis. Applied Economics Letters 4(11), 683-687. https://doi.org/10.1080/758530649
Pesaran, M. H. and Shin, Y. (1998). An Autoregressive Distributed Lag Modelling Approach to Cointegration Analysis.Econometric Society Monographs, 31, 371-413. https://doi.org/10.1017/CCOL521633230.011
Phang, H. (2011). Issues and challenges facing population ageing in Korea: productivity, economic growth, and old-age income security, Journal of Comparative Social Welfare, 27(1), 51-62. https://doi.org/10.1080/17486831.2011.532984
Pitchford, J. D. (1968). Population Growth and Economic Development, New Zealand Economic Papers, 2(2), 48-57. https://doi.org/10.1080/00779956809543886
Tai-Hsin, H. and Xie, Z. (2013). Population and Economic Growth: A Simultaneous Equation Perspective, Applied Economics, 45, 3820-3826. https://doi.org/10.1080/00036846.2012.734596
Tai-Hsin, H. and Xie, Z. (2013). Population and Economic Growth: A Simultaneous Equation Perspective. Applied Economics, 45(27), 3820-3826. https://doi.org/10.1080/00036846.2012.734596
Teitelbaum, M. S. (1974). Population and development: is a consensus possible?. Foreign Affairs 52(4), 742-760. https://doi.org/10.2307/20038085
Wolfe, B. L. Behrman, J. R. and Blau, D. M. (1982). The Impact of Demographic Changes on Income Distribution in a Developing Country. Journal of Development Economics 11(3), 355-377. https://doi.org/10.1016/0304-3878(82)90011-6
World Bank, (2015). World Fertility Pattern, Data Booklet.
Yujie, L. (2017). The Relationship between Fertility Rate and Economic Growth in Developing Countries School of Economics and Management Repository, Lund University, 122-143.
 This work is licensed under a: Creative Commons Attribution 4.0 International License
© Granthaalayah 2014-2022. All Rights Reserved.