
RESEARCH PAPER ON FINANCIAL DATA ANALYSIS AND TECHNICAL RESEARCH
Uday Zawar 1![]() ,
Dr. Bhojraj Shewale 2, Dr.
Bhawana Sharma 3
,
Dr. Bhojraj Shewale 2, Dr.
Bhawana Sharma 3
1 Assistant
Junior Data Analyst, BBA 3rd Year, Banking and Finance, Amity Business School,
Amity University Mumbai, Mumbai, India
2 Associate
Professor Amity Business School, Amity University Mumbai, Mumbai, India
3 Professor, Director-International Affairs and Programs, Officiating HOI, Amity Business School, Amity University Mumbai, Mumbai, India
|
|
|
ABSTRACT |
|
|
This research paper examines financial data analysis and technical research conducted during an internship at Opti Pro Trade Financial Services. It discusses how data-driven decision-making and analytical methods impact financial markets. The study combines theoretical knowledge with practical experience in market trends, investment decisions, and technical indicators. A case study
on Reliance Industries Ltd. (RIL) demonstrates the use of technical tools
like Moving Average Convergence Divergence (MACD), Relative Strength Index
(RSI), and Simple Moving Averages (SMA) to pinpoint potential investment
opportunities. The results show that using multiple indicators can greatly
improve the accuracy of market predictions and decrease risk. The paper also
looks at the challenges faced during financial research and ends with a
discussion on the importance of ongoing learning in financial analytics. |
|||
|
Received 07 December 2024 Accepted 08 January 2025 Published 28 February 2025 DOI 10.29121/granthaalayah.v13.i2.2025.6476 Funding: This research
received no specific grant from any funding agency in the public, commercial,
or not-for-profit sectors. Copyright: © 2025 The
Author(s). This work is licensed under a Creative Commons
Attribution 4.0 International License. With the
license CC-BY, authors retain the copyright, allowing anyone to download,
reuse, re-print, modify, distribute, and/or copy their contribution. The work
must be properly attributed to its author.
|
|||
|
Keywords: Research Paper, Financial Data Analysis, Technical Research |
|||
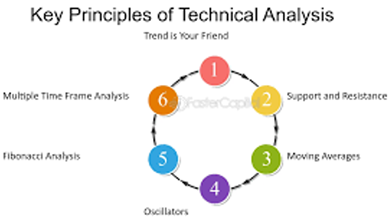
1. INTRODUCTION
In today’s fast-changing financial world, understanding and interpreting market data is vital for making sound investment choices. The growth of financial technologies, such as algorithmic trading and data analytics, has changed traditional market research methods. Financial data analysis helps professionals make sense of complex datasets, spot patterns, and forecast trends using both qualitative and quantitative information.
This research is based on practical experiences gained during an internship at Opti Pro Trade Financial Services, a firm focused on investment research and technical analysis. The internship aimed to connect academic finance theories with real-world practice. It offered hands-on experience with trading platforms, research methods, and financial services for clients.
The importance of this research lies in showing how financial analytics tools can aid market forecasting and risk management. The findings help clarify how data science techniques fit into financial advisory services, highlighting how students can use internship experiences to develop their professional skills.
2. OBJECTIVES
The research was guided by these key objectives:
· To apply the principles of technical analysis to real-time stock market conditions.
· To understand the link between market indicators and price movement in financial securities.

· To assess financial instruments using technical indicators like RSI, MACD, and Moving Averages.
· To conduct a detailed case study on Reliance Industries Ltd. (RIL) for short-term trend analysis.

These objectives align with the broader goal of preparing students for future roles in finance, investment research, and data analytics, where strong analytical skills and accuracy are crucial.
3. METHODOLOGY
The research uses an observational and analytical approach that blends qualitative understanding with quantitative financial data analysis.
1) Data
Collection
Data was mainly gathered from secondary sources, including:
· National Stock Exchange (NSE) historical data,
· Real-time trading platforms and dashboards,
· Published financial reports, and
· Online databases such as Investing.com and TradingView.
2) Tools
and Techniques
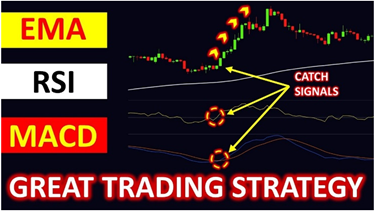
The study involved examining technical indicators and market charts to identify price trends:
· Moving Average Convergence Divergence (MACD): to track momentum and trend changes.
· Relative Strength Index (RSI): to evaluate overbought or oversold market conditions.
· Simple Moving Averages (SMA): to analyze short-term and long-term market trends.
3) Analytical
Framework
The research combined chart visualization with indicator interpretation. The steps included:
· Collecting data on RIL’s daily price movements.
· Plotting 50-day and 200-day moving averages to spot crossover signals.
· Using RSI and MACD to confirm market momentum.
· Combining indicator results to create short-term investment insights.
4. CASE STUDY: RELIANCE INDUSTRIES LTD. (RIL)
1) Background
Reliance Industries Ltd. (RIL) is India’s largest private company, working in energy, retail, and telecommunications. Due to its strong liquidity and market value, it is a good choice for technical analysis.
2) Analysis
Process
The study looked at RIL’s daily stock prices over a two-month period in 2025 using these indicators:
Simple Moving Averages (SMA):
A 50-day SMA and a 200-day SMA were used to find long-term and short-term price trends.
A “Golden Cross” occurs when the 50-day SMA crosses above the 200-day SMA. This signals bullish momentum and suggests a buying opportunity.

Relative Strength Index (RSI):
RSI values between 30 and 70 were tracked to gauge market sentiment.
A reading above 70 showed overbought conditions, signaling a possible short-term correction.
Values below 30 indicated oversold conditions, which presented buying opportunities.

Moving Average Convergence Divergence (MACD):
The MACD line crossing above the signal line confirmed upward momentum.
Divergence patterns indicated possible reversal points.

3) Findings
of the Case Study
The Golden Cross pattern confirmed a bullish market phase and matched positive investor sentiment.
RSI readings between 68 and 72 suggested the market was close to being overbought, recommending cautious short-term positions.
The MACD histogram showed consistent upward momentum with minor corrections.
The combined analysis indicated that RIL’s stock was in a growth phase but nearing a consolidation point. This shows that using technical tools together can improve forecasting accuracy.
5. Data Analysis And Interpretation
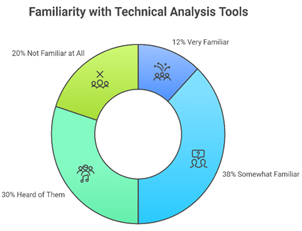
1) How
familiar are you with technical analysis tools (e.g., RSI, MACD, Moving
Averages)?
· Very familiar- 12%
· Somewhat familiar- 38%
· Heard of them but never used- 30%
· Not familiar at all- 20%
Interpretation
· Only 12% of respondents are very familiar with technical tools like RSI, MACD, and Moving Averages.
· The majority (38%) are somewhat familiar, while 30% have heard of them but never used.
· 20% are not familiar at all, showing that technical literacy in financial tools still needs improvement.
Hence: There is growing awareness of analytical tools, but more hands-on training is needed to build confidence and expertise.
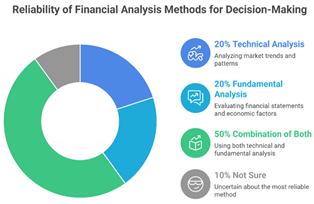
2) Which
financial analysis method do you find more reliable for decision-making?
· Technical Analysis – 20%
· Fundamental Analysis- 20%
· Combination of both- 50%
· Not sure- 10%
Interpretation
· Half the respondents (50%) prefer using a combination of both technical and fundamental analysis for decision-making.
· Only 20% rely solely on technical analysis, and another 20% on fundamental analysis.
· 10% are not sure, reflecting indecision or lack of exposure.
Hence: Investors recognize that integrating both methods provides a balanced and reliable approach to market evaluation.
3) How
often do you track or analyze stock market data?
· Daily- 60%
· Weekly- 10%
· Occasionally- 20%
· Rarely-10%

Interpretation
· A majority (60%) track or analyze stock data daily, while 20% do so occasionally.
· Only 10% analyze weekly or rarely.
Hence: This indicates high engagement among participants, showing enthusiasm and active participation in market monitoring.
4) What
challenges do you face while interpreting financial or market data?
· Lack of knowledge about indicators- 30%
· Difficulty understanding charts- 37%
· Time constraints- 15%
· Inconsistent market trends.- 18%

Interpretation
· The most common issue is difficulty understanding charts (37%), followed by lack of knowledge about indicators (30%).
· Time constraints (15%) and inconsistent market trends (18%) are also notable challenges.
Hence: While interest in financial analysis is strong, practical interpretation and technical understanding remain areas for development.
5) Which
data visualization tool or platform do you use/prefer for analysis?
· MS Excel / Google Sheets- 8%
· TradingView- 75%
· Screener- 15%
· Others-2%
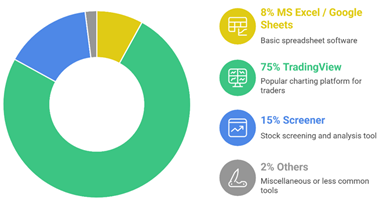
Interpretation
· A large majority (75%) use TradingView for market analysis.
· 15% use Screener, 8% rely on MS Excel/Google Sheets, and 2% use other tools.
Hence: TradingView dominates as the preferred platform, likely due to its user-friendly interface and real-time charting capabilities
6) How
confident are you in drawing conclusions from technical indicators?
· Highly confident - 12%
· Moderately confident- 35%
· Slightly confident- 30%
· Notconfident-23%
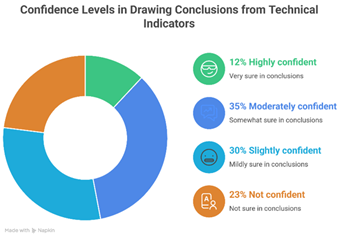
Interpretation
· Only 12% feel highly confident, and 35% are moderately confident.
· 30% are slightly confident, while 23% are not confident.
Hence: Confidence levels are moderate, highlighting a need for more practical exposure and guided training in interpreting technical indicators
7) Do
you believe that learning financial data analysis improves investment
decision-making?
· Strongly agree- 40%
· Agree- 30%
· Neutral- 25%
· Disagree-5%

Interpretation
· A combined 70% (40% strongly agree + 30% agree) believe financial data analysis improves investment decisions.
· 25% remain neutral, and only 5% disagree
Hence: There is strong consensus that financial data analytics positively impacts investment performance, reinforcing its value in modern finance education
6. FINDINGS AND DISCUSSION
The analysis and internship experience led to several
key findings:
Practical Application of Theoretical Concepts
Financial theories, like the efficient market hypothesis and behavioral finance, closely match real-time observations.
Integration of Multiple Indicators Improves Accuracy:
Using two or more indicators together, such as RSI, MACD, and SMA, helps reduce false signals.
Data Interpretation Requires Contextual Understanding:
Raw data does not provide insights unless framed with market news, global events, and company performance.
Importance of Real-Time Decision-Making:
Markets change quickly, which requires analysts to balance speed and accuracy when interpreting data.
Development of Professional Skills:
The internship improved skills in analytical thinking, data organization, teamwork, and report writing, all crucial in finance.
7. SWOT ANALYSIS
|
Strengths |
Weaknesses |
|
Analytical mindset and
quick learning of financial tools. |
Limited exposure to
advanced quantitative trading models. |
|
Strong communication and
problem-solving ability. |
Initial difficulty
interpreting complex chart structures. |
|
Opportunities |
Threats |
|
Expanding demand for
financial data analysts and fintech professionals. |
Rapid technological
advancements require continuous
upskilling. |
|
Potential for career
advancement in financial research and investment advisory. |
High competition and
market volatility can limit short-term employment stability. |
The SWOT framework revealed that the internship significantly strengthened the researcher’s technical foundation while identifying future learning areas.
8. CHALLENGES FACED
Several challenges arose during the research and internship:
Complexity of Technical Tools:
At first, understanding dynamic indicators like MACD and RSI was hard without practical experience.
Data Overload:
The huge amount of market data needed careful handling and filtering for useful insights.
Time Management:
Finishing analytical reports on time required strong organizational skills.
Market Volatility:
Sudden market changes impacted the consistency of findings, requiring flexible analysis. Overcoming these challenges built analytical skills and professional resilience, boosting confidence in uncertain financial situations.
9. CONCLUSION
The research concludes that financial data analysis and technical research are essential in today’s financial world. The internship at Opti Pro Trade Financial Services offered great experience connecting academic concepts to real-world practice.
The RIL case study showed that technical indicators are effective tools for identifying trends, optimizing investment timing, and managing market risks. Furthermore, the study highlighted that success in financial analytics relies not just on technical skills but also on critical thinking, adaptability, and a deep understanding of market psychology.
This research encourages future finance students to seek internships that provide real-world exposure, as such experiences enhance analytical skills and prepare them for competitive financial environments.
Survey Conclusion:
The survey clearly shows that while participants are aware of and interested in technical analysis, practical knowledge and confidence remain moderate. Most respondents rely on a hybrid approach—combining technical and fundamental analysis—for accurate decision-making.
High daily engagement with market data suggests an active learning mindset, but difficulties with chart interpretation and indicator understanding point to the need for structured training and exposure to live market tools.
Platforms like TradingView have become central to analysis habits, showing a shift toward technologically advanced methods. Moreover, the strong agreement that learning financial data analysis improves investment outcomes emphasizes that data literacy and technical competency are becoming essential skills in the financial sector.
Overall Conclusion:
To build a generation of skilled financial analysts, institutions and internships should focus on practical training, tool-based workshops, and case study learning that bridge the gap between theoretical knowledge and real-world application
CONFLICT OF INTERESTS
None.
ACKNOWLEDGMENTS
None.
REFERENCES
Money
Control: https://www.moneycontrol.com/
National
Stock Exchange of India (NSE), Historical Stock Data, [Online]. Available: https://www.nseindia.com
Opti Pro
Trade Financial Services, Internal Market Research Reports, 2025.
Screener: https://www.screener.in/
TradingView: https://www.tradingview.com/
 This work is licensed under a: Creative Commons Attribution 4.0 International License
© Granthaalayah 2014-2025. All Rights Reserved.

