Scenario Analysis of Wholesale and Retail Trade in Bangladesh: An Empirical Evidence
Meher Neger 1![]()
![]()
1 Professor,
Department of Marketing, Comilla University, Kotbari, Cumilla, Bangladesh
|
|
|
ABSTRACT |
|
|
Wholesale and
retail trade is considered as one of the essential activities contributing to
the domestic product, labour force and linkage between producers and
consumers. The main objective of the study is to assess the status of input
cost, gross output, gross value added of wholesale and retail trade in
Bangladesh during the period of COVID-19 pandemic and also compare the
volatility between wholesale and retail trade. The secondary data of
wholesale and retail trade survey-2021 with 15,258 establishment have been
collected from Bangladesh Bureau of Statistics (BBS). Both the quantitative
and qualitative methods were applied in this study. Scenario analysis was
employed to find the current status of input cost, gross output, gross value
added of wholesale and retail trade in Bangladesh. The study reveals that
industrial cost was increased due to several constraints, including market
issues, high labour costs, transportation issues, and logistical
shortcomings. The findings of the volatility between wholesale and retail
trade represent that retail businesses have more flexibility in expenses,
while wholesale enterprises often have more output and value added. Finally,
it has been found that gross output significantly depends on gross value
addition, whereas COVID-19 affects all scenarios. The findings of this study
would be helpful for the planners and policy makers of the trade sectors to
take appropriate policies regarding wholesale and retail trade in Bangladesh. |
|||
|
Received 17 July
2024 Accepted 20 August 2024 Published 17 September 2024 Corresponding Author Meher
Neger, medha0604@yahoo.com DOI 10.29121/granthaalayah.v12.i8.2024.5763 Funding: This research
received no specific grant from any funding agency in the public, commercial,
or not-for-profit sectors. Copyright: © 2024 The
Author(s). This work is licensed under a Creative Commons
Attribution 4.0 International License. With the
license CC-BY, authors retain the copyright, allowing anyone to download,
reuse, re-print, modify, distribute, and/or copy their contribution. The work
must be properly attributed to its author.
|
|||
|
Keywords: COVID-19, Establishment, Gross Output,
Gross Value Added, Trade |
|||
1. INTRODUCTION
The term retail trade is a buyer to customer (B2C) marketing strategy used for selling goods to customers. Another term wholesale trade is business where bulk goods are sold to other companies at a reduced price. Here (B2B) marketing strategy used for selling goods business to business. Wholesale and retail trade services are vital to the efficient and effective flow of goods from business to business and producer to customer. Here, wholesalers act as marketing intermediaries that neither produce nor consume the finished product, but instead sell of goods and commodities to the retailers or the businesses or organization users. While retail trade is the business activity associated with the sale of goods to the final consumer or the ultimate customer. It is the link between wholesalers or manufacturers and the customers of the product.
The study has been considered 19 (nineteen) major sectors to appraise the gross domestic product (GDP) in national accounts. The Wholesale and Retail Trade sector is one of the major sectors which directly contribute in our national economy. The share of retail and wholesale trade in gross domestic product (GDP) now stands at the third highest at 14 percent after the industry and agriculture sector. So, those are gradually becoming the main driver of the economy with their growing contribution to GDP.
The Bangladesh Bureau of Statistics had been conducted the survey based on Wholesale and Retail Trade in 1992-93, 1993-94, 1995-96, 1997-97 and 2002-03 under the integrated program. The last Wholesale and Retail Trade Survey was conducted on 2020. Wholesale and Retail Trade data was required for national accounting for compiling the GDP of Bangladesh and formulating different national policies and administration purposes. The conception of wholesale and retail trade is based on the activity primary relating to the sale of goods and commodities and repair services (motor vehicles and motorcycles, auto- rickshaws and rickshaws) also incorporated here as a permanent establishment. However, based on mentioned surveys around 65 to 75 per cent of all wholesale and retail traders in Bangladesh have been suffering from poor business due to a lack of customers, economic crisis and complications of COVID-19 during the height pandemic in 2020.
During December 2019 corona virus disease (COVID-19) was detected firstly in Wuhan, China. Later it has been spread out Worldwide tremendously and the World Health Organization (WHO) has declared it as a pandemic. The COVID-19 outbreak isn’t only a health crisis but also invading our societies and economies in different nature and it varied from society to society, country to country as well. Due to the COVID-19 pandemic world trade and commerce, education, and other activities have been interrupted. The global supply chain has been broken down for countries lockdown situations. At that time, trade and commerce institutions of Bangladesh has been suffering parallelly by this outbreak. trade and commerce institutions of Bangladesh have to face tremendous losses. However, the COVID-19 pandemic may be changing the trends in the retail and wholesale sector and affecting the labor force of the retail and wholesale sector. In order to gain evidence on the impact that COVID-19 has had on the employment of men and women in the retail sales sector in Bangladesh, the International Labor Organization (ILO), in collaboration with the Asian Development Bank (ADB), commissioned.
The major objective of this study is to find out the scenario of wholesale and retail trade in Bangladesh. The specific objectives of this research are to evaluate the current status of input cost, gross output, gross value added of wholesale and retail trade in Bangladesh; to determine the impact of Covid-19 on input cost, gross value added and employee’s status of wholesale and retail trade in Bangladesh; and to give policy options for future potentiality of wholesale and retail trade in Bangladesh.
There are several segments of the research paper. Initially, the statement of the problem and literature review are provided based on a past study. Then, researcher methodologies that are applied to the current research are described. After that, the paper is presented with the results and interpretations. Next, the discussions, conclusion, and implications sections incorporate the consequences of the present research and its linkups with the previous studies. At the end of the segment, the shortcomings and potential directions of the research are stated.
2. Problem Statement
The COVID-19 pandemic has had a significant impact on the Bangladesh Retail and Wholesale Market owing to the lockdown and restrictions imposed on travel and movement. It led to a decrease in demand for many products, resulting in a decline in sales and revenue. Many retailers have been forced to close their businesses temporarily, while others had to reduce staff and working hours. Consequently, the situation has also led to high prices of some goods as suppliers take advantage of the reduced demand. Of the 18.87 lakh wholesale establishments, 22.93 per cent suffered from a lack of customers, 17.81 per cent were affected by the economic crisis and 33.66 per cent were directly impacted by the pandemic. Moreover, the situation is challenging for the Bangladesh Retail and Wholesale Industry.
The little study was done in individual level to find the scenario of retail and wholesale trade in micro level. But, so far, no in-depth research has been published to find the impact and magnitude of COVID-19 on cost, gross output, and gross value addition in wholesale and retail sector in Bangladesh. This study may be one of the first initiatives at this regard.
3. Relevant Literature Review
A literature review is an overview of the previously published works on the related topics. It may also include a discussion of methodological issues and suggestions for future research. The review of related literature gives the researcher an understanding of the research methodology, which refers to the way; the study is to be conducted. It helps the researcher to know about the tools and instruments which proved to be useful and promoting in the previous study. It also provides insight in to the statistical methods through which validity of result is to be established.
D’Acquisto et al. (2015) found that the indicate dynamics at play in network providers and content providers, pricing strategies when coping with various content kinds (free and pay-per-use). With the possibility for collusion in non-neutral circumstances that may not be in the best interests of consumers, the decisions made by these providers can have a variety of implications on their revenues and the retail prices that consumers can pay. Then, Kuzman et al. (2017) found that a thriving wholesale market is an indicator of national, regional, and city determination to meet the interests of lessors, buyers, consumers, and the city itself. The construction of wholesale markets represents a move toward modern infrastructure centers with a wide range of benefits for economic and other institutions.
Next, Arci et al. (2018) to efficiently operate an electricity market, accurate short-term forecasts of wholesale electricity prices and demand are essential. These forecasts influence decisions related to unit commitment, security assessment, operational costs and system security. Then, Hassani & Dost (2020) the research underscores the multifaceted impact of covid-19 on the global economy, with significant repercussions for international trade, GDP growth, labor income, and China’s pivotal role in global trade. These findings highlight the interconnectedness of the global economy and the importance of understanding the ripple effects of a global crisis like the covid-19 pandemic.
Then, Hameli (2018), the retail sector serves as a bridge between producers and consumers, with retailers playing a crucial role in product distribution. Retailing has evolved over time, and it can be broadly categorized into in-store retailing and non-store retailing. In addition, to the classification methods mentioned above, the paper briefly touches on shopping malls, which are collections of retail businesses organized as a unit in planned and managed locations. Overall, the retail sector is a diverse and dynamic part of the economy, offering a wide range of business types and serving the needs of customers through various channels.
After that, Alam (2020) mentioned that, retailing in Bangladesh is undergoing significant changes with the risk of supermarkets, e-commerce growth, and multichannel adoption. These Shifts align with established retail change theories, placing the country in the fourth wave of retail development. Given its economic significance, it is crucial for stakeholders and policymakers to closely monitor and adapt to these evolving trends for sustainable sector growth.
Therefore, Nithya & Chirputkar (2020), the research underscores the multifaceted impact of covid-19 on the global economy, with significant repercussions for international trade, GDP growth, labor income, and China pivotal role in global trade. These findings highlight the interconnectedness of the global economy and the importance of understanding the ripple effects of a global crisis like the COVID-19 pandemic. Further, Hoque et al. (2020) proposed a conceptual model for evaluating highlights how the COVID-19 pandemic has had profound and lasting consequences on the tourism sector in China, affecting not only domestic tourism but also international tourism and the broader economy. the study underscores the need for strategies to revive and adapt the tourism industry in the post-pandemic era.
After that, Okolo (2021) mentioned that the determinants of new firms entering the Swedish retail and wholesale trade markets. The findings suggest that incumbent firms engage in strategic behavior to hinder nor entrants. Factors such as high profits, absence of a single dominant incumbent, and regional characteristics play crucial roles in entry behavior. Interestingly, despite a recession, there’s a notable increase in the number of firms, suggesting they may be adapting to market changes through mechanisms like capital and labor investments.
After reviewed some related literatures, it is clear that the previous researchers have been tried to focus the situations of retail and wholesale trade in micro level, but this research has been tried to mentioned the same area in macro level based on authentic data and information.
4. Methodology of the Study
This section provides detail description of the data sources, study population, descriptive statistics, methods of economic investigation and methods of multivariate and 3SLS.
4.1. Sources of Data
The secondary data of Wholesale and Retail Trade Survey 2021 need to be collected to achieve the objectives from Bangladesh Bureau of Statistics (BBS). Here, those data are more organized and well decorated.
4.1.1. Sample Design
The probability stratified random sampling procedures were used to draw the samples from the target population in the Wholesale and Retail Trade Survey 2021. The survey was conducted based on Economic Census 2013, Business Directory 2019 and Sample list frame. Stratification was done based on the persons employed and number by BSIC (Bangladesh Standard Industrial Classification) at 4-digit level. Based on Economic Census 2013, a list of wholesale and retail trade establishments was prepared and updated. The Business Directory 2019 comprised 10 or more total person engaged of all establishments in the country from where using only wholesale and retail trade establishments' part irrespective of manpower engaged.
4.1.2. Study Population of BBS Data
The 2021 BBS survey is conducted as part of the study. The sample size was determined as 15,800 permanent wholesale and retail trade establishments for the final survey.
4.1.3. Study Population and Sample Size of the Study
Primarily in BBS 2021 data, study population consists of 15800. This study found that some variables consist of missing cases. After removing all missing cases of selected variables, the study population consists of 15258 samples.
4.2. Descriptive Statistics
The state of wholesale and retail commerce in Bangladesh has been assessed using descriptive statistics. In this study, mean, standard deviation, standard error, and coefficient of variation were employed. Tabular presentations (frequency, percentage), graphical presentations (pie chart, bar chart), and these measurements were also used to express the people of establishment. For exploring the current scenario arithmetic mean, standard deviation, coefficient of variation, standard error are used.
4.3. Methods of Economic Investigation
4.3.1. Cost
The cost of something is the amount of money that is needed in order to buy, do, or make it. Cost has been calculated by using formula. Such as, TC (total cost) = TFC (total fixed cost) + TVC (total variable cost).
4.3.2. Gross Output
Gross output is the measure of total economic activity in the production of new goods and services in an accounting period. It can be measured by formula. Gross value of output=Value of the total sales of goods and services + Value of changes in the inventories. The sum of net value added in various economic activities is known as GDP at factor cost.
4.3.3. Gross Value Added
GVA is the output of the country less the intermediate consumption, which is the difference between gross output and net output. To calculate the Gross Value Added we can use formula:
GVA=GDP+SP−TP. Here, SP= Subsidies on Products and TP= Taxes on Products.
4.4. Computational Software and Paper Writing
This research paper is written by using Microsoft Word-13. In this study, the entire analysis is done by using STATA and Excel-13 is used for analysis. This software’s are used to construct frequency table and bivariate analysis.
5. Results and Discussions
5.1. Profile of the samples
Wholesale and Retail trade has a direct effect on economics. Table 1 summarizes the frequency distribution of the type of sample business and also indicates that the 26.37% establishments are engaged in wholesale business, 63.96% establishments are engaged with retail and 9.67% are engaged with sale and repair of motor car and motor cycles.
Table 1
|
Table 1 Frequency Distribution on Different Types of Establishments |
||
|
Type of Business |
Number of Establishments |
|
|
Number |
(%) |
|
|
Wholesale |
4,023 |
26.37 |
|
Retail |
9,759 |
63.96 |
|
Sale and Repair of Motor Car and Motor Cycle |
1,475 |
9.67 |
|
Total |
15,257 |
100 |
|
Source Field Survey |
||
Figure 1

|
Figure 1 Distribution of the Types of Establishments in Percentage |
From Table 2, it is found that 0.33% ownership is governmental, while 99.25% ownership is private and 0.1% is private ownership. This study found that 0.24% is local and foreign type, 0.09% belongs to fully foreign.
Table 2
|
Table 2 Frequency Distribution on Types of Ownership |
||
|
Types of ownership |
Number |
(%) |
|
Government |
50 |
0.33 |
|
Private |
15144 |
99.25 |
|
Private ownership |
15 |
0.1 |
|
Local and Foreign |
36 |
0.24 |
|
Fully Foreign |
13 |
0.09 |
|
Total |
15258 |
100 |
|
Source Field Investigation |
||
In Table 3, the individual establishment reported that individual highest percentages 92.69% had risk of COVID-19 and 7.31% had no risk of COVID-19.
Table 3
|
Table 3 Frequency Distribution on the Perception About COVID-19 |
||
|
Perception about COVID-19 |
Number |
(%) |
|
No Risk |
1,116 |
7.31 |
|
Risk |
14,142 |
92.69 |
|
Total |
15,258 |
100 |
|
Source Field Investigation |
|
|
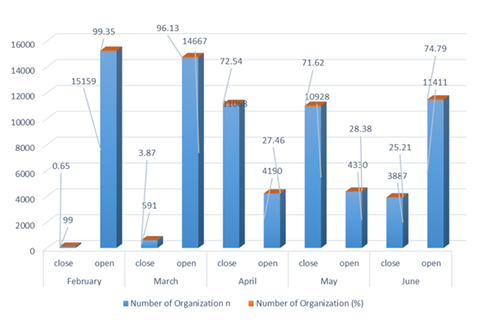
Table 4 presents that, in February 2020, 15,159 out of 15,258 establishments were operational at the start of the corona crisis. Gradually, when the impact of covid-19 increased in March and April, most of the establishments closed due to the lockdown.
Table 4
|
Table 4 Frequency Distribution on Opened and Closed Establishments During COVID-19 |
|||
|
Months |
opened and closed establishments |
||
|
Number |
(%) |
||
|
February |
Closed |
99 |
0.65 |
|
Opened |
15159 |
99.35 |
|
|
March |
Closed |
591 |
3.87 |
|
Opened |
14667 |
96.13 |
|
|
April |
Closed |
11068 |
72.54 |
|
Opened |
4190 |
27.46 |
|
|
May |
Closed |
10928 |
71.62 |
|
Opened |
4330 |
28.38 |
|
|
June |
Closed |
3887 |
25.21 |
|
Opened |
11411 |
74.79 |
|
|
Source Field Survey |
|||
In March 14,667 establishments remained open but in April 4190 remained open and 11,068 establishments were almost closed. The number of establishments closed in May stood 10928 and only 411 were opened. In June, the lockdown began to relax slightly and institutions gradually opened. In June, the number of open establishments is 11,411 and 3,847 establishments remain closed. In short, the wholesale and retail business are facing the problem of solvability to the effect of COVID-19.
Figure 2
|
Figure 2 Distribution of Opened and Closed Establishments in Percentage |
5.2. Scenario analysis of wholesale and retail trade
Table 5 indicates that mean of sectors of operating expenses are found highest for rent expenditure (328502.5) and lowest for capital expenditure (7347.662). Here, the higher the coefficient of variation is for rent expenditure (20.12), the lowest coefficient of variation is for communication expenditure (7.52). The lowest coefficient of variation (7.52) means, the expenditure is running with more stability and consistency. From the table we can comment that the higher the coefficient of variation, the greater the level of dispersion around the mean.
Table 5
|
Table 5 Scenario Analysis on Sectors of Operating Expenses |
|||||
|
Sectors of operating
Expenses |
Mean |
Variance (in million) |
Standard deviation |
Correlation of var. |
Standard Error |
|
Rent expenditure |
328502.5 |
4370000 |
6609904 |
20.12132 |
53511.41 |
|
Capital expenditure |
7347.662 |
1630 |
127835 |
17.39805 |
1034.906 |
|
Transport expenditure |
87725.38 |
54100 |
735713.9 |
8.386557 |
5956.075 |
|
Repair expenditure |
27932.78 |
7720 |
277763.7 |
9.944004 |
2248.675 |
|
Communication
expenditure |
8995.382 |
458 |
67667.38 |
7.522458 |
547.8108 |
|
Fuel expenditure |
98423.34 |
112000 |
1057606 |
10.74548 |
8561.995 |
Table 6
|
Table 6 Scenario Analysis on the Types of Business by Capital Lack |
||||||||
|
Type of business |
Sum. Stat. a |
Gross output |
Gross value added |
Cost |
Non industrial cost |
Value added fixed cost |
Total employee |
Wages and salaries |
|
Wholesale |
Mean SD SE CV |
8.08x10⁷ 1.71 x10⁹ 3.69 x10⁷ 21.18802 |
7607791 1.19 x10⁸ 2560451 15.62362 |
7.32 x10⁸ 1.69 x10⁹ 3.65 x10⁷ 23.13348 |
315031.4 2502681 53911.55 7.944226 |
7292759 1.19 x10⁸ 2557433 16.27931 |
10.67749 25.53923 0.5501538 2.391874 |
1995291 1.54 x10⁸ 331940.4 7.722845 |
|
Retail |
Mean SD SE CV |
2.58 x10⁸ 1.10 x10⁸ 1646004 4.280977 |
4251753 3.35 x10⁷ 499110.7 7.87647 |
2.15 x10⁸ 9.80 x10⁷ 1460679 4.548624 |
372088.9 3606783 53754.8 9.693337 |
3879664 3.28 x10⁷ 489340.9 8.462918 |
7.471568 36.91094 0.5501135 4.940186 |
958586.5 4016697 59864.09 4.190229 |
|
Sale and Repair |
Mean SD SE CV |
3.26 x10⁷ 9.75 x10⁷ 3743849 2.989319 |
6154287 6.96 x10⁷ 2674676 11.3164 |
2.65 x10⁷ 6.17 x10⁷ 2370810 2.333349 |
162065.4 1289215 49512.02 7.954907 |
5992221 6.96 x10⁷ 2672257 11.61195 |
6.743363 13.25354 0.5089992 1.96542 |
942697.2 3240305 124443.2 3.43727 |
|
Total |
Mean SD SE CV |
4.26 x10⁷ 9.33 x10⁸ 1.09 x10⁷ 21.90242 |
5413604 7.27 x10⁷ 849050.8 13.4322 |
3.72 x10⁸ 9.22 x10⁸ 1.08 x10⁷ 24.78767 |
335912.4 3159192 36887.22 9.404809 |
5077692 7.25 x10⁷ 846062.1 14.27039 |
8.346149 32.34539 0.3776699 3.875487 |
1261698 8990729 104977.2 7.125893 |
|
Sum.
Stat. Summary Statistics |
||||||||
From the Table 6 we found that, when there is lack of capital in Wholesale, Retail and Sales and Repair the highest mean value of Gross Output is in Wholesale business and the highest Correlation of Variation is in wholesale business. From the Table 6 we also found that, the highest mean value of Gross value added is in Wholesale and the highest CV is in wholesale business. The highest mean value of cost is in wholesale business and highest correlation of variation is in wholesale business. The highest mean value of non-industrial cost is in retail business and the highest value of CV is in retail business. The highest mean value of value-added fixed cost is in wholesale business and highest correlation of variation is in wholesale business. The highest mean value of total employee is in wholesale business and highest correlation of variation is in retail business. The highest mean value of wages and salaries is in wholesale business and highest correlation of variation is also in wholesale business.
In conclusion, these statistics give an overview of the characteristics and financial performance of various business kinds depending on their capital resources. Retail businesses have more flexibility in expenses, while wholesale enterprises often have more output and value added. Businesses that are involved in sales and repairs fall between these two groups, and the aggregate average values offer a complete picture of these companies as a whole. Business analysts, politicians, and investors that want to comprehend the economic environment of various sectors can benefit from these.
Table 7
|
Table 7 Scenario Analysis on the Types of Business by no Lack of Customer |
||||||||
|
Type of business |
Sum. Stat. a |
Gross output |
Gross value added |
Cost |
Non industrial cost |
Value added fixed cost |
Total employee |
Wages and salaries |
|
Wholesale |
Mean SD SE CV |
3.64x10⁷ 1.11x10⁷ 26827063.056493 |
4880314 3.20x10⁷ 771887 6.56521 |
3.16x10⁷ 9.57x10⁷ 2305642 3.033202 |
247543.7 2347810 56561.42 9.484427 |
4632770 3.17x10⁷ 764493.5 6.849764 |
11.46489 32.00128 0.770947 2.791242 |
2181947 1.69x10⁷ 406475.2 7.732723 |
|
Retail |
Mean SD SE CV |
2.18x10⁷ 1.12x10⁷ 1884668 5.148547 |
2372245 4.80 x10⁷ 807533.5 20.24217 |
1.94 x10⁷ 1.08 x10⁷ 1819942 5.579827 |
208345.7 2172284 36530.91 10.42635 |
2163900 4.78 x10⁷ 804262 22.10124 |
30.03874 1412.925 23.76091 47.03675 |
792637.1 4070936 68460.21 5.13594 |
|
Sale and Repair |
Mean SD SE CV |
1.55x10⁷ 4.56 x10⁷ 1842550 2.939387 |
1916994 8339587 337107.8 4.350347 |
1.36x10⁷ 4.14 x10⁷ 1672345 3.044177 |
133377.5 1346024 54409.8 10.09184 |
1783616 7991267 323027.8 4.480374 |
5.28268 13.1195 0.530324 2.483493 |
699236.1 3287579 132892.5 4.701672 |
|
Total |
Mean SD SE CV |
2.54x10⁷ 1.07 x10⁷ 1397831 4.213625 |
3060848 4.12 x10⁷ 537855.1 13.46417 |
2.24 x10⁷ 9.98 x10⁷ 1302248 4.462909 |
212034.6 2156013 28138.14 10.16821 |
2848814 4.10 x10⁷ 535057.7 14.39105 |
22.00715 1096.656 14.31246 49.8318 |
1190631 9748138 127223 8.187373 |
|
Sum.
Stat. Summary Statistics |
||||||||
From the Table 7 we found that, when there is no lack of customer in Wholesale, Retail and Sales and Repair the highest mean value of Gross Output is in Wholesale business and the highest Correlation of Variation is in retail business. From the Table 7 we also found that, the highest mean value of Gross value added is in Wholesale and the highest CV is in retail business. The highest mean value of cost is in wholesale business and highest correlation of variation is in retail business. The highest mean value of non-industrial cost is in wholesale business and the highest value of CV is in retail business. The highest mean value of value-added fixed cost is in wholesale business and highest correlation of variation is in retail business. The highest mean value of total employee is in retail business and highest correlation of variation is in retail business. The highest mean value of wages and salaries is in retail business and highest correlation of variation is also in wholesale business.
Table 8
|
Table 8 Scenario Analysis on the Types of Business by Lack of Customer |
||||||||
|
Business type |
Sum. Stat. a |
Gross output |
Gross value added |
Cost |
Non industrial cost |
Value added fixed cost |
Total employee |
Wages and salaries |
|
Wholesale |
Mean SD SE CV |
6.31x10⁷ 1.66x10⁹ 3.45x 10⁷ 26.23019 |
4484013 1.12x10⁸ 2332999 24.95236 |
5.87x10⁷ 1.64x10⁷ 3.42x10⁷ 27.93476 |
164385.8 2053710 42822.82 12.49323 |
4319627 1.12x10⁸ 2330423 25.87333 |
6.24 12.88588 0.268689 2.065045 |
882453.5 3858479 80454.86 4.372445 |
|
Retail |
Mean SD SE CV |
1.43x10⁷ 7.17x10⁷ 909278.6 5.011945 |
2192087 1.91x10⁷ 242688.9 8.733575 |
1.21x10⁷ 6.27x10⁷ 795284 5.176476 |
194191.3 3073046 38955.54 15.82484 |
1997896 1.84x10⁷ 232651.1 9.186122 |
4.821469 20.95374 0.265621 4.345925 |
579239 2825601 35818.79 4.878126 |
|
Sale and Repair |
Mean SD SE CV |
2.25x10⁷ 8.39 x10⁷ 2855514 3.734094 |
4367319 6.16 x10⁷ 2096953 14.1052 |
1.81x10⁷ 5.06x10⁷ 1721367 2.794205 |
116143.2 1800556 61291.62 15.50289 |
4251176 6.15x10⁷ 2094877 14.47621 |
4.67555 6.249933 0.21275 1.336727 |
544809.1 1171198 39868.03 2.149739 |
|
Total |
Mean SD SE CV |
2.70x10⁷ 8.22 x10⁷ 8489156 30.43085 |
2953717 6.05 x10⁷ 624395.4 20.48005 |
2.41 x10⁷ 8.13 x10⁷ 8391439 33.77143 |
179711.4 2755431 28441.28 15.33253 |
2774005 6.03 x10⁷ 622078.8 21.72593 |
5.155657 18.32296 0.189128 3.553953 |
650374.7 3013929 31109.48 4.634142 |
|
Sum.
Stat. Summary Statistics |
||||||||
Table 8 shows, when there is lack of customer in Wholesale, Retail and Sales and Repair the highest mean value of Gross Output is in Wholesale business and the highest Correlation of Variation is in wholesale business. Highest mean value of Gross value added is in Wholesale and the highest CV is in wholesale business. The highest mean value of cost is in wholesale business and highest correlation of variation is in wholesale business. The highest mean value of non-industrial cost is in retail business and the highest value of CV is in retail business. The highest mean value of value-added fixed cost is in wholesale business and highest correlation of variation is in wholesale business. The highest mean value of total employee is in wholesale business and highest correlation of variation is in retail business. The highest mean value of wages and salaries is in wholesale business and highest correlation of variation is also in retail business.
Table 9
|
Table 9 Scenario Analysis on the Types of Business by no Economic Downward |
||||||||
|
Business type |
Sum. Stat. a |
Gross output |
Gross value added |
Cost |
Non industrial cost |
Value added fixed cost |
Total employee |
Wages and salaries |
|
Wholesale |
Mean SD SE CV |
2.88 x10⁷ 8.61 x10⁷ 1819308 2.98755 |
3085194 2.39 x10⁷ 504493.8 7.740952 |
2.57 x10⁷ 7.66 x10⁷ 1618934 2.977125 |
165466 1979386 41812.83 11.96249 |
2919728 2.35 x10⁷ 497121.5 8.060113 |
8.441321 21.42644 0.452615 2.53828 |
1501238 1.44x10⁷ 304469.8 9.600984 |
|
Retail |
Mean SD SE CV |
1.57x10⁷ 9.41x10⁷ 1180133 5.98468 |
1953950 2.01 x10⁷ 252164.6 10.28551 |
1.38 x10⁷ 8.68 x10⁷ 1089243 6.308019 |
117909.9 2043813 25644.01 17.33369 |
1836040 1.97 x10⁷ 246652.9 10.70679 |
4.824937 20.86329 0.261775 4.324054 |
573995.2 3002242 37669.55 5.230431 |
|
Sale and Repair |
Mean SD SE CV |
1.73x10⁷ 4.39 x10⁷ 1468792 2.536068 |
1699848 6551317 219231.5 3.85406 |
1.56 x10⁷ 3.96 x10⁷ 1324901 2.536774 |
157425.8 2059180 68907.83 13.08032 |
1542422 5937159 198679.5 3.849243 |
4.855543 11.35744 0.380062 2.339067 |
628950.3 2820951 94399.53 4.485174 |
|
Total |
Mean SD SE CV |
1.90x10⁷ 8.88 x10⁷ 911813.3 4.683065 |
2197277 2.02 x10⁷ 207754.1 9.208867 |
1.68 x10⁷ 8.13 x10⁷ 834498.6 4.847673 |
132864.7 2030139 20844.15 15.27975 |
2064413 1.98 x10⁷ 203566.6 9.603986 |
5.682163 20.35585 0.209001 3.582411 |
798223 7483201 76832.66 9.374825 |
|
Sum.
Stat. Summary Statistics |
||||||||
From the Table 9 we found that, when there is no economic downward in Wholesale, Retail and Sales and Repair the highest mean value of Gross Output is in Wholesale business and the highest Correlation of Variation is in retail business. From the Table 9 we also found that, the highest mean value of Gross value added is in Wholesale and the highest CV is in retail business. The highest mean value of cost is in wholesale business and highest correlation of variation is in retail business. The highest mean value of non-industrial cost is in wholesale business and the highest value of CV is in retail business. The highest mean value of value-added fixed cost is in wholesale business and highest correlation of variation is in retail business. The highest mean value of total employee is in wholesale business and highest correlation of variation is in wholesale business. The highest mean value of wages and salaries is in retail business and highest correlation of variation is also in wholesale business.
Table 10
|
Table 10 Scenario Analysis on the Types of Businessby Economic Downward |
||||||||
|
Business type |
Sum. Stat. a |
Gross output |
G VA |
Cost |
Non industrial cost |
Value added fixed cost |
Total employee |
Wages and salaries |
|
Wholesale |
Mean SD SE CV |
8.05x10⁷ 1.88 x10⁹ 4.46 x10⁷ 23.38951 |
6626315 1.28 x10⁸ 3036254 19.34282 |
7.38 x10⁷ 1.86 x10⁹ 4.41x10⁷ 25.2136 |
243432 2418010 57280.17 9.933004 |
6382883 1.28 x10⁸ 3033155 20.06003 |
8.523569 25.34131 0.60031 2.973087 |
1360755 5839781 138338.4 4.291575 |
|
Retail |
Mean SD SE CV |
1.94x10⁷ 7.72x10⁷ 1323354 3.975221 |
2823049 4.81 x10⁷ 823263.4 17.02184 |
1.66 x10⁷ 7.30 x10⁷ 1249907 4.392798 |
351100.4 3784795 64841.98 10.77981 |
2471949 4.76 x10⁷ 815957.3 19.267 |
30.98709 1439.421 24.6605 46.4523 |
810493.6 3869367 66290.89 4.774087 |
|
Sale and Repair |
Mean SD SE CV |
2.31x10⁷ 9.84 x10⁷ 4077695 4.265474 |
5883560 7.50 x10⁷ 3110362 12.75358 |
1.72 5.66 x10⁷ 2344223 3.292006 |
70923.32 448356.3 18584.97 6.321705 |
5812637 7.50 x10⁷ 3108776 12.90261 |
5.037801 6.413353 0.265842 1.273046 |
578093.2 1094113 45352.44 1.892624 |
|
Total |
Mean SD SE CV |
3.86 x10⁷ 1.05 x10⁹ 1.38 x10⁷ 27.12333 |
4306091 8.37x10⁷ 1101658 19.43521 |
3.43 x10⁷ 1.04 x10⁹ 1.36 x10⁷ 30.18139 |
289598.4 3207559 42223 11.07589 |
4016493 8.35 x10⁷ 1098921 20.78477 |
21.43372 1106.068 14.55983 51.6041 |
956968.8 4422936 58221.73 4.621819 |
|
Sum.
Stat. Summary Statistics |
||||||||
From the Table 10 we found that, when there remains effect of economic downward in Wholesale, Retail and Sales and Repair the highest mean value of Gross Output is in Wholesale business and the highest Correlation of Variation is in retail business. Table 10 table we also found that, the highest mean value of Gross value added is in Wholesale and the highest CV is in retail business. The highest mean value of cost is in wholesale business and highest correlation of variation is in retail business. The highest mean value of non-industrial cost is in wholesale business and the highest value of CV is in retail business. The highest mean value of value-added fixed cost is in wholesale business and highest correlation of variation is in retail business. The highest mean value of total employee is in wholesale business and highest correlation of variation is in wholesale business. The highest mean value of wages and salaries is in retail business and highest correlation of variation is also in wholesale business.
Table 11
|
Table 11 Scenario Analysis on the Types of Business by No Transportation Problem |
||||||||
|
Business type |
Sum. Stat. a |
Gross output |
G VA |
Cost |
Non industrial cost |
Value added fixed cost |
Total employee |
Wages and salaries |
|
Wholesale |
Mean SD SE CV |
5.14x10⁷ 1.28 x10⁹ 2.06 x10⁷ 24.93897 |
4715695 8.90 x10⁷ 1434729 18.88284 |
4.67 x10⁷ 1.27 x10⁹ 2.04 x10⁷ 27.15563 |
204183.1 2231862 35960.38 10.93069 |
4511512 8.89 x10⁷ 1432446 19.70604 |
8.224818 22.04968 0.355271 2.680871 |
1242734 4920874 79286.48 3.959716 |
|
Retail |
Mean SD SE CV |
1.67x10⁷ 8.85 x10⁷ 911099 5.296839 |
2289696 3.32 x10⁷ 341986.6 14.51321 |
1.44 x10⁷ 8.21 x10⁷ 844766.3 5.690799 |
204677.1 2826397 29087.15 13.80906 |
2085019 3.28 x10⁷ 337855 15.74535 |
14.23893 864.8308 8.900188 60.73705 |
656466.7 3365586 34636.07 5.126819 |
|
Sale and Repair |
Mean SD SE CV |
1.92 x10⁷ 7.12 x10⁷ 1891181 3.702204 |
3419633 4.84 x10⁷ 1284304 14.14251 |
1.58 x10⁷ 4.68 x10⁷ 1243235 2.959984 |
126341.9 1659092 44058.77 13.13177 |
3293291 4.83 x10⁷ 1282387 14.66315 |
4.917489 9.849443 0.261561 2.002941 |
608806.8 2338385 62098.04 3.840931 |
|
Total |
Mean SD SE CV |
2.60 x10⁷ 6.60 x10⁸ 5441636 25.35182 |
3033796 5.49 x10⁷ 452378.6 18.08638 |
2.30 x10⁷ 6.52 x10⁷ 5375931 28.34919 |
196997.5 2587737 21334.59 13.13589 |
2836798 5.46 x10⁷ 450550.4 19.26419 |
11.76584 692.9249 5.712817 58.89295 |
805373.8 3768692 31070.97 4.679433 |
|
Sum.
Stat. Summary Statistics |
||||||||
From the Table 11 we found that, when there is no transportation problem in Wholesale, Retail and Sales and Repair the highest mean value of Gross Output is in Wholesale business and the highest Correlation of Variation is in retail business. From the Table 11 we also found that, the highest mean value of Gross value added is in Wholesale and the highest CV is in retail business. The highest mean value of cost is in wholesale business and highest correlation of variation is in retail business. The highest mean value of non-industrial cost is in wholesale business and the highest value of CV is in retail business. The highest mean value of value-added fixed cost is in wholesale business and highest correlation of variation is in retail business. The highest mean value of total employee is in wholesale business and highest correlation of variation is in wholesale business. The highest mean value of wages and salaries is in retail business and highest correlation of variation is also in wholesale business.
Table 12
|
Table 12 Scenario Analysis on the Types of Business by Transportation Problem |
||||||||
|
Business type |
Sum. Stat. a |
Gross output |
G VA |
Cost |
Non industrial cost |
Value added fixed cost |
Total employee |
Wages and salaries |
|
Wholesale |
Mean SD SE CV |
5.88 x10⁷ 1.50 x10⁸ 1.15x10⁷ 2.556523 |
3258207 8677764 663605.2 2.663356 |
5.56 x10⁷ 1.47 x10⁸ 1.12 x10⁷ 2.636529 |
105799.2 256376.3 19605.58 2.423234 |
3152407 8623515 659456.7 2.735533 |
14.17544 41.58554 3.180126 2.933634 |
5860388 5.03 x10⁷ 3843169 8.575535 |
|
Retail |
Mean SD SE CV |
2.59x10⁷ 8.92 x10⁷ 5009808 3.440956 |
1294362 4325670 242953.8 3.341932 |
2.46 x10⁷ 8.65 x10⁷ 4857733 3.511861 |
39753.9 192384.2 10805.37 4.839381 |
1254608 4255624 239019.6 3.391994 |
5.605678 10.63724 0.597447 1.897584 |
659339 2122319 119201.3 3.218858 |
|
Sale and Repair |
Mean SD SE CV |
2.81x10⁷ 5.38x10⁷ 7121832 1.913922 |
1634323 4923896 652186 3.012805 |
2.65 x10⁷ 5.10 x10⁷ 6751002 1.926328 |
47470.96 130396.4 17271.42 2.746866 |
1586852 4890036 647701.1 3.081595 |
5.175439 5.175915 0.685567 1.000092 |
610786 911471.6 120727.4 1.492293 |
|
Total |
Mean SD SE CV |
3.65 x10⁷ 1.11 x10⁸ 4734861 3.030417 |
1946096 6139720 262996.7 3.15489 |
3.45 x10⁷ 1.07 x10⁸ 4598613 3.109096 |
61283.48 211430.9 9056.704 3.450047 |
1884813 6080002 260438.7 3.225786 |
8.249541 25.00022 1.070892 3.030499 |
2286150 2.82 x10⁷ 1209916 12.35517 |
|
Sum.
Stat. Summary Statistics |
||||||||
From the Table 12 we found that, when there remains transportation problem in Wholesale, Retail and Sales and Repair the highest mean value of Gross Output is in Wholesale business and the highest Correlation of Variation is in retail business. From the Table 12 we also found that, the highest mean value of Gross value added is in Wholesale and the highest CV is in retail business. The highest mean value of cost is in wholesale business and highest correlation of variation is in retail business. The highest mean value of non-industrial cost is in wholesale business and the highest value of CV is in retail business. The highest mean value of value-added fixed cost is in wholesale business and highest correlation of variation is in retail business. The highest mean value of total employee is in wholesale business and highest correlation of variation is in wholesale business. The highest mean value of wages and salaries is in retail business and highest correlation of variation is also in wholesale business.
Table 13
|
Table 13 Scenario Analysis on the Types of Business by no High Wages |
||||||||
|
Business type |
Sum. Stat. a |
Gross output |
G VA |
Cost |
Non industrial cost |
Value added fixed cost |
Total employee |
Wages and salaries |
|
Wholesale |
Mean SD SE CV |
5.20x10⁷ 1.2 x10⁷ 2.05 x10⁷ 24.50817 |
4686897 8.86 x10⁷ 1420693 18.90556 |
4.74 x10⁷ 1.26 x10⁷ 2.02 x10⁷ 26.6362 |
204006.9 2221067 35611.22 10.88721 |
4482890 8.85 x10⁷ 1418432 19.73446 |
8.235219 23.02917 0.369236 2.796424 |
1355533 1.15 x10⁷ 183921.9 8.462487 |
|
Retail |
Mean SD SE CV |
1.66 x10⁷ 8.83 x10⁷ 906797.4 5.30672 |
2227942 3.31 x10⁷ 339507 14.84492 |
1.44 x10⁷ 8.21 x10⁷ 842347 5.691267 |
199016.7 2809569 28840.75 14.11725 |
2028925 3.27 x10⁷ 335493.2 16.10834 |
14.01739 862.6284 8.855043 61.53989 |
623901.5 3249151 33353.14 5.207795 |
|
Sale and Repair |
Mean SD SE CV |
1.98 x10⁷ 7.16 x10⁷ 1903631 3.622508 |
3441094 4.84 x10⁷ 1286904 14.06786 |
1.63 x10⁷ 4.74 x10⁷ 1259145 2.901106 |
122143.2 1647751 43803.96 13.49032 |
3318951 4.83 x10⁷ 1285095 14.56507 |
4.896113 9.850284 0.261861 2.011858 |
599790 2307899 61353.39 3.847845 |
|
Total |
Mean SD SE CV |
2.63 x10⁷ 6.58 x10⁸ 5412339 25.07767 |
2990493 5.47 x10⁷ 449603.5 18.28708 |
2.33 x10⁷ 6.50 x10⁸ 5347070 27.9604 |
192976.6 2572921 21152.85 13.33281 |
2797517 5.45 x10⁷ 447819.8 19.47099 |
11.62474 690.9774 5.680759 59.44025 |
813961 6478933 53265.5 7.959758 |
|
Sum.
Stat. Summary Statistics |
||||||||
From the Table 13 we found that, when there are no high wages in Wholesale, Retail and Sales and Repair the highest mean value of Gross Output is in Wholesale business and the highest Correlation of Variation is in wholesale business. From the Table 13 we also found that, the highest mean value of Gross value added is in Wholesale and the highest CV is in wholesale business. The highest mean value of cost is in wholesale business and highest correlation of variation is in wholesale business. The highest mean value of non-industrial cost is in wholesale business and the highest value of CV is in retail business. The highest mean value of value-added fixed cost is in wholesale business and highest correlation of variation is in wholesale business. The highest mean value of total employee is in retail business and highest correlation of variation is in retail business. The highest mean value of wages and salaries is in retail business and highest correlation of variation is also in wholesale business.
Table 14
|
Table 14 Scenario Analysis on the Types of Business by High Wages |
||||||||
|
Business type |
Sum. Stat. a |
Gross output |
G VA |
Cost |
Non industrial cost |
Value added fixed cost |
Total employee |
Wages and salaries |
|
Wholesale |
Mean SD SE CV |
4.17x10⁷ 9.53 x10⁷ 8263284 2.284413 |
3684071 1.02 x10⁷ 887895.7 2.779456 |
3.80 x10⁷ 9.14 x10⁷ 7927653 2.403924 |
82843.31 254176.8 22039.92 3.068163 |
3601227 1.02 x10⁷ 882979.2 2.827651 |
15.57143 27.89001 2.418371 1.791102 |
3880551 1.01 x10⁷ 878198.5 2.609908 |
|
Retail |
Mean SD SE CV |
3.00 x10⁷ 9.55 x10⁷ 5822099 3.187776 |
3295344 1.39 x10⁷ 847786.2 4.219507 |
2.67 x10⁷ 8.80 x10⁷ 5365771 3.301074 |
210014.2 1414882 86266.87 6.737078 |
3085330 1.30 x10⁷ 791144.7 4.205624 |
11.88104 31.02251 1.891476 2.611094 |
1808713 5402019 329366.9 2.986664 |
|
Sale and Repair |
Mean SD SE CV |
1.51 x10⁷ 4.13 x10⁷ 5336295 2.735234 |
1217479 5652885 729784.3 4.643108 |
1.39 x10⁷ 3.79 x10⁷ 4894852 2.728806 |
150433.3 1029522 132910.7 6.843707 |
1067045 4640672 599108.2 4.349086 |
5.666667 5.426447 0.700551 0.957608 |
823331.7 2100606 271187.1 2.551349 |
|
Total |
Mean SD SE CV |
3.14 x10⁷ 9.05 x10⁷ 4209427 2.880274 |
3137398 1.21 x10⁷ 564250.5 3.865657 |
2.83 x10⁷ 8.45 x10⁷ 3930056 2.987494 |
165666.6 1149389 53474.42 6.937965 |
2971731 1.14 x10⁷ 532335.8 3.850323 |
12.13636 28.19341 1.311676 2.323053 |
2277180 6931427 322479.2 3.043864 |
|
Sum.
Stat. Summary Statistics |
||||||||
From the Table 14 we found that, when there remains effect of high wages in Wholesale, Retail and Sales and Repair the highest mean value of Gross Output is in Wholesale business and the highest Correlation of Variation is in retail business. From the Table 14 we also found that, the highest mean value of Gross value added is in Wholesale and the highest CV is in sale and repair business. The highest mean value of cost is in wholesale business and highest correlation of variation is in retail business. The highest mean value of non-industrial cost is in retail business and the highest value of CV is in sales and repair. The highest mean value of value-added fixed cost is in wholesale business and highest correlation of variation is in sale and repair business. The highest mean value of total employee is in wholesale business and highest correlation of variation is in retail business. The highest mean value of wages and salaries is in sale and repair business and highest correlation of variation is also in retail business.
Table 15
|
Table 15 Scenario Analysis on the Types of Business by No Effect of Corona |
||||||||
|
Business type |
Sum. Stat. a |
Gross output |
G VA |
Cost |
Non industrial cost |
Value added fixed cost |
Total employee |
Wages and salaries |
|
Wholesale |
Mean SD SE CV |
2.97x10⁷ 8.20 x10⁷ 4881458 2.761804 |
3140808 9923407 590930.3 3.159508 |
2.65 x10⁷ 7.55 x10⁷ 4493402 2.843104 |
122977.7 710876.6 42332.09 5.780533 |
3017830 9764495 581467.2 3.235601 |
8.858156 14.12732 0.84127 1.594838 |
2396959 1.13 x10⁷ 671248.7 4.702702 |
|
Retail |
Mean SD SE CV |
1.26 x10⁷ 6.73 x10⁷ 2418599 5.325151 |
-990292 8.11 x10⁷ 2914566 -81.9335 |
1.36 x10⁷ 1.00 x10⁸ 3592015 7.334288 |
35513.53 234770.6 8433.209 6.610737 |
-1025805 8.11x10⁷ 2913618 -79.0712 |
4.627097 12.03254 0.432222 2.600451 |
676021.6 2919268 104863.2 4.318306 |
|
Sale and Repair |
Mean SD SE CV |
1.19 x10⁷ 4.53 x10⁷ 5898183 3.820954 |
1341158 4735443 616502.2 3.530861 |
1.05 x10⁷ 4.07 x10⁷ 5297315 3.869372 |
72157.2 416971.4 54285.05 5.778652 |
1269001 4335310 564409.2 3.416316 |
4.932203 6.485699 0.844366 1.31497 |
653473.3 1872010 243714.9 2.864707 |
|
Total |
Mean SD SE CV |
1.69 x10⁷ 7.07 x10⁷ 2117196 4.183261 |
176845.9 6.78 x10⁷ 2030065 383.4838 |
1.67 x10⁷ 9.22 x10⁷ 2759060 5.509112 |
59551.95 419629 12561.27 7.046436 |
117293.9 6.78 x10⁷ 2029163 577.9277 |
5.712366 12.50373 0.374289 2.188888 |
1109690 6219393 186172.7 5.604623 |
|
Sum.
Stat. Summary Statistics |
||||||||
From the Table 15 we found that, when there is no risk of corona in Wholesale, Retail and Sales and Repair the highest mean value of Gross Output is(2.97 ) in Wholesale business and the highest Correlation of Variation is in retail business(5.32).From the Table 15 we also found that, the highest mean value of Gross value added is in Wholesale and the highest CV is in sale and repair. The highest mean value of cost is in wholesale business and highest correlation of variation is in retail business. The highest mean value of non-industrial cost is in wholesale business and the highest value of CV is in retail business. The highest mean value of value-added fixed cost is in wholesale business and highest correlation of variation is in sale and repair. The highest mean value of total employee is in wholesale business and highest correlation of variation is in retail business. The highest mean value of wages and salaries is in wholesale business and highest correlation of variation is also in wholesale business.
Table 16
|
Table 16 Scenario Analysis on the Types of Business by Effect of Corona |
||||||||
|
Business type |
Sum. Stat. a |
Gross output |
G VA |
Cost |
Non industrial cost |
Value added fixed cost |
Total employee |
Wages and salaries |
|
Wholesale |
Mean SD SE CV |
5.34x10⁷ 1.30 x10⁹ 2.13 x10⁷ 24.3725 |
4767790 9.03 x10⁷ 1476937 18.94692 |
4.86 1.29 x10⁹ 2.10 x10⁷ 26.46853 |
205807.4 2256991 36900.82 10.96652 |
4561983 9.02 x10⁷ 1474604 19.7704 |
8.449078 23.78589 0.388889 2.815205 |
1366799 1.14 x10⁷ 187164.2 8.375524 |
|
Retail |
Mean SD SE CV |
1.74 x10⁷ 9.02 x10⁷ 951155.6 5.184253 |
2537522 2.44 x10⁷ 256927.7 9.597012 |
1.49 x10⁷ 8.05 x10⁷ 849718.1 5.422631 |
213450.5 2896685 30560.91 13.57075 |
2324071 2.38 x10⁷ 250913.7 10.23316 |
14.76347 886.5956 9.353856 60.05334 |
654881.1 3365829 35510.54 5.139603 |
|
Sale and Repair |
Mean SD SE CV |
1.99 x10⁷ 7.15 x10⁷ 1899574 3.592018 |
3434370 4.84 x10⁷ 1286116 14.09174 |
1.65 x10⁷ 4.73 x10⁷ 1255700 2.869746 |
125424.7 1658358 44070.37 13.22194 |
3308945 4.83 x10⁷ 1284233 14.60447 |
4.92726 9.822794 0.261038 1.993561 |
607025.3 2316230 61553.12 3.815706 |
|
Total |
Mean SD SE CV |
2.72 x10⁷ 6.73 x10⁸ 5661821 24.79158 |
3217344 5.26 x10⁷ 442627.2 16.3599 |
2.39 x10⁷ 6.65 x10⁸ 5591589 27.77447 |
202614.1 2637009 22175.41 13.01493 |
3014730 5.24 x10⁷ 440632 17.38071 |
12.10805 706.7837 5.943558 58.37302 |
838427 6518952 54819.84 7.775217 |
|
Sum.
Stat. Summary Statistics |
||||||||
From the Table 16 we found that, when there has risk of corona in Wholesale, Retail and Sales and Repair the highest mean value of Gross Output is in Wholesale business and the highest Correlation of Variation is in wholesale business. From the Table 16 we also found that, the highest mean value of Gross value added is in Wholesale and the highest CV is also in wholesale business. The highest mean value of cost is in wholesale business and highest correlation of variation is in wholesale business. The highest mean value of non-industrial cost is in retail business and the highest value of CV is in retail business. The highest mean value of value-added fixed cost is in wholesale business and highest correlation of variation is in wholesale business. The highest mean value of total employee is in retail business and highest correlation of variation is in retail business. The highest mean value of wages and salaries is in wholesale business and highest correlation of variation is also in wholesale business.
6. Overall Findings of the Study
The findings of the study have been used for designing interventions that can improve the well-being of wholesale and retail workers, improve labor productivity, and aid in sectorial growth. This study has been conducted to investigate the scenario of wholesale and retail trade in Bangladesh. Another objective of this study is to minimize the adverse impact on our wholesale and retail business if an epidemic occurs. In this study the secondary BBS data have been used. 15,258 of sample data have been used from the wholesale and retail survey 2021.the analysis has been carried out using the following variables: location of the business, type of the business, classification of the organization ownership, institutional information, Number of people employed, working hours, wages, operating expenses, gross value added, gross output. Descriptive statistics has been used to examine the current status of input cost, gross value added, gross output of wholesale and retail trade in Bangladesh by using tabular presentation (frequency, percentage), graphical presentation (bar diagram, pie chart), arithmetic mean, standard deviation, standard error, coefficient of variation. In conclusion, these summary statistics in Univariate analysis give an overview of the characteristics and financial performance of various business kinds depending on their capital resources. Retail businesses have more flexibility in expenses, while wholesale enterprises often have more output and value added. Businesses that are involved in sales and repairs fall between these two groups, and the aggregate average values offer a complete picture of these companies as a whole. Business analysts, politicians, and investors that want to comprehend the economic environment of various sectors can benefit from these insights.
Overall, from the analysis of the study it is suggested that industrial cost, non-industrial cost, and total wages have statistically significant and positive associations with gross output, while total employment and the variable "corona" do not appear to be strongly associated with gross output based on the results and p-values. These findings are important for understanding the factors that influence gross output in the research context.
In this analysis, we aimed to assess the influence of several independent variables on two key economic indicators: gross output and cost. The independent variables considered included industrial cost, non-industrial cost, total employment, total wages, and the impact of the COVID-19 pandemic (referred to as "corona"). We also examined the effects of a set of factors including a lack of capital, a lack of customers, economic downward, market problems, high wages, transportation problems, and logistic deficiencies on the cost.
The study found that pandemic period, industrial and nonindustrial cost, labour wage has a significant influence on gross output. Finally, a significant dependency of gross output has been detected on gross value addition whereas the total scenarios are affected by COVID -19 in Bangladesh.
7. Conclusion
Based on the findings of this study, there is need to provide information on wholesalers and retailers with basic life skills. Also, Government should support for economic well-being to overcome any epidemics by ensuring that youth are fully informed about wholesale and retail trade and related risks. As a result, the objective has been achieved.
8. Limitations and Further Research Direction
This study is the first initiative to diagnosis the scenario of retail and wholesale trade and impact of COVID -19 on gross output and gross value addition using national level big data set. Since there have no baseline survey before COVID- 19 at national level, the exact effect of pandemic on gross output and gross value added are unseen. But it is need to search the related document of other national survey before pandemic to compare and measure the scenario of retail and wholesale trade and effect of COVID -19 on gross output and gross value added. This study only considered the formal establishment of wholesale and retail trade in Bangladesh. But, still a large number of informal establishments need to be added to make final decision and policy option to represent the status of retail and wholesale trade and to recover the effect of COVID -19 on gross output and gross value addition of wholesale a retail trade in Bangladesh.
CONFLICT OF INTERESTS
None.
ACKNOWLEDGMENTS
None.
REFERENCES
Alam, M.J. (2020). Transformation of Retailing in Bangladesh: A Holistic Approach.
Journal of Marketing and Consumer Research, (64), 68-79.
Altunışık,
R., Coşkun, R., Bayraktaroğlu, S., Yıldırım, E. (2012). “Araştırma Yöntemleri SPSS Uygulamalı”, Sakarya
Yayıncılık, 7. Baskı.
Amit, P., & Kameshvari, B. (2012). A Study on Consumer Behaviour of Organized and Unorganized Retail
Outlets in Vadodara City. International Journal of Engineering and Management
Sciences, 3(4), 466-474.
Arci, F., Reilly, J., Li, P., Curran,
K., Belatreche, A. (2018). Forecasting Short-Term
Wholesale Prices on the Irish Single Electricity Market. International Journal
of Electrical and Computer Engineering (IJECE), 8(6), 4060-4078.
Arif, M.Z. (2013). A Study on Increasing Establishment of Superstores in Bangladesh with
Special Reference to Dhaka City. Anveshak International Journal of Management
(AIJM), 2(1), 9-34.
Aydın, K. (2013). “Perakende Yönetiminin Temelleri”, Nobel Yayını, 4.
Basım.
Datta, P.R. (2017). Relationship Marketing and Customer Retention in Bangladesh’s Food
Retailing Sector, an Unpublished Doctor of Philosophy (PhD) Thesis Submitted to
the Department of Marketing and Enterprise Business School University of
Hertfordshire United Kingdom.
Dhotre, M. (2010). Channel Management and Retail Marketing. Himalaya Publishing House,
Revised Edition.
D’Acquisto, L.J., Miller, L., D’Acquisto,
D.M., Roemer, K., & Fisher, M. (2015).
Physiological and Psychophysical Aspects of Shallow Water Exercise.
International Journal of Aquatic Research and Education, 9(3), 273–291.
Farid, M., Alam, M., Rahman, M.,
Barua, S., & Sarker, B. (2018). Direct and
Associated Factors Influencing the Growth in Supermarket Activity in
Bangladesh. Asian research Journal of Arts and Social Sciences, 5(1), 1-2.
Hameli, K. (2018). A Literature Review of Retailing Sector and Business Retailing Types.
ILIRIA International Review, 8(1), 67-87.
Hassani, K., & Dost, S. (2020). Impact of COVID 19 on International Trade and China’s Trade. Turkish
Economic Review, 7(2), 103-110.
Hoque, A., Shikha, F.A., Hasanat,
M.W., Arif, I., Hamid, A.B. (2020). The Effect of
Coronavirus (COVID-19) in the tourism industry in China. Asian Journal of
Multidisciplinary Studies, 3(1), 52-58.
Hossain, N. (1999). A Syntactic Approach to the Analysis of Spatial Patterns in
Spontaneous Retail Development in Dhaka, Space Syntax Second International
Symposium, Brasilia.
Hossain, N. (2009). Benign or Exploitative and Space - The Changing Pattern of Shopping
Development in a Rapidly Developing City Dhaka, Bangladesh; Paper Published in
the Proceedings of the 7th International Space Syntax Symposium Stockholm: KTH.
Hossain, N. (2014). History of Commercial Development in Dhaka and the Spatial
Significance of Spontaneous Retail Growth. IOSR Journal of Humanities and
Social Science, 19(11), 66-73.
Kotler, P., & Armstrong, G.
(2012). “Principles of Marketing”, Pearson Prentice
Hall, 14th Edition.
Kuzman, B., Prdić, N., &
Dobraš, Z. (2017). The Importance of the Wholesale
Markets for Trade in Agricultural products.
Економика
пољопривреде,
64(3), 1177-1190.
Levi, M. (2003). Organising and Controlling Payment Card Fraud: Fraudsters and Their
Operational Environment. Security Journal, 16, 21-30.
MEGEP, M. (2008). Büro Yönetimi ve Sekreterlik–Đş Mektubu. Raporlama ve
Yazı Metni Oluşturma Modülleri, Ankara.
Mucuk, I. (2009). “Pazarlama İlkeleri”, Türkmen Kitabevi, 17. Basım.
Nithya, S., & Chirputkar, A.
(2020). The Analysis of Impact of Covid-19 on
Retail Consumer Behavior and PalArch's Journal of Archaeologybusiness models.
of Egypt/Egyptology, 17(6), 4384-4401.
Okolo, M. (2021). Essays on Macroeconomic Asymmetry and UK Labour Markets. Doctor of
Philosophy, University of Bath, Department of Economics, UK.
Pereyra Reyna, M.J. (2016). Capacidad Emprendedora Del Sector Comercio Minorista en el Centro
Comercial Zona Franca de la Ciudad de Trujillo 2016. Trujillo, Perú.
Perreault, W., Cannon, J., &
McCarthy, J. (2013). Pazarlamanın Temelleri:
Biz Pazarlama Stratejisi Planlama Yaklaşımı”, Mc-Graw Hill, 13
Basımdan Çeviri (Nobel Yayını).
Quinn, J., & Sparks, L. (2007). The Evolution of Grocery Wholesaling and Grocery Wholesalers in
Ireland and Britain Since the 1930s. International Review of Retail,
Distribution and Consumer Research, 17(4), 391-411.
Rahman, M.F., Kemi, A.P., Zaman,
M.N., Shariful, S., & Ali, M.J. (2017).
Practices of Retailing Marketing in Bangladesh: A Study on Rangpur City.
Journal of Marketing and Consumer Research, 32, 20-28.
Rahman, S.M. (2015). Optimizing Digital Marketing for Generation Y: An Investigation of
Developing Online Market in Bangladesh. International Business Research, 8(8),
150-163.
Robenhagen, S., Shahrukh, S.A.,
& Taufiq, S. (2014). ICT and e-Commerce Booming
in Bangladesh. Bangladesh: Embassy of Denmark.
Rudrabasavaraj, M.N. (2010). “Dynamic Global Retailing Management”, Himalaya Publishing House, 1st
Edition.
Shahid, R.B. (2017). Building Strong Brand Equity of Supermarkets in the Context of
Bangladesh. International Journal of Economics, Commerce and Management, 5(6),
646-660.
Sharma, B. (2008). Strategic Retail Management. Book Enclave.
Shyamali, B., & Farjana, Y. (2014). Evaluation of Retail Product Performance of Listed Banking and Financing Companies of Bangladesh. International Journal of Business and Economics Research, 3(6-1), 51-56.
 This work is licensed under a: Creative Commons Attribution 4.0 International License
© Granthaalayah 2014-2024. All Rights Reserved.