Experimental Investigation on the Flexural Behaviors of Piers Caps with Various Concrete and Reinforcement Types
Hajir A Al-Hussainy
1![]()
![]()
1 Department
of Civil Engineering, University of Kerbala, Kerbala, Iraq
|
|
|
ABSTRACT |
|
|
This paper
investigated the flexural behavior of six piers caps samples incorporating
various reinforcement
and concrete mix types. Four pier caps with similar steel reinforcement were
cast using different mixes, including normal concrete (NC), high strength
concrete (AHSC), and green concrete (GC) with 50% recycled concrete aggregate
(RCA), and green concrete with a 2% volumetric ratio of recycled steel fiber
(ARSF)). The remaining two piers caps were
reinforced using CFRP and
GFRP bars. Experimental tests were conducted to examine the behavior of piers
regarding the loading at which the first cracks occur, deflection, and
failure load. The results indicated that GC pier caps exhibited a decrease in
failure load of 2.4% compared to a higher deflection of approximately
one-fifth when compared with the NC pier cap. The findings also indicated
that incorporating recycled steel fibers enhanced the failure load and
decreased the deflection by 9% and 32.5%, respectively, when compared to the
GC pier. In addition,
AHSC pier caps exhibited failure load by nearly 36.8% than that of GC. The behavior of CFRP and GFRP
was opposite when comparing steel-reinforced pier caps regarding
failure load. |
|||
|
Received 25 June
2024 Accepted 30 July 2024 Published 06 September 2024 Corresponding Author Hajir A
Al-Hussainy, Hajir.a@uokerbal.edu.iq
DOI 10.29121/granthaalayah.v12.i8.2024.5723 Funding: This research
received no specific grant from any funding agency in the public, commercial,
or not-for-profit sectors. Copyright: © 2024 The
Author(s). This work is licensed under a Creative Commons
Attribution 4.0 International License. With the
license CC-BY, authors retain the copyright, allowing anyone to download,
reuse, re-print, modify, distribute, and/or copy their contribution. The work
must be properly attributed to its author.
|
|||
|
Keywords: Pier Caps, Green Concrete, Recycled Steel
Fiber, CFRP, GFRP |
|||
1. INTRODUCTION
Bridge piers are generally
referred to as the substructure between the spans and foundations. Piers are
utilized to offer perpendicular support at various points for bridge spans.
Piers serve two primary purposes: to withstand lateral forces exerted on the
bridge and to transmit the vertical loads of the superstructure to the
foundations. AASHTO. (2007). Concrete has
been the primary choice for bridge piers for more than a century and remains
the most widely used material in construction. Aggregates make up nearly 70% of
the total concrete used. Tu et al. (2006). every year Over 1 billion tons of demolition and
construction waste are generated
globally Katz (2004) Recycled Concrete Aggregate can be successfully used
in the production of various concrete structures. RAC is a type of concrete that is made using
either recycled aggregates alone or a mixture of natural aggregates and
recycled aggregates. (RA) may be coarse or fine, obtained by waste
materials or crushing demolished concrete Bhattacharyya (2011). Decreased natural resources of gravel and
increased waste globally lead to over one billion tons of demolition and
construction waste annually generated. Therefore, it is important to increase
the amount of recycled waste. The construction industry consumes a large amount of materials and at the same time producer a large
amount of waste. To reduce the construction waste it
must be recycled and reuse waste of inorganic structures such as concrete
rubble. Recycled aggregates can have a wide range of compositions, and can significantly
impact the properties of concrete Chen et al. (2003).
Recently, numerous
researchers study the durability and mechanical
characteristics of RAC. Bhattacharyya (2011)
presented experimental
investigation to study how different quantities of recycled
coarse aggregate affect the characteristics of concrete made with recycled
aggregate. A new term known as the "coarse aggregate replacement
ratio" has been recently coined. This ratio is defined as the percentage
of the weight of recycled coarse aggregate compared to the total weight of
coarse aggregate used in a concrete mixture. Different replacement ratios of
coarse aggregate, specifically 0, 0.25, 0.50, and 1.0, were employed in the
concrete mixes to assess the concrete's performance. The findings indicate that
the density of RAC is less than that of concrete produced using natural
aggregates. Additionally, Recycled aggregate concrete takes longer to achieve
its strength compared to concrete made with natural aggregates after 28 days. Mjelde (2013) conducted experimental research to study the
effectiveness of using recycled concrete aggregate in new concrete pavements.
The research involved substituting 20% of the cement in the mixture. Eight
concrete batches were produced as part of the experimental program, and fresh
and hardened concrete samples were created from each batch. Findings indicated
that the recycled coarse aggregate could be utilized as a suitable source of
aggregate for concrete, despite causing a decrease in the workability of the fresh
concrete.
McLeod (1997) carried out an experimental study to examine how the strength of concrete impacts the behavior of two full scale reinforced concrete pier caps. These experimental studies involved the use of a specific quantity of evenly distributed reinforcement required for crack control under service load conditions. Two types of concrete were utilized in the studies: normal strength concrete and high strength concrete. The results show that the cracks were longer and wider in the high-strength concrete specimen compared to the specimen with normal-strength concrete. The high-strength concrete specimen exhibited a little greater strength than the normal-strength concrete specimen. The high-strength concrete pier cap sample showed a 32% decrease in ductility compared to the normal-strength concrete sample. Despite this, the high-strength concrete sample had a slightly higher cracking load than the normal-strength concrete sample, which can be attributed to the higher shrinkage strains experienced in the high-strength concrete.
Denio et al. (1995) conduct a study on
pier caps. Six specimens were used, each with a different pattern of
reinforcement, in order to examine the effect of
various types of reinforcement on the strength of pier caps. Eleven samples
were tested under static loads until they reached their breaking point. The
findings showed that samples with increased horizontal steel reinforcement and properly
developed lateral reinforcement exhibited higher strength.
Lately, there has been a significant rise in research dedicated to assessing the efficiency of concrete elements enhanced with fiber reinforced polymer (FRP) bars. The majority of these studies have primarily concentrated on the application of FRP bars for the reinforcement of concrete. Hence, the objective of this research is to assess the effectiveness of different reinforced concrete piers utilizing various concrete mixes and reinforcements, along with recycled aggregate mix sourced from demolished structures.
2. Experimental program
2.1. Details
of specimens
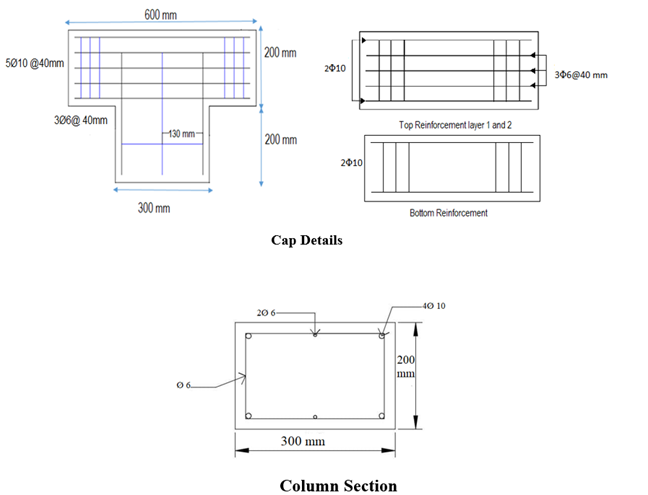
included six reinforced concrete piers, all with the same measurements: 200mm high,200mm wide, and 600mm long. With (200×300) mm and 200mm depth for piers column cross-section of. They were categorized according reinforcement used to FRP group and steel group.
2.1.1. Steel Reinforcement Group
The group included four piers have the same design and reinforcement made of various concrete mixes, as shown in Figure 1.
Figure 1
|
Figure 1 Details of Reinforcement in Concrete Piers |
The differences between piers are as follows:
· Pier with symbol (NC): This pier was cast of NC with steel reinforcement.
·
Pier with symbol (GC): This pier was cast
with GC at replacement ratio of 50% and reinforced with steel reinforcement.
·
Pier with symbol (ARSF): This pier was similar to GC, but the recycled steel fiber used at 2% volumetric ratio.
·
Pier
with symbol (AHSC) was similar to the previous
pier but cast with high strength concrete mix.
2.1.2.
FRP Reinforcement Group
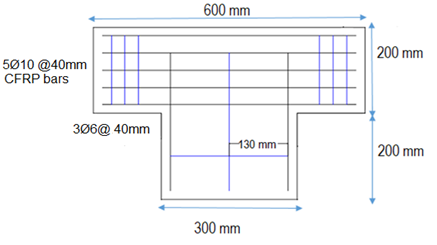
This group included two reinforced concrete piers similar to the previous piers in term of geometric design and reinforcement pattern cast with the green concrete mix at replacement ratio of 50%.
Pier with symbol (TCFRP) was cast with GC reinforced with CFRP bars for main tension reinforcement of pier cap only, as shown in Figure 2.
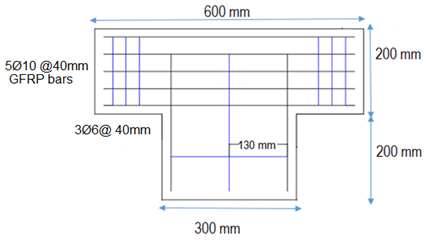
Pier with symbol (TGFRP) was similar to the TCFRP pier except use GFRP.
Figure 2
|
Figure 2 TCFRP Pier. |
Figure 3
|
Figure 3 TGFRP Pier. |
2.2. Materials used
2.2.1. Cement
Type V Portland cement with sulfate resistance was utilized in this It complies with the Iraqi specification limits No. 5/1984 Iraqi Specification, No. 5/1984, P. C. (n.d.).
2.2.2. Fine Aggregate (Sand)
Different concrete mixes were made using natural sand with a maximum particle size of 4.75 mm. The physical and chemical properties of the sand were found to meet the standards set by Iraqi Specification, No. 5/1984, P. C. (n.d.).
2.2.3. Coarse Aggregate
Natural aggregate with a maximum particle size of 19 mm
was used in making different concrete mixes. The test results showed that this
aggregate met the standards set in Iraqi specifications No. 45/1984 Iraqi Specification, No. 5/1984, P. C. (n.d.).
2.2.4. Recycled Coarse Aggregate
This type of aggregate is produced from old concrete samples after being crushed into small particles. before undergoing the sieving process to ensure compliance with the Iraqi specifications No. 45/1984.
2.2.5. Recycled Steel Fiber
Recycled steel fibers utilized
in this program are obtained from recycled car tires through the process of
incineration, and then cut into small pieces approximately 2cm in length.
2.2.6. Steel Reinforcement
Deformed bars with diameters of (6 and 10) mm were used to reinforce the specimen piers. Three samples
from each size were tested, and the results were found to comply with ASTM
A-615-15 standards. ASTM A615/A615M-15a. (2015).
2.2.7. Fiber Reinforcement Polymers Bars
This study used 200 glass and carbon fiber reinforced polymers bars with nominal diameters of 10 mm and 6 mm. Table 1 provides the properties of these materials. The test results met the standard specifications of ASTM D 7205. ASTM D7205/D7205M-06. (2016).
Table 1
|
Table 1 FRP Bars Properties |
||||
|
Properties |
Type |
|||
|
CFRP
(6mm) |
GFRP
(6mm) |
CFRP
(10mm) |
GFRP
(10mm) |
|
|
Nominal
diameter (mm) |
6 |
6 |
10 |
10 |
|
Area (mm) |
31. 7 |
31. 7 |
71.3 |
71.3 |
|
Tensile load (kN) |
71 |
28 |
154 |
59 |
|
Guaranteed
tensile strength (MPa) |
2240 |
896 |
2172 |
827 |
|
Modulus of elasticity
(GPa) |
125 |
46 |
125 |
46 |
2.2.8. Superplasticizer
In this study, admixture high-range water-reducing called
Sika ViscoCrete®-5930, provided by Sika, was used to
create a high-strength concrete (HSC) mix.
2.3. Mix Proportions
Both normal and high-strength concrete were used for all pier specimens in this study. Various empirical mixes were tested in the laboratory to determine the final design mix. The chosen proportions for the normal concrete mix were (1: 1.4: 2.2) with a water-to-cement (W/C) ratio of 0.43. For the high-strength mix, the proportions were (1 :0.97: 1.23) with a W/C ratio of 0.38. In both mixes, 50% of the normal aggregate was replaced with recycled crushed coarse aggregate. The mixing process was conducted using a 0.1 m³ rotary mixer. Table 2 shows the quantities of materials used in this research.
Table 2
|
Table 2 Materials Quantities of Concrete Mixes, kg/m3 |
|||
|
Materials |
Normal |
High-strength |
Green
concrete |
|
Cement |
465 |
500 |
465 |
|
Sand |
651 |
485 |
651 |
|
Gravel |
1023 |
615 |
511.5 |
|
RAC |
0 |
615 |
511.5 |
|
W/C |
0.43 |
0.38 |
0.43 |
|
SP* |
0 |
1 |
0 |
|
*Superplasticizer |
|||
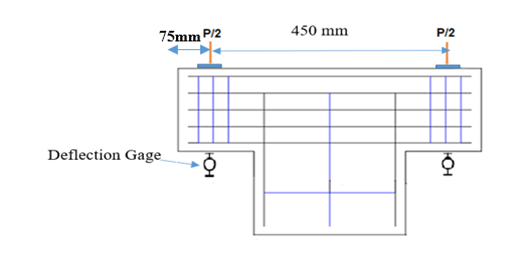
3. Tests Setup of Piers
The pier specimens were tested following the completion of
the curing process. A concentrated load of 75 mm was applied using two points,
positioned at a distance of 450 mm from center to center on the pier cap.
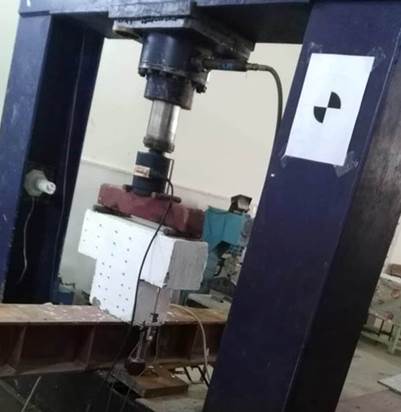
In Figure 4, the application of
the load and the arrangement of the deflection gauge for the piers are
illustrated. The
process of testing pier specimens are shown in Figure 5.
Figure 4
|
Figure 4 Details of the Loading System for Pier Specimens |
Figure 5
|
Figure 5 The Hydraulic Machine for Testing Concrete Piers |
4. Results
4.1. Results of Concrete Mechanical Properties
The research included conducting tests on the mechanical characteristics of concrete specimens, including compressive strength, splitting tensile strength, density, and absorption. The findings of these tests are presented in Table 3.
Table 3
|
Table 3 Mechanical Properties of Concrete |
||||
|
Mix Notation |
fc′ (Cylinders) (MPa) |
ft
(Splitting) (MPa) |
Absorption % |
Density (g/cm3) |
|
N C |
29.5 |
3.47 |
3.707 |
2.485 |
|
G C |
29.1 |
3.25 |
4.423 |
2.343 |
|
RSF |
35.0 |
3.98 |
4.984 |
2.343 |
|
H S |
47.2 |
4.52 |
1.257 |
2.412 |
4.2. General Behavior of Steel Reinforcement Tested Piers Group
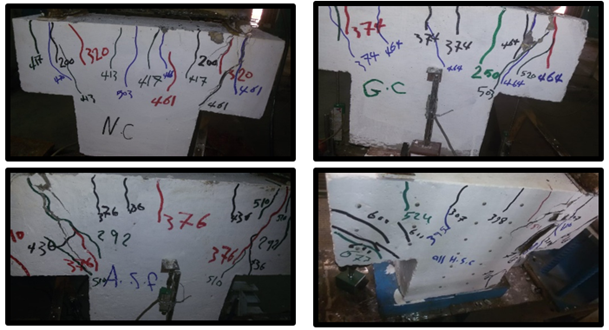
The cracks started to appear at the pier specimens when the tensile stress reaches to the ultimate strength of concrete. Several kinds of cracks was observed under the applied load in the pier samples. These cracks was shear, flexural shear, and flexural cracks. The results of all piers of this group included the first cracking load, failure load, and the deflection at the failure stage are presented in Table 4. Figure 6 shows the cracks patterns of the tested piers for this group.
Table 4
|
Table 4 The Experimental Results of Tested Pier Specimens at Failure Stage |
|||
|
Piers Notation |
First crack, Pcr (kN) |
Ultimate
load, Pu (kN) |
Deflection. (mm) |
|
NC |
201 |
537 |
6.58 |
|
GC |
180 |
525 |
7.81 |
|
ARSF |
292 |
572 |
5.27 |
|
AHSC |
354.6 |
718 |
3.9 |
Figure
6
|
Figure 6 The Crack Pattern of Steel Reinforced Piers at the Failure Stage |
4.2.1. First Crack
At early stages of loading all pier specimens were behave elastically, with the continuation of loading several types of cracks began to appear. For pier (NC) which was the reference pier cast without green concrete the first crack was noticed at 201 kN. The first flexural crack of the pier (GC) which was cast with green concrete was noticed at load 180 kN with reduction of 11.1% as compared with NC pier. For pier (ARSF) which was cast with green concrete in addition of recycled steel fiber with 2% volumetric ratio, the first crack was noticed at 292 kN, it was noticed that the recycled steel fiber effect positively in this pier and delay appearing of cracks with increasing of 62.2% as compared with GC pier that cast with green concrete only. For pier (AHSC), which cast with high strength concrete mix, the first crack was appeared at 254 kN, while the load failure was record at 718 kN.
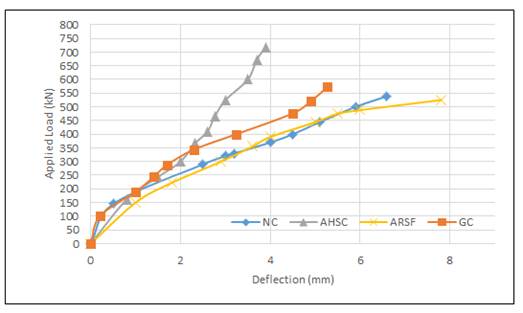
4.2.2. Load-Deflection Curves
The experimental program results revealed that the NC pier had a failure load that was 2.4% higher than that of the GC pier, along with a deflection increase of 18.5% compared to the NC pier. Improving mix by adding recycled steel fiber had affected positively on the overall behavior of this pier. The study found that the ultimate load of the pier with recycled steel fiber (ARSF) was 8.95% higher than those without it (GC). The deflection of pier ARSF was found to be less than those of GC by 32.5%. The ultimate load capacity was enhanced by 36.7% due to the utilization of high strength concrete, while deflection was less than GC by about 50%. The load-deflection curves for each of the pier specimens are illustrated in Figure 7.
Figure 7
|
Figure 7 Load-Deflection Curves of Reinforced Steel Pier Specimens |
4.3. General Behavior of FRP piers Group
4.3.1. First Cracking Load
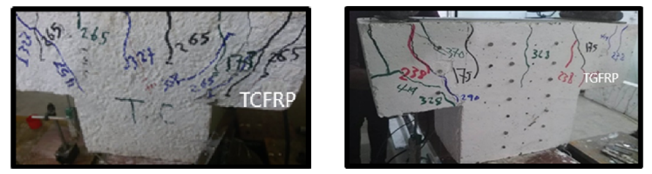
The experimental test show different type of cracks that appeared in the pier specimens under loading. Such as shear cracks, flexural cracks, and flexural shear crack. for TCFRP pier specimen the first crack was observed at 265 kn, under loading the cracks was developed to record failure load at561 kn, while TGFRP pier record first cracking loading at 175 kn with reduction of 51.4% in load as compared with TCFRP pier. The experimental results for the pattern of cracks were shown in Table 5. Crack patterns of FRP piers group are shown in the Figure 8.
Table 5
|
Table 5 The Experimental Results of Tested Pier Specimens at Failure Stage |
|||
|
Piers Symbol |
First crack, Pcr (kN) |
Ultimate
load, Pu (kN) |
Deflection. (mm) |
|
TCFRP |
265 |
561 |
5.24 |
|
TGFRP |
175 |
489.9 |
7.56 |
Figure 8
|
Figure 8 The Crack Pattern at the Failure Stage of Tested FRP Reinforced Piers |
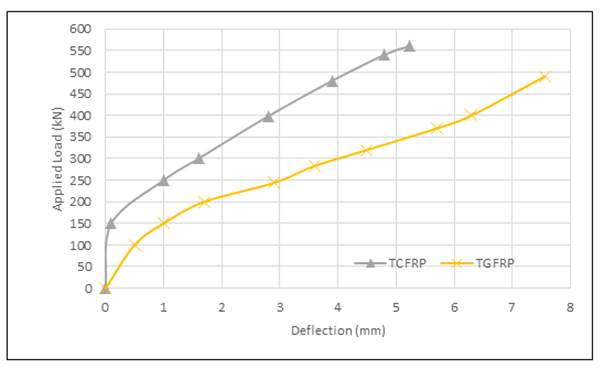
4.3.2. Load-Deflection Curves
The performance of the concrete piers is mainly determined by the load deflection curve. From the results it can be noticed that GC pier had failed by shear at 525 kN. The CFRP pier had an ultimate load that was approximately 6.86% higher than the GC pier. The deflection in the CFRP pier was found to be 32.9% lower than that of the GC pier at the failure stage. The GFRP pier had an ultimate load that was 6.69 less than the GC pier. It was observed that the deflection of the TCFRP pier was 30.7% lower than that of the TGFRP pier at the point of failure. Figure 9, shows the effect of FRP on behaviour of piers.
Figure 9
|
Figure 9 Load-Deflection Curves of Reinforced FRP Piers |
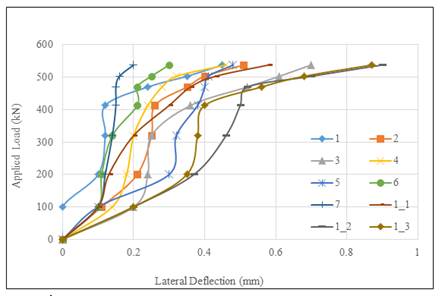
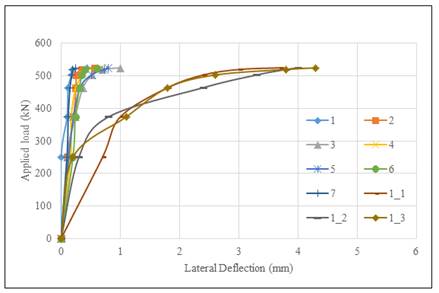
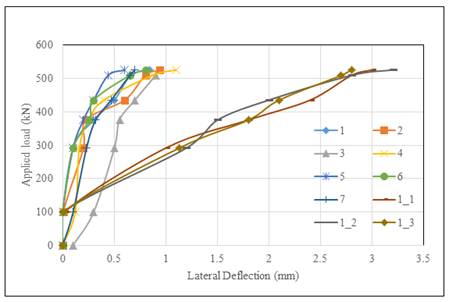
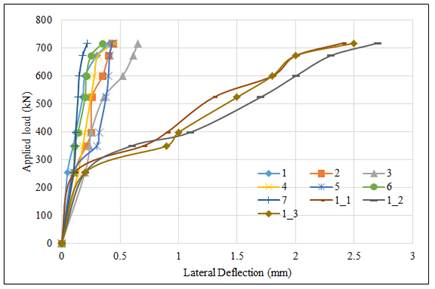
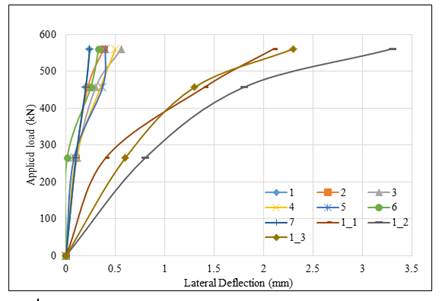
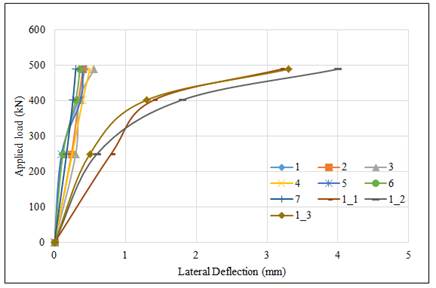
4.4. Concrete Strains
he concrete strain was measured using a Vernier caliper. Ten pairs of demec discs
were utilized during various loading stages to observe the concrete strain, as
shown in Figure 10. Figure 11, Figure 12, Figure 13, Figure 14, Figure 15, Figure 16 display the load-deflection curves for both
longitudinal and lateral directions for all the piers.
Figure
10
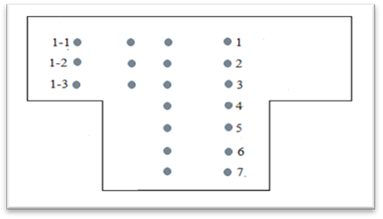
|
Figure 10 Arrangement of Demec Point |
Figure
11
|
Figure 11 Load – Lateral Deflection Behavior of NC Pier Specimen |
Figure
12
|
Figure 12 Load – Lateral Deflection Behavior of GC Specimen |
Figure
13
|
Figure 13 Load – Lateral Deflection Behavior of ARSF Pier Specimen |
Figure
14
|
Figure 14 Load – Lateral Deflection Behavior of AHSC Pier Specimen |
Figure
15
|
Figure 15 Load – Lateral Deflection Behavior of TCFRP Pier Specimen |
Figure
16
|
Figure 16 Load – Lateral Deflection Behavior of TGFRP Pier Specimen |
5. Conclusions
The study emphasized various important aspects of the
philosophy behind green concrete piers. These aspects were identified based on
the results of experiments conducted on reinforced concrete piers as follows:
1) The ultimate load difference between normal concrete and green concrete was minimal, only varying by 2.4%. This slight variation indicates that green concrete is a viable option for various applications.
2) Using recycled steel fiber and high strength concrete in the mix resulted in an 8.95% increase in the ultimate load compared to a pier made with green concrete mix. Additionally, the ultimate load increased by 36.76% when high strength concrete was used.
3) The study showed that the deflection decreased by 32.5% when recycled steel fiber was used, and by 50% when high strength concrete was used, compared to the deflection of the green concrete pier at ultimate load.
4) The result showed that reinforced with GFRP bars decrease ultimate load by 6.69% with increasing of deflection at a rate of 3.2% as compared with a GC pier that reinforced with steel reinforcement.
5) The use of CFRP bars in combination with steel reinforcement resulted in a 6.68% increase in the ultimate load and a 32.9% decrease in deflection compared to a GC pier.
CONFLICT OF INTERESTS
None.
ACKNOWLEDGMENTS
None.
REFERENCES
AASHTO. (2007). AASHTO LRFD Bridge SI Units.
ASTM A615/A615M-15a. (2015). Standard Specification for Deformed and Plain Billet-Steel Bars for Concrete Reinforcement. ASTM International.
ASTM C39/C39M-05. (2004). Standard Test Method for Compressive Strength of Cylindrical Concrete Specimens. ASTM International, 8. https://doi.org/10.1520/C0039_C0039M-18
ASTM D7205/D7205M-06. (2016). Standard Test Method for Tensile Properties of Fiber Reinforced Polymer Matrix Composite Bars. ASTM International, 13.
Bhattacharyya, M. C. R. S. K. (2011). Influence of Field Recycled Coarse Aggregate on Properties of Concrete Bureau of Indian Standards. 205-220. https://doi.org/10.1617/s11527-010-9620-x
Chen, H., Yen, T., & Chen, K. (2003). Use of Building Rubbles as Recycled Aggregates. 33(July 2002), 125-132. https://doi.org/10.1016/S0008-8846(02)00938-9
Denio, R., Yura, J., & Kreger,
M. (1995). Behavior of Reinforced Concrete Pier Caps
Under Concentrated Bearing Loads. Center for Transportation Research,
University of Texas, 7(2).
Iraqi Specification,
No. 45/1984, A. from N. S. for C. and C. (n.d.). وزارة
التخطيط,
الجهاز
المركزي
للتقييس والسيطرة
النوعية.
Iraqi Specification, No. 5/1984, P. C. (n.d.). وزارة التخطيط ,الجهاز المركزي للتقييس والسيطرة النوعية.
Katz, A. (2004). Treatments for the Improvement of Recycled Aggregate. Journal of Materials in Civil Engineering, 16(6), 597-603. https://doi.org/10.1061/(ASCE)0899-1561(2004)16:6(597)
McLeod, G. (1997). Influence of Concrete Strength on the Behaviour of Bridge Pier Caps.
Mjelde, D. G. (2013). Evaluation of Recycled Concrete For Use As Aggregates In New Concrete Pavements (Issue July). Washington State University.
Tu, T. Y., Chen, Y. Y., & Hwang, C. L. (2006). Properties of HPC with recycled aggregates. Cement and Concrete Research, 36(5), 943-950. https://doi.org/10.1016/j.cemconres.2005.11.022
 This work is licensed under a: Creative Commons Attribution 4.0 International License
© Granthaalayah 2014-2024. All Rights Reserved.