ASSESSMENT OF OCCUPATIONAL STRESS AND JOB SATISFACTION AMONG SCHOOL TEACHERS IN SELECTED HIGHER SECONDARY SCHOOLS OF MURSHIDABAD, WEST BENGAL
Sukonna Bhattacharjya 1![]()
![]() ,
Moitreyee Choudhuri 2
,
Moitreyee Choudhuri 2![]()
1 Senior
Tutor, Jiaganj School and College of Nursing, Jiaganj, West Bengal, India
2 Principal,
Government College of Nursing, Rampurhat Government
Medical College and Hospital, Birbhum, West Bengal, India
|
|
|
ABSTRACT |
|
|
Introduction: Occupational stress among teachers results from the working conditions. Stressed out teachers cannot work effectively. Their motivation and job satisfaction are lower, and they exhibit undesirable behaviours. Aim: This study aims to find out school teachers' degree of job satisfaction and occupational stress, to identify correlation between work-related stress, job satisfaction, and association between occupational stress with the selected sociodemographic aspects. Method: In order to ascertain occupational stress and job satisfaction among school teachers in the contemporary, demanding world, the researcher carried out a descriptive survey research on assessment of occupational stress and job satisfaction among teachers in selected higher secondary schools of Murshidabad, West Bengal. The method of non-probability convenience sampling was used to choose 120 school teachers working in selected higher secondary schools of Murshidabad, West Bengal. A semi-structured questionnaire, the Teachers Occupational Stress Scale designed by Sajid Jamal and Abdul Raheem, and the Job Satisfaction Survey created by Paul E. Spector, were used to gather the data. Result: The study result showed that majority of school
teachers (92.5%) had moderate/average degree of occupational stress. Most
of the school teachers (81.66%) had ambivalent level of job
satisfaction. The study also revealed occupational stress and job
satisfaction of school teachers’ have a weakly
negative correlation which was significant. A chi-square test indicated a
significant association between the age of a school teacher
and occupational stress. The study has implications for Nursing Research, Nursing
Administration, Nursing Practice, and Nursing education and it is recommended
for future research study. |
|||
|
Received 18 May 2024 Accepted 30 June 2024 Published 31 July 2024 Corresponding Author Sukonna Bhattacharjya, Sukonna.bhattacharjya1994@gmail.com DOI 10.29121/granthaalayah.v12.i7.2024.5669 Funding: This research
received no specific grant from any funding agency in the public, commercial,
or not-for-profit sectors. Copyright: © 2024 The
Author(s). This work is licensed under a Creative Commons
Attribution 4.0 International License. With the
license CC-BY, authors retain the copyright, allowing anyone to download,
reuse, re-print, modify, distribute, and/or copy their contribution. The work
must be properly attributed to its author.
|
|||
|
Keywords: Occupational Stress, Job Satisfaction |
|||
1. INTRODUCTION
Occupational stress has grown widespread in the teaching profession due to rising occupational complexity and personal financial strain. School teachers face stress during teaching and handling students; in developing countries, intense verbal interactions with students, extended periods of standing, and heavy workloads that put them under a lot of stress. For healthy growth of the personality of teachers, job satisfaction is necessary. Kaur (2011)
According to the World Health Organization (2020), poor design of work, poor organization of work, poor management, unsatisfactory working circumstances, and a lack of support from co-workers and superiors can all contribute to work-related stress.
Now a days teachers job satisfaction need close attention for teachers’ retention as well as promoting well being of teachers and students. The teachers job satisfaction enhance effective teaching and help in school cohesion. Workload, various working condition in the school, teachers perception regarding discipline of students, cooperation of teachers in the schools were some factors that affect job satisfaction among teachers. Toropova et al. (2020).
According to a research from the National Foundation for Educational Research (NFER), 2019 reveals that in compared to other professionals, teachers are subjected to higher levels of job-related stress. The report also states that 1 in 5 (20%) teachers feel stressed in their jobs most of the time, compared to similar professionals (13%).
Teacher Recruitment and Retention Strategy in January, 2019 report from Department for Education (DfE) reveal that teachers work for long hours in a working week as compared to similar professionals. They also claimed that 41% of teachers are dissatisfied with the amount of free time they have, compared to 32% of other professionals in a related area.
So many teachers are leaving their profession as they are burned out and stressed out. Many teachers have lower job satisfaction who cannot manage with the job stress. Seth Woods, Keith Herman and Human Development, and others (2023) conducted a survey on 2300 teachers of Missouri and Oklahoma are asked to rate their job stress and job satisfaction and also asked to how they cope with the situation. It reveals that coping ability or inability of job stress is important factors of teachers burn out and for that reason many teachers leaving the profession.
National Achievement Survey (NAS)-2021 revealed a report that in India 44% school teachers had no adequate work space and 65% school teachers had overload in work. According to Ministry of Education survey (MoE) in 2017 reported that 97% teachers were satisfied in their job and 92% teachers believe in professional development.
2. STATEMENT OF THE PROBLEM
Assessment of occupational stress and job satisfaction among school teachers in selected higher secondary schools of Murshidabad, West Bengal.
3. OBJECTIVES
1) To identify the level of occupational stress among school teachers.
2) To find out the level of job satisfaction among school teachers.
3) To determine the correlation between occupational stress and job satisfaction among school teachers.
4) To find out the association between the level of occupational stress in school teachers and the selected socio demographic variables.
4. METHODOLOGY
The present investigation employed a quantitative survey research approach, utilizing descriptive survey research design to achieve the study's objective. The study was conducted in six Government Higher secondary schools of Murshidabad, West Bengal. The study employed a non-probability convenience sampling technique to pick 120 school teachers from selected Government Higher Secondary schools located in Murshidabad, West Bengal. Teachers of both gender and teachers who were in the teaching profession as Assistant Teacher for at least three years were selected as sample. The research did not include teachers who were not accessible while the data were being collected. Semi-structured questionnaires comprising 12 items were utilized to gather data on demographic variables. The Teachers Occupational Stress Scale, created by Sajid Jamal and Abdul Raheem, had 30 items to measure occupational stress, and the Job Satisfaction Survey, created by Paul E. Spector, had 36 items to determine the degree of job satisfaction among school teachers. Experts from the fields of psychiatry, clinical psychology, and psychiatric (mental health) nursing established the content validity of three tools. The reliability of Semi-structured questionnaire was 1, the original reliability of Teachers’ Occupational Stress Scale was 0.83, in this study reliability was found 0.91 and the original reliability of Job Satisfaction Survey was 0.91, in this study reliability was 0.93. The Institutional Ethics Committee of Murshidabad Medical College and Hospital granted ethical authorization. After providing the required information, each study subject gave their informed consent. The Principal of the Government College of Nursing, the District Inspector of Schools (S.E.), Murshidabad and the Headmaster/Headmistress of selected higher secondary schools in Murshidabad, all provided administrative approval. Data analysis involved the use of both inferential statistics, such as Chi-square and correlation coefficient, and descriptive statistics, such as frequency %, mean, median, and SD. The data were arranged and analysed into five sections: section I findings covered the school teachers' demographic characteristics; section II findings covered their occupational stress level; section III findings covered their job satisfaction level; section IV findings covered the correlation between occupational stress and job satisfaction in school teachers; and section V findings covered the association between the sociodemographic variables that were selected and the level of occupational stress in school teachers.
5. RESULT
Total 120 school teachers were included in the study. Organisation, tabulation, analysis, and interpretation were done on the collected data.
Table 1
|
Table 1 Frequency and Percentage Distribution of Demographic Variables of School Teachers
n=120 |
||
|
Variable |
Frequency |
Percentage (%) |
|
Age (In years) |
||
|
< 35 |
21 |
17.5 |
|
35-45 |
67 |
55.83 |
|
> 45 |
32 |
26.66 |
|
Monthly family income (In Rs.) |
||
|
< 50,000 |
13 |
10.83 |
|
50,000-1,00000 |
100 |
83.33 |
|
> 1,00000 |
7 |
5.83 |
|
Duration of work (In hours) |
||
|
06 |
120 |
100 |
|
Distance of the school from house (In Km.) |
||
|
< 5 |
54 |
45 |
|
≥ 5 |
66 |
55 |
|
Duration of sleep per day (In hours) |
||
|
≤ 5 |
12 |
10 |
|
6-8 |
108 |
90 |
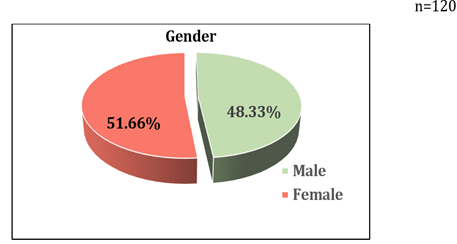
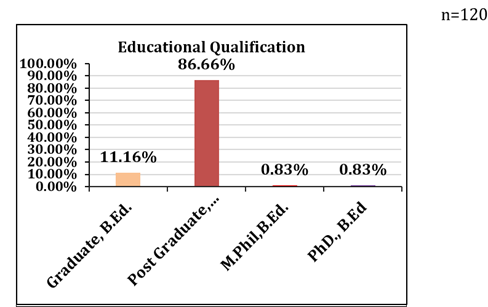
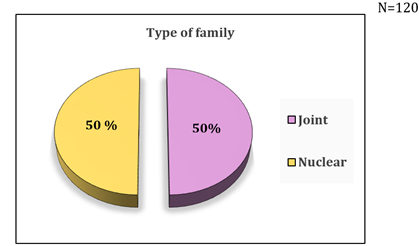
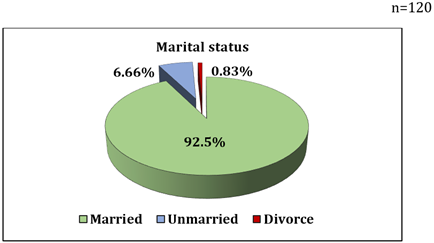
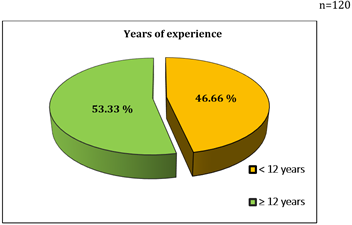
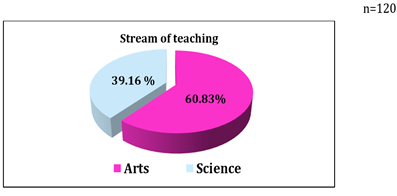
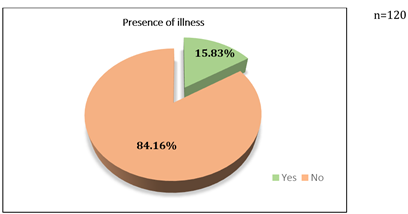
Data revealed in Table 1 shows that 21 (17.5%) teachers belonged to the age of <35 years, 67 (55.83%) teachers belonged to the age group of 35-45 years and 32 (26.66%) teachers belonged to the age of > 45 years. The Monthly family income of 13 (10.83%) teachers were <50,000, 100 (83.33%) teachers monthly family income were in the range of Rs. 50000-10,0000 and 7 (5.83%) teachers monthly family income were >1,00000. Duration of work for all 120 (100%) teachers were 6 hours. Most of the teachers 66 (55%) comes from ≥ 5 Km. to reach school and 54 (45%) comes from ≥ 5 km. to reach school. 108 (90%) teachers slept 6-8 hours per day and 12 (10%) teachers slept ≤ 5 hours per day. Figure 1 shows that 62 (51.66%) school teachers were female and 58 (48.33%) school teachers were male. Figure 2 shows that 14 (11.66 %) school teachers were Graduate with B.Ed., 104 (86.66%) school teachers’ educational qualification were Postgraduate with B.Ed. ,1 (0.83 %) school teacher educational qualification was B.Ed. with M.Phil., 1 (0.83 %) school teacher educational qualification was B.Ed. with PhD. Figure 3 shows that 60 (50%) school teachers belonged to joint family and 60 (50%) school teachers belonged to nuclear family. Figure 4 shows that 111 (92.5%) school teachers were married, 8 (6.66%) school teachers were unmarried and only 1 (0.83%) school teacher was divorced. As seen in Figure 5, 56 (46.66%) of the school teachers had less than 12 years of experience, while 64 (53.33%) had more than 12 years experience. Figure 6 reveals that 73 (60.83%) school teachers stream of teaching were arts and 47 (39.16%) school teachers stream of teaching were science. Figure 7 shows that 101 (84.16%) school teachers’ had no illness and 19 (15.83%) school teachers’ had illness.
Figure 1
|
Figure 1
Pie Diagram
Illustrating Percentage Distribution of School Teachers in Terms of Gender |
Figure 2
|
Figure 2 Bar Diagram Showing Percentage Distribution of Educational Qualification of School Teachers |
Figure 3
|
Figure 3 Pie Diagram Showing Percentage Distribution of School Teachers in Terms of Type of Family |
Figure 4
|
Figure 4 Pie Diagram Showing Percentage Distribution of School Teachers in Terms of Marital Status |
Figure 5
|
Figure 5 Pie Diagram Showing Percentage Distribution of School Teachers in Terms of Experience |
Figure 6
|
Figure 6 Pie Diagram Showing Percentage Distribution of School Teachers in Terms of Stream of Teaching |
Figure 7
|
Figure 7 Pie Diagram Showing Percentage Distribution of School Teachers in Terms of Presence of Illness |
Section II Findings related to level of occupational stress of the school teachers.
Table 2
|
Table 2 Frequency and Percentage Distribution of Level of Occupational Stress Among School Teachers n=120 |
|||
|
Level of occupational stress |
Occupational stress score |
||
|
Range of Z score |
Frequency |
Percentage (%) |
|
|
Extremely High Stress |
+2.01 and above |
Nil |
- |
|
High Stress |
+1.26 to +2.00 |
Nil |
- |
|
Above Average Stress |
+0.51 to +1.25 |
09 |
7.5 |
|
Average Stress/Moderate Stress |
-0.50 to +0.50 |
111 |
92.5 |
|
Low stress |
- 0.51 to -1.25 |
Nil |
- |
|
Very low stress |
-1.26 to -2.00 |
Nil |
- |
|
Extremely low stress |
-2.01 and below |
Nil |
- |
Data presented in Table 2 shows that among 120 participants 111 (92.5 %) had average/moderate occupational stress and 9 (7.5%) had above average occupational stress.
Table 3
|
Table 3 Frequency and Percentage Distribution of the Level of Occupational Stress of School Teachers in Relation to Work load n = 120 |
|||
|
Level of occupational stress (Work load related stress) |
Occupational stress score |
||
|
Range of Z score |
Frequency |
Percentage (%) |
|
|
Extremely High Stress |
+2.01 and above |
Nil |
- |
|
High Stress |
+1.26 to +2.00 |
Nil |
- |
|
Above Average Stress |
+0.51 to +1.25 |
59 |
49.16 |
|
Average Stress/Moderate Stress |
-0.50 to +0.50 |
60 |
50 |
|
Low stress |
- 0.51 to -1.25 |
01 |
0.83 |
|
Very low stress |
-1.26 to -2.00 |
Nil |
- |
|
Extremely low stress |
-2.01 and below |
Nil |
- |
Data presented in Table 3 shows that 59 (49.16%) school teachers had above average occupational stress, 60 (50 %) had average/moderate occupational stress and 1 (0.83%) had low stress due to excessive workload.
Table 4
|
Table 4 Frequency and Percentage Distribution of the Level of Occupational Stress of School Teachers in Relation to Students’ Misbehavior n = 120 |
|||
|
Level of occupational stress (Students’ misbehaviour related stress) |
Occupational stress score |
||
|
Range of Z score |
Frequency |
Percentage (%) |
|
|
Extremely High Stress |
+2.01 and above |
Nil |
- |
|
High Stress |
+1.26 to +2.00 |
07 |
5.83 |
|
Above Average Stress |
+0.51 to +1.25 |
10 |
8.33 |
|
Average Stress/Moderate Stress |
-0.50 to +0.50 |
94 |
78.33 |
|
Low stress |
- 0.51 to -1.25 |
09 |
7.5 |
|
Very low stress |
-1.26 to -2.00 |
Nil |
- |
|
Extremely low stress |
-2.01 and below |
Nil |
- |
Data presented in Table 4 shows that 7 (5.83%) school teachers had high stress, 10 (8.33%) had above average stress, 94 (78.33%) teachers had average stress and 9 (7.5%) teachers had low stress due to students’ misbehaviour.
Table 5
|
Table 5 Frequency and Percentage Distribution of the Level of Occupational Stress of School Teachers n = 120 |
|||
|
Level of occupational stress (Lack of professional recognition related stress) |
Occupational stress score |
||
|
Range of Z score |
Frequency |
Percentage (%) |
|
|
Extremely High Stress |
+2.01 and above |
Nil |
- |
|
High Stress |
+1.26 to +2.00 |
Nil |
- |
|
Above Average Stress |
+0.51 to +1.25 |
28 |
23.33 |
|
Average Stress/Moderate Stress |
-0.50 to +0.50 |
90 |
75 |
|
Low stress |
- 0.51 to -1.25 |
02 |
1.66 |
|
Very low stress |
-1.26 to -2.00 |
Nil |
- |
|
Extremely low stress |
-2.01 and below |
Nil |
- |
Data presented in Table 5 shows that 28 (23.33%) school teachers had above average stress, 90 (75%) had average stress and 2 (1.66%) had low stress due to lack of professional recognition.
Table 6
|
Table 6 Frequency and Percentage Distribution of the Level of Occupational Stress of School Teachers in Relation to Lack of Classroom Resources n = 120 |
|||
|
Level of occupational stress (Lack of classroom resources
related stress) |
Occupational stress score |
||
|
Range of Z score |
Frequency |
Percentage (%) |
|
|
Extremely High Stress |
+2.01 and above |
Nil |
- |
|
High Stress |
+1.26 to +2.00 |
01 |
0.83 |
|
Above Average Stress |
+0.51 to +1.25 |
34 |
28.33 |
|
Average Stress/Moderate Stress |
-0.50 to +0.50 |
84 |
70 |
|
Low stress |
- 0.51 to -1.25 |
01 |
0.83 |
|
Very low stress |
-1.26 to -2.00 |
Nil |
- |
|
Extremely low stress |
-2.01 and below |
Nil |
- |
Data presented in Table 6 shows that 1 (0.83%) school teacher had high stress, 34 (28.33%) school teachers had above average stress, 84 (70%) had average/moderate occupational stress and 1 (0.83%) had low stress related to lack of classroom resources.
Table 7
|
Table 7 Frequency and Percentage Distribution of the Level of Occupational Stress of School Teachers Related to Poor Colleague Relations n = 120 |
|||
|
Level of occupational stress (Poor colleague relations related stress) |
Occupational stress score |
||
|
Range of Z score |
Frequency |
Percentage (%) |
|
|
Extremely High Stress |
+2.01 and above |
Nil |
- |
|
High Stress |
+1.26 to +2.00 |
Nil |
- |
|
Above Average Stress |
+0.51 to +1.25 |
04 |
3.33 |
|
Average Stress/Moderate Stress |
-0.50 to +0.50 |
65 |
54.16 |
|
Low stress |
- 0.51 to -1.25 |
41 |
34.16 |
|
Very low stress |
-1.26 to -2.00 |
10 |
8.33 |
|
Extremely low stress |
-2.01 and below |
Nil |
- |
Data presented in Table 7 shows that 4 (3.33 %) school teachers had above average stress, 65 (54.16 %) had average/moderate occupational stress, 41 (34.16%) had low stress and 10 (8.33%) had very low stress due to poor colleague relations.
Table 8
|
Table
8 Range,
Mean, Mean Percentage, Median, SD of Occupational Stress of School Teachers
n = 120 |
|||||
|
Variables |
Range* |
Mean |
Mean percentage (%) |
Median |
SD |
|
Occupational Stress |
65-89 |
77.26 |
51.51 |
77 |
5.96 |
Data presented in Table 8 shows that obtained range of occupational stress was from 65-89, the calculated mean was 77.26, median was 77. Thus from the obtained data we can interpret that occupational stress of school teachers were normally distributed with mild skewness (0.08). Calculated SD was 5.96, the occupational stress level were moderately dispersed.
Table 9
|
Table 9 Range, Mean, Mean Percentage, Median, SD, Rank of Dimensions of Occupational Stress of School Teachers n = 120 |
||||||
|
Dimension of occupational stress |
Range |
Mean |
Mean percentage (%) |
Median |
SD |
Rank |
|
Work Load |
14-25 |
20.05 |
66.86 |
20 |
2.51 |
1 |
|
Students’ Misbehaviour |
08-26 |
15.97 |
53.25 |
16 |
3.31 |
2 |
|
Lack of professional Recognition |
09-20 |
14.98 |
49.94 |
15 |
2.27 |
4 |
|
Lack of Classroom Resources |
08-22 |
15.22 |
50.75 |
15 |
2.85 |
3 |
|
Poor Colleague Relation |
06-20 |
11.02 |
36.75 |
12 |
3.13 |
5 |
Data presented in Table 9 interpreted that occupational stress of the school teachers in the area of work load was high as compared with colleague relation.
Section – III Findings related to level of job satisfaction of school teachers.
Table 10
|
Table 10 Frequency and Percentage Distribution of the Level of Job Satisfaction Among School Teachers n=120 |
|||
|
Level of Job Satisfaction |
Range of score |
Frequency |
Percentage (%) |
|
Satisfaction |
144-216 |
19 |
15.83 |
|
Ambivalent |
108-144 |
98 |
81.66 |
|
Dissatisfaction |
36-108 |
3 |
2.5 |
Data presented in Table10 shows that among 120 participants 19 (15.83%) school teachers were satisfied in their job, 98 (81.66 %) had school teachers had ambivalent level of job satisfaction and 3 (2.5%) school teachers were dissatisfied.
Table 11
|
Table 11 Frequency and Percentage Distribution of the Level of Job Satisfaction Among School Teachers Related to Scale of Job Satisfaction n=120 |
||||||
|
Scale of Job Satisfaction |
Satisfaction Ambivalent Dissatisfaction
|
|||||
|
Frequency |
Percentage (%) |
Frequency |
Percentage (%) |
Frequency |
Percentage (%) |
|
|
Pay |
27 |
22.5 |
41 |
34.16 |
52 |
43.33 |
|
Promotion |
Nil |
- |
Nil |
- |
120 |
100 |
|
Supervision |
98 |
81.66 |
11 |
9.16 |
11 |
9.16 |
|
Fringe Benefits |
15 |
12.5 |
38 |
31.66 |
67 |
55.83 |
|
Contingent Rewards |
28 |
23.33 |
44 |
36.66 |
48 |
40 |
|
Operating condition |
7 |
5.83 |
51 |
42.5 |
62 |
51.66 |
|
Co-workers |
106 |
88.33 |
8 |
6.66 |
6 |
5 |
|
Nature of work |
110 |
91.66 |
10 |
8.33 |
Nil |
- |
|
Communication |
95 |
79.16 |
23 |
19.16 |
2 |
1.66 |
Data presented in Table 11 depict that 52 (43.33 %) school teachers had dissatisfaction, 41 (34.16 %) had ambivalent level of satisfaction and 27 (22.5%) were satisfied in their job related to pay. It also shows that due to promotion, all teachers i.e. 120 (100%) had dissatisfaction due to promotion. It also shows that 98 (81.66%) school teachers were satisfied, 11 (9.16%) had ambivalent level of job satisfaction and 11 (9.16%) were dissatisfied due to supervision. It also depicts that 67 (55.83 %) school teachers were dissatisfied, 38 (31.66%) had ambivalent level of job satisfaction and 15 (12.5%) were satisfied due to fringe benefits. It also shows that 48 (40 % ) were dissatisfied , 44 (36.66%) were in ambivalent level of job satisfaction and 28 (23.33%) were satisfied due to contingent rewards. It also shows that 62 (51.66 %) school teachers were dissatisfied, 51 (42.5%) had ambivalent level of job satisfaction, 7 (5.83%) were satisfied due to operating condition. It also shows that 106 (83.33 %) school teachers were satisfied, 8 (6.66%) school teachers were in ambivalent level of job satisfaction and 6 (5%) had dissatisfaction related to co-workers. It also shows that 110 (91.66 %) school teachers were satisfied and 10 (8.33%) had ambivalent level of job satisfaction related to nature of work. It also shows that 95 (79.16 %) school teachers were satisfied, 23 (19.16%) had ambivalent level of job satisfaction and 2 (1.66%) were dissatisfied due to communication.
Table 12
|
Table 12 Range, Mean, Mean Percentage, Median, SD of Job Satisfaction Level of School Teachers n=120 |
|||||
|
Variable |
Range* |
Mean |
Mean percentage (%) |
Median |
SD |
|
Job satisfaction |
101-163 |
130 |
60.18 |
129.5 |
12.63 |
Data presented in Table 12 shows that obtained range of job satisfaction was from 101-163. The calculated mean was 130, median was 129.5. Thus from the obtained data we can interpret that job satisfaction of school teachers were normally distributed with mild skewness (0.29). Calculated SD was 12.63, the job satisfaction level was moderately dispersed.
Table 13
|
Table 13 Range, Mean, Mean Percentage, Median, SD, Rank of Scale of Job Satisfaction Level of School Teacher n =120 |
||||||
|
Scale of Job satisfaction |
Range |
Mean |
Mean percentage (%) |
Median |
SD |
Rank |
|
Pay |
05-21 |
12.22 |
50.93 |
12 |
3.85 |
5 |
|
Promotion |
04-06 |
4.85 |
20.2 |
5 |
0.63 |
9 |
|
Supervision |
06-24 |
19.97 |
83.22 |
21 |
4.65 |
2 |
|
Fringe benefits |
04-19 |
10.35 |
43.12 |
11 |
4.07 |
8 |
|
Contingent rewards |
06-18 |
12.2 |
50.86 |
13 |
3.43 |
6 |
|
Operating conditions |
05-20 |
11.47 |
47.81 |
11 |
2.93 |
7 |
|
Co-workers |
08-24 |
19.73 |
82.22 |
20 |
3.56 |
3 |
|
Nature of work |
13-24 |
20.98 |
87.43 |
22 |
2.93 |
1 |
|
Communication |
09-24 |
18.2 |
75.86 |
18 |
3.05 |
4 |
Data presented in Table 13 interpreted that job satisfaction of the school teachers in the area of nature of work was good as compared with promotion in their job.
Section IV Findings related to the correlation between occupational stress and job satisfaction among school teachers which was measured by correlation coefficient.
Table 14
|
Table 14 Correlation Coefficient and “T” Value Between the Level of Occupational Stress and Job Satisfaction n =120 |
||||
|
Variables |
Mean |
Correlation coefficient (r) |
‘t’ value |
P value |
|
Occupational stress |
77.26 |
|||
|
vs |
-0.201 |
2.22* |
0.027 |
|
|
Job satisfaction |
130 |
|||
|
t df (119) 1.9801; p<0.05* |
||||
The relationship between occupational stress and job satisfaction is demonstrated by the data in Table 14, given that the computed r was -0.201, it can be interpreted that there is weak negative correlation between occupational stress and job satisfaction. Thus it can be said that the teacher who had increased occupational stress had decreased job satisfaction. The calculated ‘t’ value of the obtained relationship was 2.22 which is significant at 0.05 level of significance. Therefore, it can be said that the relationship that was found is real and wasn't the result of chance.
Section V Findings related to association between the level of occupational stress in school teachers and the selected socio-demographic variables.
Table 15
|
Table 15 Chi-Square Association Between the Level of Occupational Stress (< Median and ≥ Median) in School Teachers with the Socio-Demographic Variables in Terms of Age, Gender, Type of Family and Monthly Family Income n =120 |
|||||
|
Variables |
Occupational stress |
Total |
Chi-square (ꭓ2) |
P value |
|
|
|
< Md (77) |
≥ Md (77) |
|
|
|
|
Age (In years) |
|||||
|
< 40 |
31 |
20 |
51 |
||
|
≥ 40 |
28 |
41 |
69 |
4.78* |
0.0286 |
|
Gender |
|||||
|
Male |
27 |
31 |
58 |
||
|
Female |
32 |
30 |
62 |
0.30 |
0.5794 |
|
Type of family |
|||||
|
Joint |
30 |
30 |
60 |
||
|
Nuclear |
29 |
31 |
60 |
0.03 |
0.8551 |
|
Monthly family income (In Rs.) |
|||||
|
< 82,000 |
31 |
28 |
59 |
|
|
|
≥ 82,000 |
28 |
33 |
61 |
0.52 |
0.4669 |
|
df = 1 (3.84) p>0.05, p< 0.05 * |
|||||
Data presented in Table 15 depicts Chi-square computed between the age of school teachers and occupational stress was 4.78. At the 0.05 level of significance, the computed chi-square value exceeded the tabular value. At the 0.05 level of significance, the calculated chi-square value is therefore statistically significant. Hence it can be inferred as the age of school teachers is associated with occupational stress. Chi-square computed between the gender of school teachers and occupational stress was 0.30. At the 0.05 level of significance, the computed chi-square value was smaller than the tabular value. At the 0.05 level of significance, the calculated chi-square value is thus not statistically significant. Hence it can be inferred as the gender of school teachers is not associated with occupational stress. The calculated chi-square value between the type of school teacher's family and occupational stress was 0.03. At the 0.05 level of significance, the computed chi-square value was smaller than the tabular value. At the 0.05 level of significance, the calculated chi-square value is thus not statistically significant. Hence it can be inferred as the type of family of school teachers is not associated with occupational stress. Chi-square computed between the monthly family income of school teachers and occupational stress was 0.52. At the 0.05 level of significance, the computed chi-square value was smaller than the tabular value. At the 0.05 level of significance, the calculated chi-square value is thus not statistically significant. Hence it can be inferred as the monthly family income of school teachers is not associated with occupational stress.
Table 16
|
Table
16 Chi-Square Association between
the Level of Occupational Stress (< Median and ≥ Median) in School Teachers with the
Socio-Demographic Variables in Terms of Years of Experience, Distance of the
School from House, Stream of Teaching and Presence of Illness
n
=120 |
|||||
|
Variables |
Occupational stress |
Total |
Chi-square (ꭓ2) |
P value |
|
|
|
< Md (77) |
≥Md (77) |
|
|
|
|
Years of experience |
|||||
|
< 12 |
32 |
24 |
56 |
2.67 |
0.1020 |
|
≥ 12 |
27 |
37 |
64 |
||
|
Distance of the school from
house (In Km.) |
|||||
|
< 5 |
28 |
26 |
54 |
0.28 |
0.5945 |
|
≥ 5 |
31 |
35 |
66 |
|
|
|
Stream of teaching |
|||||
|
Arts |
36 |
37 |
73 |
0.0016 |
0.9676 |
|
Science |
23 |
24 |
47 |
||
|
Presence of illness |
|||||
|
Yes |
11 |
8 |
19 |
|
|
|
No |
48 |
53 |
101 |
0.68 |
0.4068 |
|
df = 1 (3.841) p>0.05 |
|||||
The findings present in the Table 16 depicts that the chi-square calculated between school teachers' years of experience and occupational stress was 2.67. At the 0.05 level of significance, the computed chi-square value was smaller than the tabular value. At the 0.05 level of significance, the calculated chi-square value is thus not statistically significant. Hence it can be inferred as the years of experience of school teachers is not associated with occupational stress. Chi-square calculated between the distance of the school from house and occupational stress was 0.28. With a 0.05 level of significance, the computed chi-square value was smaller than the tabular value. In light of this, the calculated chi-square value is not statistically significant at the 0.05 significance level. Therefore, it can be concluded that occupational stress is not associated to the distance of the school from house. The calculated chi-square value was less than the tabulated value at 0.05 level of significance. Chi-square computed between the stream of teaching and occupational stress was 0.0016. At the 0.05 level of significance, the computed chi-square value was smaller than the tabular value. At the 0.05 level of significance, the calculated chi-square value is thus not statistically significant. Hence it can be inferred as the stream of teaching of school teachers is not associated with occupational stress. Chi-square computed between the presence of illness and occupational stress was 0.68. With a 0.05 level of significance, the computed chi-square value was smaller than the tabular value. In light of this, the calculated chi-square value is not statistically significant at the 0.05 significance level. This suggests that the presence of illness among school teachers is not associated with occupational stress.
Table 17
|
Table 17 Association between the Level of Occupational Stress (< Median and ≥ Median) In School Teachers with the Socio-Demographic Variables in Terms of Educational Qualification, Marital Status and Duration of Sleep Per Day n=120 |
||||
|
Variables |
Occupational stress |
Fisher Exact test |
||
|
< Md (77) |
≥ Md (77) |
Total |
(p-value) |
|
|
Educational qualification |
||||
|
Graduate, B.Ed. |
06 |
08 |
14 |
|
|
Postgraduate, B.Ed.
and above |
53 |
53 |
106 |
0.77 |
|
Marital status |
||||
|
Married |
53 |
58 |
111 |
|
|
Unmarried and divorce |
06 |
03 |
09 |
0.31 |
|
Duration of sleep per day (In hours) |
||||
|
≤ 5 |
07 |
05 |
12 |
|
|
6-8 |
52 |
56 |
108 |
0.55 |
|
df = 1, p>0.05 (Fisher Exact test done) |
||||
The findings
presented in Table
17 shows Fishers
Exact test computed between the educational qualification and occupational
stress was 0.77. Thus the computed Fishers Exact test
value is not statistically significant as the p-value is > 0.05 at 0.05
level of significance. Hence it can be inferred as the educational
qualification among school teachers is not associated
with occupational stress. The Fishers Exact test computed between the marital status
and occupational stress was 0.31. Thus the computed
Fishers Exact test value is not statistically significant as the p-value is
> 0.05 at 0.05 level of significance. Hence it can be inferred as the marital
status of school teachers is not associated with
occupational stress. The Fishers Exact test computed between the duration of
sleep per day and occupational stress was 0.55. Thus
the computed Fishers Exact test value is not statistically significant as the
p-value is > 0.05 at 0.05 level of
significance. Hence it can be inferred as the duration of sleep per day of school teachers is not associated with occupational stress.
6. DISCUSSION
6.1. DISCUSSION RELATED TO OCCUPATIONAL STRESS AMONG SCHOOL TEACHERS
The present study shown that in case of overall occupational stress, 111 (92.5 %) school teachers had average/moderate occupational stress and 9 (7.5%) had above average occupational stress.
Arockiasamy & Subramanian (2021) conducted a study on occupational stress of 200 higher secondary school teachers in Cuddalore district, Tamil Nadu. The study result revealed that 19 % teachers had high occupational stress, 17% teachers experience low stress while most of school teachers i.e. 64% were experiencing moderate stress. The present study is supported by this study as present study result shown that most of the school teachers i.e. 92.5 % experiencing moderate stress.
Murali & Gnanam (2014) conducted a study among 750 school teachers to find out occupational stress in Vellore, Tamilnadu. The study result shown that majority of school teachers i.e. 49.3 % experienced moderate stress where as 25.3 % had high stress and 25.3% also had low stress. In present study the majority of school teachers i.e. 92.5% experience moderate/average stress followed by 7.5 % had above average stress.
Solomon et al. (2017) conducted a study to assess level of stress among 80 higher secondary school teachers in Vellore. The study result shown that majority of teachers (42.5%) had moderate level of stress. The present study result also shown that majority of teachers (92.5%) had moderate/average level of stress.
6.2. DISCUSSION RELATED TO JOB SATISFACTION AMONG SCHOOL TEACHERS
Present study showed that 15.83 % teachers were satisfied, 81.66 % school teachers had ambivalent level of job satisfaction, and 2.5 % school teachers were dissatisfied in their job.
Dey et al. (2016) conducted a study among school teacher to find out overall level of job satisfaction. 140 samples were selected from Secondary schools of Hoogly, West Bengal. The result shows 37.1% teachers were satisfied, maximum school teacher i.e. 59.2% teachers were on the middle and 10.0% teachers were dissatisfied with their job. The present study revealed that 15.83% were satisfied, most of the school teachers i.e. 81.66 % had ambivalent level of job satisfaction and 2.5% school teachers were dissatisfied in their job which is supported by that study.
6.3. DISCUSSION RELATED TO CORRELATION BETWEEN OCCUPATIONAL STRESS AND JOB SATISFACTION OF SCHOOL TEACHERS
The present study showed weak negative correlation (-0.201) was found between occupational stress and job satisfaction among school teachers which clearly depicts if occupational stress increases then job satisfaction will decrease and vise-versa. ‘t’ value was found 2.22 which was greater than the tabulated ‘t’ value 1.9801 at 119 df at 0.05 level of significance which reveals a statistically significant correlation exists between school teachers' occupational stress and job satisfaction.
A research by Kundaragi (2019) on the impact of occupational stress on work satisfaction among 100 private school teachers in Mudalagi, Karnataka, supports the findings of this study. The study result showed negative (-0.464) and significant relationship found between occupational stress and job satisfaction which support the present study result i.e. negative (-0.201) and significant correlation found between occupational stress and job satisfaction.
Similar research on the subject of occupational stress and job satisfaction among 400 teachers in Chennai's government and private schools was carried out by A & JeyaPrabha (2018). The study result reveals negative (-0.7652) and significant relation between occupational stress and job satisfaction among school teachers. The present study result showed negative (-0.201) and significant correlation found between occupational stress and job satisfaction which is supported by that study.
6.4. DISCUSSION RELATED TO ASSOCIATION BETWEEN LEVEL OF OCCUPATIONAL STRESS IN SCHOOL TEACHERS WITH SELECTED SOCIO-DEMOGRAPHIC VARIABLES
The current study findings showed a significant association between school teachers' age and occupational stress. Additionally, the study's findings demonstrated that there was no significant association found with occupational stress of school teachers and gender, type of family, monthly family income, years of experience, distance of the school from house, stream of teaching, presence of illness, educational qualification, marital status and duration of sleep per day.
The current study result was not supported by the findings of the study of Pateel et al. (2019) on assessing stress level among high school teachers of selected Government and Private schools in Bagalkot district. The findings indicated that there was no association between occupational stress and factors such as age, gender, marital status, family type, educational attainment, or years of teaching experience.
7. CONCLUSIONS
The results of this present study conclude that the school teachers (92.5%) had average/moderate occupational stress and 7.5% school teachers had above average stress. In terms of overall level of job satisfaction 81.66% school teachers had ambivalent level of job satisfaction, 15.83 % had ambivalent level of job satisfaction and 2.5 % school teachers were dissatisfied in their job. There were weak negative (-0.201) relationship found between occupational stress and job satisfaction among school teachers. Thus it can be said that the teacher who had increased occupational stress had decreased job satisfaction. The calculated ‘t’ value of obtained relationship (2.22) reveals significant relationship exist between occupational stress and job satisfaction. The occupational stress of school teachers was associated with their age where as no association was discovered with gender, family type, monthly family income, years of experience, distance of the school from house, stream of teaching, presence of illness, educational qualification, marital status and duration of sleep per day.
8. LIMITATION
1) Limited time period for data collection, only calculated sample size was taken, more sample could have taken in order to make generalization
2) Responses were self-reported, bias may be presented.
CONFLICT OF INTERESTS
None.
ACKNOWLEDGMENTS
I acknowledge with gratitude and give thanks to ‘Almighty God’ whose blessing accompanied me throughout the research to make it a success. I would like to extend my sincere gratitude to Prof. Moitreyee Choudhuri, Principal, Government College of Nursing, Rampurhat Government Medical College and Hospital, for her effective guidance, tireless efforts, and insightful suggestions. I expresses my heartiest thanks and sincere gratitude to Prof. Dr. Alpanamayi Bera, Principal ,Govt. College of Nursing, Murshidabad Medical College and Hospital; Mrs. Lipika Mondal, Assistant Professor, Aliah University , Dept. of Nursing; Ms. Helenpuii , Assistant Professor , Gitaram College of Nursing; Prof. Dr. Chandrima Maity, Professor, College of Nursing, Calcutta National Medical College and Hospital; Dr. Sheersanka Das , Medical Officer, Azimganj AG Hospital, Murshidabad for their support and valuable suggestion and guidance during the study. I thanking my parents, sisters and friends for support and provide positivity, insightful comments at times of need during the study.
REFERENCES
A, H. K., & JeyaPrabha, B. (2018). A Study on the Occupational Stress and Job Satisfaction of Teachers of Government & Private Sectors. International Journal of Pure and Applied Mathematics, 118(11), 681-687.
Arockiasamy, S., & Subramanian, P. (2021). Occupational Stress of Higher Secondary School Teachers in Cuddalore District. Journal of Positive School Psychology, 5(2), 240-244.
Dey, R., Pakira, J., & Mohakud, L.L. (2016). Job Satisfaction Among Secondary School Teachers: A Study in Hoogly District of West Bengal. The Scholar, 1(2), 9-18.
Jamal, S., & Raheem, A. (n.d.). Manual for Teacher’s Occupational Stress Scale. National Psychological Corporation.
Kaur, S. (2011). Comparative Study of Occupational Stress among Teachers of Private and Govt. Schools in Relation to their Age, Gender and Teaching Experience. International Journal of Educational Planning & Administration, 1(2), 151-160.
Kundaragi, P.B. (2019). An Effect of Occupational Stress on Job Satisfaction of Private School Teachers. Journal of Management, 7(2), 69-71.
Medhi, R. (2018). Job Satisfaction Among High School Teachers: A Study in the Kamrup District of Assam. International Journal of Research and Analytical Reviews, 5(4), 8-11.
Momin, M.H., & Joshi, S.C. (2019). Study Related to Job Stress of Higher Secondary School Teachers Belonging to Rural Area of Patan District. Think India (Quarterly Journal), 22(3), 2373-2386.
Murali, M., & Gnanam, D. (2014). Occupational Stress of School Teachers. Shanlax International Journal of Education, 39(1), 75-87.
Occupational Health : Stress at the Work Place. (2020, Oct 20).
Parasar, M., Ellawadi, D., Singh, M., & Jiloha, R.C. (2019). Level of Stress Among School Teachers of a School in South Delhi, India. Chrismed Journal of Health and Research, 6(3), 150-155.
Pateel, P. S., Natekar, D. S., Pujari, S. G., S, M., B, M., R, K., H, K., H, L., S, R., P, L., & L, N. (2019). Stress Levels among High School Teachers Working at Selected Government and Private High Schools. International Journal of Innovative Science and Research Technology, 4(6), 657-661.
Paul, E. S. (1994). Job Satisfaction Survey.
Raj, K., Neelopant, S.A., Wadhwa, M., & Dabas, P. (2022). A Cross Sectional Study to Estimate Occupational Stress among Higher Secondary School Teachers in Kerala. National journal of Community Medicine, 13(2),74-78.
Saxena, S., & Manjrekar P. (2020). A Study of Occupational Stress Among School Teachers in Selected Areas of Navi Mumbai. International Journal of Education, Modern Management, Applied Science & Social Science (IJEMMASSS), 2(1),137-143.
Sivakumar, B.N., & Chitra, A. (2017). Impact of Occupational Stress on Job Satisfaction of Private Higher Secondary School Teachers in Salem District. Global Journal for Research Analysis, 6(2), 515-516.
Solomon, A., D., Robinson, D., P., Cathrine, T., R. (2017). Assess the Level of Stress Among School Teachers in Selected Schools at Vellore. International Journal of Development Research, 7(11), 16456-16458.
Teachers Struggling to Manage Stress Report Lower Job Satisfaction: Research. (2023, Apr 11).
Teachers go Through More Stress Than Any Other Professional, Says Study. (2019, Sep 27).
The Financial Work. (2022, May 26).
Toropova, A., Myrberg, E., & Johansson, S. (2020). Teacher Job Satisfaction: The Importance of School Working Conditions and Teacher Characteristics. Educational Review, 73(1),71-97. https://doi.org/10.1080/00131911.2019.1705247
 This work is licensed under a: Creative Commons Attribution 4.0 International License
© Granthaalayah 2014-2024. All Rights Reserved.