Perception, Misconceptions and Satisfaction regarding CHHAYA (Non-hormonal weekly Centchroman Pill) among women within reproductive age group attending Gynecological Out Patient Department in a selected hospital, Kolkata
Ishita Roy 1![]()
![]() ,
Manika Mazumder 2
,
Manika Mazumder 2![]()
![]() ,
Rakhi Ghosh 1
,
Rakhi Ghosh 1
1 Medical
College & Hospital, Kolkata, India
2 Government
College of Nursing, N.R.S Medical College & Hospital, Kolkata-14, India
|
|
|
ABSTRACT |
|
|
Population growth is a serious threat to the
international community and a major obstacle for nation’s social and economic
development, moreover it is one of the biggest problems developing country
like India is facing at the moment and to satisfy the need of contraceptive
as well as to fulfill the undertaking of the 2030 Agenda GOI has introduced ‘Centchroman’, non-hormonal or non-steroid based weekly
pill which is relatively safer and better choice as contraceptive for the
reproductive age women even for breastfeeding women as it has no side-effects
like other steroidal contraceptives. Aim: This study aims to assess the Perception, Misconceptions and
Satisfaction regarding CHHAYA (Non-hormonal weekly Centchroman
Pill) among women within the reproductive age group attending the
Gynecological Out Patient Department in a selected
hospital, Kolkata. Methods: An exploratory survey research was carried out with 115 reproductive
age group women using CHHAYA attending the Gynecological Out
Patient Department in a selected hospital, Kolkata. The Total
enumerative sampling technique was employed to select as subjects and the
Data was collected by using self-developed, validated demographic proforma,
perception assessment scale, misconception rating scale, satisfaction
assessment tool through interviewing technique. Results: The findings revealed that of all these women, 51.30% had positive
perception, 60% had misconceptions and 55.65% respondents were satisfied with
CHHAYA. Statistically a significant relationship was found between the
perception and the satisfaction of the women regarding CHHAYA (‘ρ’=0.61,
‘t’ =8.18, p= 0.0008). Statistically significant association found between
level of perception and partner’s approval (ꭓ2 = 5.94, p =0.01), duration of use (ꭓ2 = 7.65, p =0.005). It has also been
outlined that there was statistically significant association between level
of misconception and the religion (ꭓ2 = 6.94, p =0.008), education level of the women (ꭓ2 = 6.16, p =0.01). It also depicted that
there was statistically significant association between level of satisfaction
and the type of family (ꭓ2 = 8.33, p =0.003), partners approval (ꭓ2 = 4.64, p =0.03), duration of use (ꭓ2 = 8.93, p =0.002). Conclusion: In spite of the fact that
CHHAYA is an effective, inexpensive, easily accessible, lack of stringent
schedule, safe in terms of side-effects like other OCPs, non-interference
with sexual drive, reversible contraceptive method for women who opt for
family planning it is mostly underutilized among contraceptives as there is
negative perception, strong misconceptions, lack of satisfaction. As it is
till now underuse due to insufficient information about it among the women,
so collaborative efforts of proper counselling and follow up can be made by
the health care providers reducing the misconceptions, discontinuation rates
and to sustain compliance to CHHAYA. |
|||
|
Received 10 April
2024 Accepted 15 May 2024 Published 13 June 2024 Corresponding Author Ishita
Roy, ishita.roy94@gmail.com DOI 10.29121/granthaalayah.v12.i5.2024.5643 Funding: This research
received no specific grant from any funding agency in the public, commercial,
or not-for-profit sectors. Copyright: © 2024 The
Author(s). This work is licensed under a Creative Commons
Attribution 4.0 International License. With the
license CC-BY, authors retain the copyright, allowing anyone to download,
reuse, re-print, modify, distribute, and/or copy their contribution. The work
must be properly attributed to its author.
|
|||
|
Keywords: Perception, Satisfaction, Misconception,
CHHAYA |
|||
1. INTRODUCTION
India was the first country to initiate a family planning program yet there are misconceptions prevailing in the society and there is no recognized ‘ideal’ method for contraception and understanding that drive Indian Government implemented various policies to expand the existing basket of choice so that there will be more options to choose from. Park (2021) India is contributing to 17.5% of the world’s population and as the second most populous country in the world next only to China with a population of 1,400.2 million in the year mid-2020. According to United Nations Population Fund (UNFPA) State of World Population report (19.04.2023) on forecast of India’s population is expected to reach 1.4286 billion which 2.9 million more than its neighbor country China with 1.4257 billion. Kadri (2021).
As contraceptive advice is a vital element of good community health and an ideal contraceptive should match an individual’s personal, social and medical requirements since socio-economic factors play an important role in family planning perception, acceptance, and compliance. The underutilization of CHHAYA despite of the fact of being most reliable and safe contraceptive is due to lack of knowledge among women and also health care providers as well as worries about its use. (CSIR) -Central Drug Research Institute (CDRI).
2. BACKGROUND OF THE STUDY
An exploratory study was conducted to assess the knowledge regarding CHHAYA contraceptive pills among 200 married women selected through convenient sampling in urban area of Pune city. The data was collected by using questionnaire on knowledge regarding CHHAYA and the result shows, majority 78.5% of the women were from 18 – 25 years of age and 87% women had average knowledge where 11.5%, 1.5% women had good, poor knowledge regarding CHHAYA respectively. It depicts that there is a dearth of knowledge and wrong perception which making women become resistant to it. Nawale et al. (2021)
A descriptive study was carried out to assess the hardcore myths and misconceptions which inhibits the access of contraceptive services in the urban community in Jamshedpur, India. Data was collected from 500 respondents in those 392 were women and 108 were men, chosen by simple random sampling from the 10 Maternal and Child Health centers in and around Jamshedpur, Jharkhand and interviewed through self-structured questionnaire on awareness, benefits of family planning and myths, misconceptions regarding permanent and temporary methods. The result depicts that 99% women and 100% men are aware of contraceptives but despite of that 49% women and 45% men had adequate knowledge about spacing between pregnancies. 54% women and 51% men do not support OCP as contraceptive as it requires higher compliance and also, they have panic about associated side-effects. Tiwari (2018)
An interventional study to evaluate the efficacy, safety and continuation rate of Centchroman and IUCD after administration within immediate postpartum period. In the above-mentioned study, total 280 women were selected through block randomization with sealed envelope system and divided into two groups that is 140 each delivering in Safdarjung Hospital. In the study, one group of women was inserted PPIUCD (Cu 380A/375) instantly post-placental delivery and one group was given Centchroman (30 mg) orally as per schedule and they were followed up at 6 weeks, 3 months and 6 months in terms of safety, efficacy and continuation rate. As per the result at 3 months and 6 months women were more satisfied in the in comparison to PPIUCD and the causes for dissatisfaction in Centchroman group were lack of motivation 3.57%, both menstrual irregularity and gastritis were 0.71%. The causes for dissatisfaction were pain, menstrual irregularity, psychological issue that was 3.57%, 1.43%, 0.71% respectively. The study also reveals that in terms of safety both contraceptives are safe but in Centchroman group oligomenorrhoea (10%) and in PPIUCD group menorrhagia (10.7%) was the main complaint. Continuation rate was more in Centchroman that is 91.4% than PPIUCD at the end of 6 months and the main reason was its non-hormonal nature and oral intake. The failure rate was 0% in both group but there were cases of spontaneous expulsion in PPIUCD group. As per the discontinuation rate was in PPIUCD group was 5.7% where Centchroman was 5%. The study depicts satisfaction with Centchroman was 95.23% and with PPIUCD was 93.57%.
3. PROBLEM STATEMENT
Perception, Misconceptions and Satisfaction regarding CHHAYA (Non-hormonal weekly Centchroman Pill) among women within reproductive age group attending Gynecological Out Patient Department in a selected hospital, Kolkata.
4. OBJECTIVES OF THE STUDY
1) To assess the perception of the women regarding CHHAYA.
2) To find out the misconceptions of the women about CHHAYA.
3) To assess the level of satisfaction of the women with CHHAYA.
4) To find out the relation between perception and satisfaction of the women about CHHAYA.
5) To find out the association between perception of the women regarding CHHAYA and selected demographic variables.
6) To find out the association between misconception of the women about CHHAYA and selected demographic variables.
7) To find out the association between satisfaction of the women about CHHAYA and selected demographic variables.
5. METHODOLOGY
An Exploratory Survey was conducted in Gynaecology Out Patient Department of Barasat Govt. Medical College and hospital, and College of Medicine and Sagar Dutta Hospital, Kolkata, West Bengal. Following institutional ethics committee approval, Total enumerative sampling technique was adopted to select 115 reproductive age group (18 – 45 years) women who have been using CHHAYA present during data collection, willing to participate in the study with written consent.
Semi-structured Interview Schedule was developed to collect data on demographic characteristics of the reproductive age group women. Perception Assessment Scale was designed as 5-point Likert Scale which is ranged from ‘Strongly Agree’ to ‘Strongly Disagree’ which consists of 20 items in three domains like Cognitive Domain, Social domain and Emotional Domain to assess the perception of the women regarding CHHAYA. The Misconceptions Rating Scale was designed as 3-point scale which is ranged from ‘Agree’ to ‘Disagree’ to assess the misconceptions of the women. The Satisfaction Assessment Scale (based on The ORTHO BC SAT) was designed as 3-point Likert Scale which was ranged from ‘Agree’ to ‘Disagree’ which consists of 7 domains those were ease of use or convenience, symptoms or side effects, menstrual impact, lifestyle impact, compliance or adherence, assurance or confidence, and overall satisfaction. Validity and reliability of the tool was established before final data collection. Content Validity Index (CVI) for Demographic Proforma was 1 and reliability tested through inter-rater method which was 1. CVI of Perception Assessment Scale was 0.92 and reliability tested through Cronbach’s alpha method which was 0.89. CVI of Misconceptions Rating Scale was 1 and reliability was ‘α = 0.89’. CVI of Satisfaction Assessment Scale (based on The ORTHO BC SAT) was 0.94 and reliability was ‘α = 0.89’.
5.1. Data Collection
After obtaining formal permission from the concerning authorities, subjects were selected according to the inclusion criteria. Self-introduction was provided to the subjects for establishing rapport. Purpose of the study was clearly explained to the subjects, informed consent was taken from them and confidentiality of their responses were assured. Separate code no. was given to each subject. Interpersonal relationship was established. Socio-demographic data was collected by interviewing the subjects through Demographic Proforma. Perception of CHHAYA was measured by Perception assessment Scale regarding CHHAYA. Misconception was assessed by Misconceptions rating scale regarding CHHAYA. Satisfaction was measured by Satisfaction assessment scale (based on The ORTHO BC SAT). The data collection was completed by acknowledging the subjects for their participation in the study. Time taken for each interview was 20-30 minutes. The data collection procedure was terminated after thanking each respondent and administration of concerned setting for their kind participation and co-operation.
5.2. Data Analysis
Description of the demographic characteristics, perception, misconceptions and satisfaction regarding CHHAYA among reproductive age group women in Frequency and Percentage distribution, bar, pie diagram. Mean, Median, Standard deviation for perception assessment scale, misconceptions rating scale and satisfaction assessment scale. Computation of Chi-square test to determine the association between perception, misconceptions and satisfaction of the women with CHHAYA and selected demographic variables. Computation of correlation coefficient to determine the relationship between perception and satisfaction of the women regarding CHHAYA. Statistical package for social sciences (SPSS) version 20 and P value of less than 0.05 was considered significant.
6. FINDINGS OF THE STUDY
·
Socio-demographic characteristics of women:
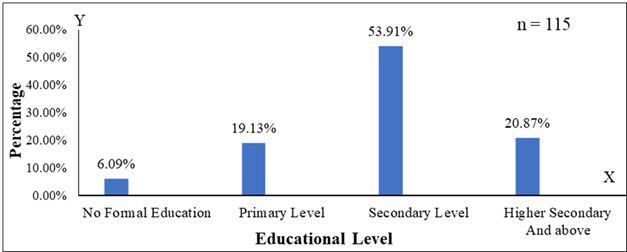
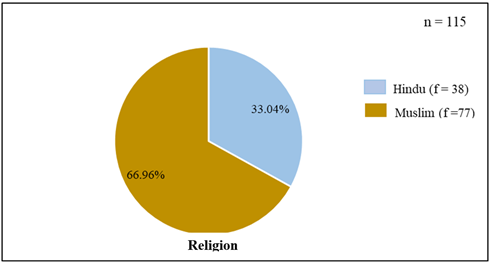
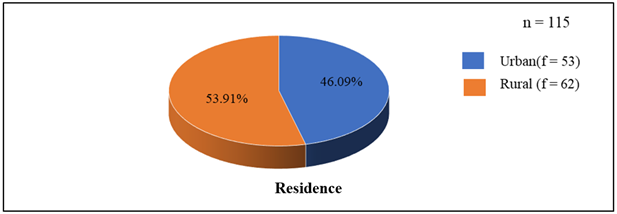
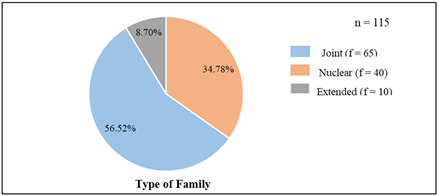
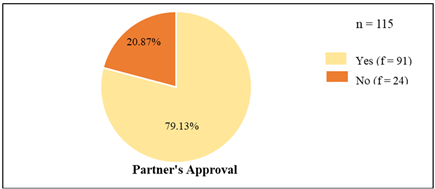
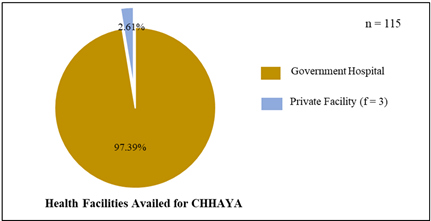
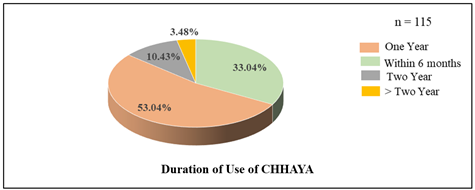
Data depicts (Table 1) that, 45.22%, 42.61%, 12.17% of the women belonged to the age group of 18-24, 25–31, 32-38 years respectively. 83.48%, 4.35%, 12.17% of the women were homemaker, employed, self-employed respectively. 46.96% of respondent adopted CHHAYA under the influence of health care provider whereas 41.74% of them adopted it under self-influence. Data presented in (Figure 1) shows that, 53.91% of the women completed education up to secondary level, whereas 6.09% of respondents had no formal education. Data from (Figure 2) shows that, 66.96% of the women were Muslim, whereas 33.04% of respondents were Hindu. Data depicts (Figure 3) that, 53.91% of the women lived in rural area, whereas 46.09% of respondents resided in urban area. Data presented in (Figure 4) shows that, 56.52% of the women belonged to joint family, whereas 34.78% were from nuclear family and 8.70% of respondents belonged to extended family. Data from (Figure 5) shows that, 79.13% of the women got partner’s approval for using CHHAYA. Data depicts (Figure 6) 97.39% of the women had gone to Government health facilities for receiving CHHAYA whereas only 2.61% of them received CHHAYA from private facility previously. Data presented in (Figure 7) shows that, 53.04% women were using CHHAYA for last one year but 3.48% of respondent were using CHHAYA more than two year.
·
Findings related to Perception of the women
regarding CHHAYA:
The range of perception of women regarding CHHAYA varies from 14 – 74 with a mean of 43.02, median 43 which can be interpretated as the obtained data for level of perception regarding CHHAYA is almost normally distributed with a mild skewness (0.05). The calculated SD for level of perception of women regarding CHHAYA was 7.21 which can be interpretated as the obtained responses were moderately dispersed. (Table 2)
Data in (Table 3) depicts that, 51.30% women had positive perception and 48.70% had negative perception regarding CHHAYA.
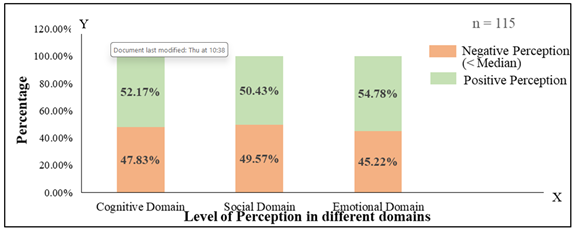
Data presented in (Figure 8) shows that, 52.17% of women had positive cognitive perception and 47.83% of women had negative cognitive perception regarding CHHAYA. It also depicts that, 50.43% of respondent had positive social perception and 49.57% of the women had negative social perception regarding CHHAYA. It shows that, 54.78% of women had positive emotional perception and 45.22% had negative emotional perception regarding CHHAYA.
·
Findings related to Misconception of women
regarding CHHAYA:
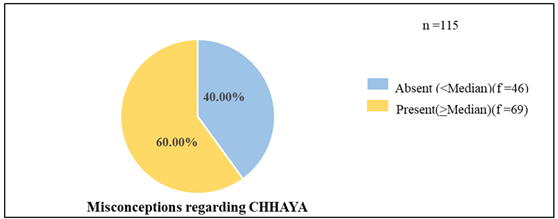
Data shown in (Figure 9) 60% of women had misconceptions regarding CHHAYA, whereas 40 % of the respondents had no misconceptions about CHHAYA.
Data presented in (Table 4) shows that, in the area of use of CHHAYA causing serious side effects like hypertension, weight gain etc. the obtained range was 3- 1 with the calculated mean of 2.42 and SD 0.75, the calculated mean percentage 80.58% and ranked ‘1’. It also shows that, in the area of use of CHHAYA causing amenorrhea resulting in pregnancy or a tumour (method failure) the obtained range was 3- 1 with the calculated mean of 2.31 and SD 0.78, the calculated mean percentage 77.10% and ranked ‘2’. It also depicts that, in the area of use of CHHAYA increases the risk of ectopic pregnancy the obtained range was 3- 1 with the calculated mean of 2.31 and SD 0.87, the calculated mean percentage 77.10% and ranked ‘2’.
·
Findings related to Satisfaction of the women
regarding CHHAYA:
Data from (Table 5) shows that, the range of satisfaction of women regarding CHHAYA varies from 29 – 63 with a mean of 48.28, median 48 which can be interpretated that the obtained data for level of satisfaction regarding CHHAYA was almost normally distributed with a mild skewness (-0.3). The SD calculated for level of satisfaction of women regarding CHHAYA was 6.38 which can be interpretated as the obtained responses were moderately dispersed.
Data presented in (Table 6) shows that, 55.65% were satisfied with CHHAYA and 44.35% of them were dissatisfied with this contraceptive.
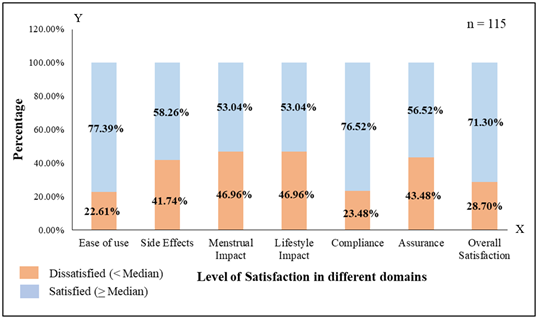
Data from (Figure 10) depicts that, 77.39% of the women were satisfied and 22.61% of them were dissatisfied with CHHAYA in ease-of-use domain. 58.26% of the women were satisfied and 41.74% of them were dissatisfied with CHHAYA in side-effects domain. 53.04% of the women were satisfied and 46.96% of them were dissatisfied with CHHAYA in menstrual impact and lifestyle impact domain. 76.52% of the women were satisfied and 23.48% of them were dissatisfied with CHHAYA in compliance domain. 56.52% of respondent were satisfied and 43.48% of them were dissatisfied with CHHAYA in assurance domain. 71.30% of respondent were satisfied with CHHAYA whereas 28.70% of them were dissatisfied in overall satisfaction domain.
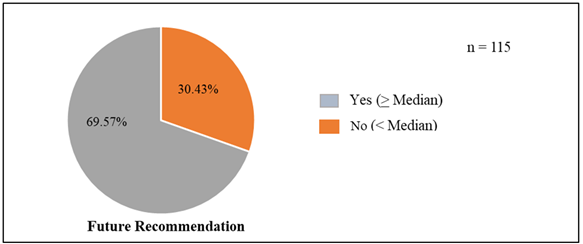
Data shown in (Figure 11) reveals that, 69.57% of the women were willing to recommend CHHAYA to others but 30.43% of them would not recommend it as contraceptive.
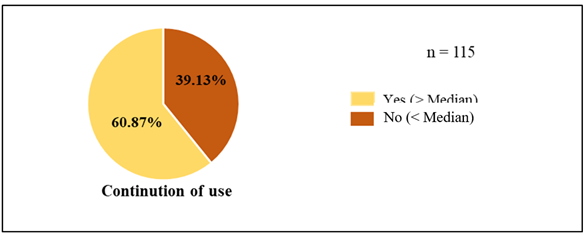
Data presented in (Figure 12) shows that, 60.87% of the women were willing to continue the use CHHAYA but 39.13% of them were not willing to continuation of use.
·
Findings related to Relationship between
level of Perception and Satisfaction:
There was moderate positive correlation between perception and satisfaction of the women regarding CHHAYA as the ‘ρ’ Value calculated was 0.61, which can be interpreted that the respondents with good perception regarding CHHAYA also had satisfaction with the contraceptive. The calculated ‘t’ value of the relationship between level of perception and satisfaction was 8.18 which was significant at 0.0008 level. So, it can be interpretated that the obtained moderate positive correlation between Perception and Satisfaction regarding CHHAYA is a true relationship and not by chance.
·
Findings related to Association between
Demographic Characteristics:
Chi square findings revealed that, there was statistically significant association found between level of perception and partner’s approval (ꭓ2 = 5.94, p =0.01), duration of use (ꭓ2 = 7.65, p =0.005). It has also been outlined that there was statistically significant association between level of misconception and the religion (ꭓ2 = 6.94, p =0.008), education level of the women (ꭓ2 = 6.16, p =0.01). It also depicted that there was statistically significant association between level of satisfaction and the type of family (ꭓ2 = 8.33, p =0.003), partners approval (ꭓ2 = 4.64, p =0.03), duration of use (ꭓ2 = 8.93, p =0.002).
7. DISCUSSION
·
Discussion related to socio-demographic
characteristics of women using CHHAYA
The present study revealed that 45.22% of the women using CHHAYA belonged to the age group of 18 – 24 years and 42.61% of them were aged between 25 – 31 years. The similar findings were also noted in a study by Doke & Kamda (2019) which reveals 76.02% of the acceptors of CHHAYA belonged to the age group of 20-30 years.
The findings also depicted that 79.13% of the women got partner’s approval for using CHHAYA which was supported by the findings by Ndikom CM, Ojo OC, and Ogbeye GB. that 72.1% of the participants got partner’s approval for using contraceptives.
·
Findings regarding perception of women
regarding CHHAYA
The results of the present study revealed that 51.30% women had positive perception and 48.70% had negative perception regarding CHHAYA. The findings were supported by a study conducted by Hayat et al. (2021) which depicted that though the participants had good knowledge (81.81%) regarding contraceptives yet 3% women preferred oral contraceptives especially the modern methods as they had negative perception (Societal Perception mean = 2.09, Cultural perception mean = 1.8 and Cognitive Perception mean = 2.4) towards this.
The findings of present study also revealed that 52.17% of women had positive cognitive perception and 47.83% of women had negative cognitive perception, 50.43% of respondent had positive social perception and 49.57% of the women had negative societal perception. 54.78% of women had positive emotional perception and 45.22% had negative emotional perception regarding CHHAYA. This is supported by the study undertaken by Nawale et al. (2021) which revealed that 87% women had average knowledge where 11.5%, 1.5% women had good, poor knowledge regarding CHHAYA respectively. Another study by different findings Vinish et al. (2020) reasons for non-utilization of contraceptive were poor knowledge (25.3%), religious perceptions (19.2%) in majority of the participants.
·
Findings regarding misconception of women
regarding CHHAYA
The present study discovered that 60% of women had misconceptions regarding CHHAYA, whereas 40 % of the respondents had no misconceptions about CHHAYA. A similar finding noted in the study by Davis (2019) maximum that was 49.89% of the women were fraught with misconceptions about any form of contraception. The present study outlined that in the area of use of CHHAYA causing serious side effects like hypertension, weight gain etc., amenorrhea resulting in pregnancy or a tumour (method failure), increases the risk of ectopic pregnancy, alteration in sexual drive the calculated mean and mean percentage was respectively 2.42 & 80.58%, 2.31 & 77.10%, 2.31 & 77.10% and 1.65 & 55.07%. The similar findings were found in the study by Jogia et al. (2016) that OCPs cause impairment to the fetus (21.4%), decreases the sexual drive (16.6%), basis for infertility, abortion, multiple births which is respectively 16.6%, 9.5%, 4.7%. This finding was supported by the study conducted by Alameer et al. (2022) majority of the women that is 91.3% had concern about hormonal imbalance due to OCP and 59.3%, 46.8% were anxious about infertility, cancer respectively.
·
Findings regarding satisfaction of women with
CHHAYA
The results also showed that 77.39% of the women were satisfied and 22.61% of them were dissatisfied with CHHAYA in ease-of-use domain, the similar findings found in the study carried out by Alameer et al. (2022) outlined that 84.4% of the women were pleased with the availability, 83.7% with the ease of use regarding contraceptive. The findings also presented that 58.26% of the women were satisfied and 41.74% of them were dissatisfied with CHHAYA in side-effects domain and 53.04% of the women were satisfied and 46.96% of them were dissatisfied with CHHAYA in menstrual impact and lifestyle impact domain which was also supported by the study findings of Nair & Jayasimha (2016) that the main cause of discontinuation of Centchroman was menstrual irregularity which was seen in 45% subjects where delayed cycle was seen in 26% subjects, scanty flow in 12% of the participants. The study outlined that 76.52% of the women were satisfied and 23.48% of them were dissatisfied with CHHAYA in compliance domain, 56.52% of respondents were satisfied and 43.48% of them was dissatisfied with CHHAYA in assurance domain, 71.30% of respondent were satisfied with CHHAYA whereas 28.70% of them were dissatisfied in overall satisfaction domain. The similar findings also noted in the study conducted by Gupta et al. (2021) and Agarwal et al. (2020) that satisfaction with Centchroman was 95.23% and 77.5% respectively.
·
Findings related to association between
perception, misconception and satisfaction of women with CHHAYA and selected
demographic variables
The present study outlined that there is statistically significant association between level of perception of the women and their partner’s approval for using CHHAYA (ꭓ2 = 5.94, p =0.01 at df = 1) and duration of use of CHHAYA (ꭓ2 = 7.65, p =0.005 at df = 1) at 0.05 level of significance. Identical findings noted in the study by Hayat et al. (2021) that there is significant difference in perception of contraceptive among women with partner’s approval, religious preferences and family decision. The findings of the present study revealed that there is a statistically significant association between level of satisfaction of the women with CHHAYA and the type of family of the respondents (ꭓ2 = 8.33, p =0.003 at df = 1), partners approval for CHHAYA (ꭓ2 = 4.64, p =0.03 at df = 1), duration of use of CHHAYA (ꭓ2 = 8.93, p =0.002 at df = 1) at 0.05 level of significance. Similar findings were also observed in the study conducted by Ndikom CM, Ojo OC, and Ogbeye GB. that the satisfaction had a significant association with partner’s approval (P = 0.038) and satisfaction with contraceptive methods.
8. CONCLUSION
The findings of the study also outlined that there was negative perception, strong misconceptions, lack of satisfaction regarding CHHAYA despite of its safety profile and dosing schedule. Although the awareness of contraceptive methods has been raised, there are still various constraints which interferes with the use of those methods so, the service providers in every aspect must be aware about those and consistent efforts must be made to increase acceptability and satisfaction with contraceptive methods which has an impact on uptake, adherence and continuation of contraceptive.
9. LIMITATION
The limitations of present study are, it restricts board generalization as it was conducted with small sample of two hospitals of West Bengal. The study was limited to only subjective data obtained from individual subjects that may lead to bias and insufficient information.
10. ANNEXURE
Table 1
|
Table 1 Frequency and Percentage Distribution of Demographic Characteristics of Women in Reproductive Age Group Using CHHAYA |
||
|
Variables |
Frequency (f) |
Percentage (%) |
|
Age (in years) |
||
|
18-24 |
52 |
45.22 |
|
25-31 |
49 |
42.61 |
|
32-38 |
14 |
12.17 |
|
Occupational Status |
||
|
Homemaker |
96 |
83.48 |
|
Employed |
5 |
4.35 |
|
Self-employed (Business) |
14 |
12.17 |
|
Influencer for adoption |
||
|
Health care provider |
54 |
46.96 |
|
The wife herself |
48 |
41.74 |
|
Spouse |
9 |
7.83 |
|
Relatives, family member |
4 |
3.48 |
Figure 1
|
Figure 1 Bar Diagram Showing the Education Level of Women Using CHHAYA |
Figure 2
|
Figure 2 Pie Diagram Showing the Religion of Women Using CHHAYA |
Figure 3
|
Figure 3 Pie Diagram Showing the Residence of Women Using CHHAYA |
Figure 4
|
Figure 4 Pie Diagram Showing the Type of Family of the Women Using CHHAYA |
Figure 5
|
Figure 5 Pie Diagram Showing the Partner’s Approval of the Women for Using CHHAYA |
Figure 6
|
Figure 6 Pie Diagram Showing the Health Care Facilities Availed for CHHAYA by the Women |
Figure 7
|
Figure 7 Pie Diagram Showing the Duration of Using CHHAYA by the Women |
Table 2
|
Table 2 Assessment of the Perception of the Women Regarding CHHAYA n=115 |
||||
|
Variable |
Obtained Range |
Mean |
Median |
SD |
|
Level of Perception |
14 - 74 |
43.02 |
43 |
7.21 |
|
Maximum possible score – 80 Minimum possible score – 0 |
||||
Table 3
|
Table 3 Findings Related to the Level of Perception of the Women Regarding CHHAYA
n=115 |
|||
|
Level of Perception |
Frequency(f) |
Percentage (%) |
|
|
Negative (< Median) |
<43 |
56 |
48.70% |
|
Positive (> Median) |
>43 |
59 |
51.30% |
Figure 8
|
Figure 8 Composite Bar Diagram Showing the Level of Perception (Domain Wise) of the Women Regarding CHHAYA |
Figure 9
|
Figure 9 Pie Diagram Showing Misconception of the Women Regarding CHHAYA |
Table 4
|
Table 4 Statement Wise Rank Order of Misconception of the Women Regarding CHHAYA
n=115 |
|||||
|
Area |
Range* |
Mean |
SD |
Mean% |
Rank |
|
3- 1 |
2.2 |
0.83 |
73.33% |
5 |
|
|
Birth defects to the foetus |
3- 1 |
1.84 |
0.77 |
61.45% |
10 |
|
Amenorrhea (pregnancy or
tumour) |
3- 1 |
2.31 |
0.78 |
77.10% |
2 |
|
Serious side effects |
3- 1 |
2.42 |
0.75 |
80.58% |
1 |
|
Menstrual Irregularities |
3- 1 |
2.05 |
0.84 |
68.41% |
8 |
|
Abnormality in female
genital tract |
3- 1 |
1.77 |
0.84 |
58.84% |
11 |
|
Alteration in sexual drive |
3- 1 |
1.65 |
0.86 |
55.07% |
12 |
|
Ectopic pregnancy |
3- 1 |
2.31 |
0.87 |
77.10% |
2 |
|
Permanent sterility |
3- 1 |
2.21 |
0.84 |
73.62% |
4 |
|
Abortion |
3- 1 |
2.1 |
0.74 |
69.86% |
7 |
|
Cancer of reproductive
organs |
3- 1 |
2.11 |
0.92 |
70.43% |
6 |
|
Stunts the growth and
development of the child. |
3- 1 |
1.96 |
0.88 |
65.22% |
9 |
|
* Obtained Range |
|||||
Table 5
|
Table 5 Assessment of the Satisfaction of the Women Regarding CHHAYA n=115 |
||||
|
Variable |
Obtained Range* |
Mean |
Median |
SD |
|
Level of Satisfaction |
29 - 63 |
48.28 |
48 |
6.38 |
|
Maximum possible score – 69 Minimum possible score – 23 |
||||
Table 6
|
Table 6 Findings Related to the Level of Satisfaction of the Women with CHHAYA n=115 |
|||
|
Level of Satisfaction |
Score |
Frequency(f) |
Percentage (%) |
|
Dissatisfied (< Median) |
< 48 |
51 |
44.35% |
|
Satisfied (>
Median) |
> 48 |
64 |
55.65% |
Figure 10
|
Figure 10 Composite Bar Diagram Showing the Level of Satisfaction of the Women Regarding CHHAYA in Different Domains |
Figure 11
|
Figure 11 Pie Diagram Showing the Willingness of the Women to Recommend CHHAYA to others in Overall Satisfaction Domain |
Figure 12
|
Figure 12 Pie Diagram Showing the Willingness of the Women to Continue use of CHHAYA in Overall Satisfaction Domain |
Table 7
|
Table 7 Relationship Between Level of Perception and Satisfaction of the Women Regarding CHHAYA n = 115 |
|||||
|
Variables |
Mean |
SD |
‘ρ’
Value |
‘t’
Value |
p
value |
|
Perception |
43.02 |
7.21 |
|
|
|
|
vs |
0.61 |
8.18* |
0.0008* |
||
|
Satisfaction |
48.28 |
6.38 |
|||
|
‘t’ df
(113) = 1.96, p<0.05 level of significance, (*Significant) |
|||||
Table 8
|
Table 8 Association Between Level of Perception of the Women Regarding CHHAYA and Selected Demographic Variables n =115 |
||||
|
Variables |
Level
of Perception |
χ2
Value |
p
value |
|
|
<
median |
>
median |
|||
|
Partner’s
Approval |
||||
|
Yes |
39 |
52 |
5.94* |
0.01 |
|
No |
17 |
7 |
||
|
Duration
of use |
||||
|
<6 months |
20 |
8 |
7.65* |
0.005 |
|
>6
months |
36 |
51 |
||
|
Age
(in years) |
||||
|
<24 |
28 |
24 |
1.007 |
0.3 |
|
>24 |
28 |
35 |
||
|
Education
Level |
||||
|
<Secondary |
41 |
50 |
2.31 |
0.1 |
|
>Secondary |
15 |
9 |
||
|
ꭓ2 df (1) = 3.84, p<0.05 level of
significance, (*Significant) |
||||
Table 9
|
Table 9 Association Between Level of Misconception of the Women Regarding CHHAYA and Selected Demographic Variables |
||||
|
Variables |
Level
of Misconception |
χ2
Value |
p
value |
|
|
<
median |
>
median |
|||
|
Age
(in years) |
||||
|
<24 |
22 |
30 |
1.15 |
0.2 |
|
>24 |
33 |
30 |
||
|
Religion |
||||
|
Hindu |
18 |
7 |
6.94* |
0.008 |
|
Muslim |
38 |
52 |
||
|
Education
Level |
||||
|
<Secondary |
18 |
8 |
6.16* |
0.01 |
|
>Secondary |
37 |
52 |
||
|
Duration
of use |
||||
|
< 6 months |
21 |
17 |
1.25 |
0.2 |
|
>6
months |
34 |
43 |
||
|
ꭓ2 df
(1) = 3.84, p<0.05 level of significance, (*Significant) |
||||
Table 10
|
Table 10 Association Between Level of Satisfaction of the Women with CHHAYA and Selected Demographic Variables n = 115 |
|||||
|
Variables |
χ2 Value |
p value |
df |
||
|
< median |
> median |
||||
|
Age
(in years) |
|||||
|
<24 |
21 |
31 |
0.6 |
0.4 |
1 |
|
>24 |
30 |
33 |
|||
|
Type
of family |
|||||
|
Nuclear |
13 |
27 |
8.33* |
0.003 |
1 |
|
Joint |
8 |
67 |
|||
|
Partner’s
Approval |
|||||
|
Yes |
41 |
50 |
4.64* |
0.03 |
1 |
|
No |
5 |
19 |
|||
|
Duration
of use- |
|||||
|
<6 months |
16 |
35 |
8.93* |
0.002 |
1 |
|
>6
months |
38 |
26 |
|||
|
ꭓ2 df
(1) = 3.84, p<0.05 level of significance, (*Significant) |
|||||
CONFLICT OF INTERESTS
None.
ACKNOWLEDGMENTS
The authors are grateful for the cooperation from the study participants and all the personnel who directly or indirectly helped in data collection in particular hospitals of Kolkata, West Bengal.
REFERENCES
Agarwal, K., Dewan, R., & Miuli, I. (2020). A Study to Compare Acceptability, Safety and Continuation Rates of Combined Hormonal Pill and Centchroman as Post Abortion Contraceptives. Int J Reprod Contracept Obstet Gynecol, 9, 3350-9. https://doi.org/10.18203/2320-1770.ijrcog20203322
Agrawal, P., Kushwa, V., & Mangal, B.K. (2016). Evaluation of Safety Profile of Centchroman for Contraceptive Purpose. National Journal of Medical and Allied Sciences, 5(2), 41-44.
Alameer, M.I., Muqri, K.Y., Awlaqi, A.A., Azyabi, F.Y., Yaqoub, A.M., Suhail, H.M., Shabaan, S., Moafa, M.H., Alhazmi, M.A., & Alhazmi, A. (2022). Knowledge, Attitude, and Practices Regarding Contraceptive Pill and its Side Effects Among Women in Jazan Region. Clin. Pract., 12, 268-275. https://doi.org/10.3390/clinpract12030032
Annual Report (2020-21). Department of Health & Family Welfare. Ministry of Health & Family Welfare, Government of India Accessed on 13/06/2022.
Colwell, H.H., Mathias, S.D., Cimms, T.A., Rothman, M., Friedman, A.J., & Patrick, D.L. (2006). The ORTHO BC - SAT - a Satisfaction Questionnaire for Women using Hormonal Contraceptives. Qua of Life Research, 15, 1621-1631. https://doi.org/10.1007/s11136-006-0026-8
Davis, A. A. (2019). Perceptions and Practices of Rural Indian Women in Contraception, Abortion, and Sexual Health: A Cross Sectional Study. Int J Repro'd Contracept Obstet Gynecol, 8(3), 1022-1029. https://doi.org/10.18203/2320-1770.ijrcog20190874
Doke, G., & Kamda, J. (2019). A Study of Centchroman users with Special Reference to its Contraceptive Benefit. Int J Repro'd Contracept Obstet Gynecol, 8, 4204-7. https://doi.org/10.18203/2320-1770.ijrcog20194594
Gupta, M., Bansiwal, R., & Anand, H.P. (2021). Comparison of Centchroman and PPIUCD in Terms of Efficacy, Safety, and Continuation Rate in Immediate Postpartum Period. Int J Reprod Contracept Obstet Gynecol, 10, 203-6. https://doi.org/10.18203/2320-1770.ijrcog20205769
Hayat, I.M., Bashir, U. F., & Dalhatu, A. (2021). Contraceptive Knowledge, Perception and Preference among Married Women Attending the Family Planning Unit of Turai Umar Yar’adua Maternity and Children Hospital Katsina. Gusau International Journal of Management and Social Sciences, 4(2), 13.
Jogia, D. P., Lodhiya, K. K., & Solanki, M. M. (2016). Perceptions about Pill use Among Former Users of Oral Contraceptives in a Tertiary Care Centre of Gujrat State. Int J Med Sci Public Health, 5, 2322-2327. https://doi.org/10.5455/ijmsph.2016.17042016475
Kadri, A.M. (2021). IAPSM's Textbook of Community Medicine (2nd Ed.). Jaypee Brothers Medical Publishers, 593-592.
Kamboj, V.P., Ray S., & Dhawan B.N. (1992). Centchroman: Drug of Today. ISSRT, 28, 227.
Kumar, N., Pant, G., & Kulkarni, S. R. (2018). The Journey of the World’s First Non-Steroidal Contraceptive from Academic Venture to National Family Programme. Current Science, 115(9), 1638–1640.
Lal, J. (2010). Clinical Pharmacokinetics and Interaction of Centchroman--A Mini Review. Contraception, 81(4), 275-80. https://Doi.Org/10.1016/J.Contraception.2009.11.007
Nair, H.S., & Jayasimha, P. (2016). A Prospective Study of Centchroman Users with Special Reference to its Contraceptive Benefit. J Evid Based Med Healthc, 3, 5374-80. https://doi.org/10.18410/jebmh/2016/1117
Nawale, A., Khamse, P., Konde, P., Khandare, H., Karnik, P., Mahadik, P. (2021). An Exploratory Study to Assess the Knowledge Regarding CHHAYA Contraceptive Pills Among Married Women. J of Ori Re., 23-28.
Ndikom, M. C., Ojo, O.C., & Ogbeye, G.B. (2018). Women's Choice, Satisfaction and Compliance with Contraceptive Methods in Selected Hospitals of Ibadan, Nigeria. Jour Mid & Repro Heal, 6(1), 1113-1122. https://doi.org/10.22038/jmrh.2017.9655
Nityananda, S., Kamboj, Chandrawati. (1994). Contraceptive Efficacy and Safety of Centchroman, 61-68.
Onyeka, C. O., Oluwatayo, I. B., & Disu, T. O. (2021). Perception and use of Contraceptives Among Women in Farming Households of Rural OYO. Prig Soci Sci J, 5(3). https://doi.org/10.32936/pssj.v5i3.267
Park, K. (2021). Park's Textbook of Preventive and Social Medicine (26th Ed). M/S Banarasidas Bhanot Publishers, 562-570.
Raman, N., Mukherjee, K., & Ganguli, G. (1995). Centchroman, A Safe Contraceptive Coverage following Medical Termination of Pregnancy.
Sarkar, A., Wadhawan, I., Raj, A., Nagabhushana, P., & Singh, P. (2022). Improving the Acceptance Rate of Centchroman As a Postpartum Contraceptive Through a Quality Improvement Initiative. Cureus, 14(9). https://doi.org/10.7759/cureus.29277
Sen, S., Cetinkaya, A., & Cavuslar, A. (2017). Perceptıon Scale of Barrıers to Contraceptıve Use: A Methodologıcal Study. Fertility Research and Practice, 3, 11. https://doi.org/10.1186/s40738-017-0038-9
Vinish, V., Ansuya, & Sowmya (2020). Contraceptives Utilization and Barriers in Karnataka, Southern India: A Survey on Women Residing in Slums. Clinical epidemiology and Global Health, 8, 1077 -1081. https://doi.org/10.1016/j.cegh.2020.03.023
 This work is licensed under a: Creative Commons Attribution 4.0 International License
© Granthaalayah 2014-2024. All Rights Reserved.