EVALUATION OF E-LEARNING OUTCOMES OF MATHEMATICS STUDENTS USING THE COURSE COMPLETION METHOD
Jemakmun Makmun 1![]() , M. Taufik Rahmatullah 1
, M. Taufik Rahmatullah 1![]() , Mukran Roni 1
, Mukran Roni 1![]()
1 Study
Program, Informatics Engineering, Bina Darma Palembang University, South
Sumatra, Indonesia
|
|
|
ABSTRACT |
|
|
The current
development of internet technology has changed the direction of the learning
system at both elementary and tertiary levels by means of online, blended
learning, and e-learning. This research aims to determine and analyze the
learning outcomes of students using course completion during lectures using
the eLearning method. The research subjects are Bina Darma University
students. Data collection was carried out in this research through
observation and taking primary data from the e-learning system. The
instruments in this research include the independent variable (X), which is
report completion, and the dependent variable (Y), which is elearning
learning outcomes. The resulting research results are: 1. There is a positive
influence from the activity task variable on the student learning outcome
variable, which is known to be active in carrying out the tasks in
e-learning. 2. There is a positive influence from the material variable on the
student learning outcome variable, which is known to be active in opening the
material. provided in e-learning. Multiple linear regression tests result
from the course completion variable on student learning outcomes. It can be
concluded that there is a positive influence on the learning outcomes of
variable Y from variable X. Students can also share information or opinions
on various matters relating to the subject matter or assignments given by the
lecturer. Apart from that, lecturers can place learning materials and
assignments that students must complete in certain places in e-learning for
students to access. |
|||
|
Received 15 May 2024 Accepted 20 June 2024 Published 17 July 2024 Corresponding Author Jemakmun
Makmun, jemakmun_66@yahoo.com DOI 10.29121/granthaalayah.v12.i6.2024.5619 Funding: This research
received no specific grant from any funding agency in the public, commercial,
or not-for-profit sectors. Copyright: © 2024 The
Author(s). This work is licensed under a Creative Commons
Attribution 4.0 International License. With the
license CC-BY, authors retain the copyright, allowing anyone to download,
reuse, re-print, modify, distribute, and/or copy their contribution. The work
must be properly attributed to its author.
|
|||
|
Keywords: E-Learning, Learning Outcomes, Report
Completion, Course Complete |
|||
1. INTRODUCTION
Online learning is learning that is done using the Internet as a channel of knowledge. Hartanto (2016). This form of learning can be done anytime and anywhere without time constraints and without having to face-to-face Syarifudin (2020). E-Learning is an asynchronous learning activity through computer electronic devices that acquire learning materials that fit their needs Puspitarini (2022). E-Learning is one of the learning methods that can be used to facilitate teacher performance in teaching Muhammad et al. (2020). Learning Management System (LMS) is an integrated and comprehensive system and belongs as an E-Learning platform. Wiragunawan (2022). LMS features, among other things, learning process management, content management, subject administration, chatting, discussion, as well as evaluation and examinations that are conducted online Widiyono (2021). On LMS Moodle has features among others: 1. User Management, 2. Learning Resources, 3. Course, 4. Quiz, 5. Forum. Anugerah & Kusuma (2021). Course completion is used to see if the student has already read the material and is working on the activity of the class Rizal & Walidain (2019), provided that the setting of the activity completion has been done on each activity before the class begins. Elearning Universitas Negeri Yogyakarta. (2021).
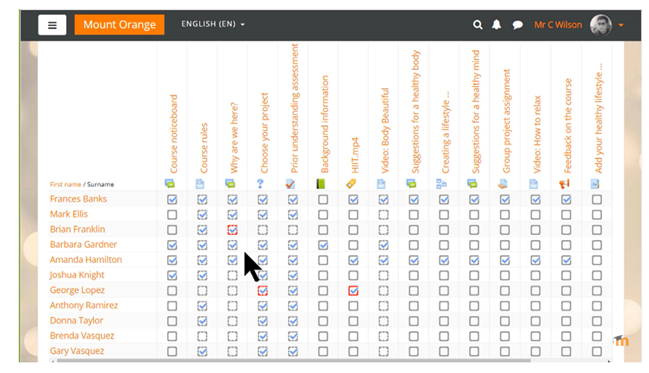
Figure 1
|
Figure 1 View Course Completion |
The function of the Course completion menu above is to mark manually or automatically any material that has already been followed by the student on the subject that is in the elearning, so that it can proceed to the next material already given by the lecturer.
The learning outcome is the ability of the student after receiving a learning experience that will result in a change in behaviour. Wicaksono & Iswan (2019). As a result of learning that is considered important and can reflect the results of such learning, both from the cognitive aspects, the affective aspects and the psychomotor aspects. Nabillah & Abadi (2019). Learning results are often used as a measure of how far a person mastered the material that was taught. Siregar (2019). To update the learning results, a series of measurements is required using a good and qualified evaluation tool. Zagoto (2022).
According to Ghozali (2018) Regression is a useful statistical method to examine or model relationships between variables. These variables, using regression analysis, can see the influence of a characteristic on other data. Multiple linear regression analysis is actually the same as simple lineary regression, only the free variable is more than one. Y = a + b1 X1 + b2 X2 + bn Xn, with Y being free variable, and X being free-variable, a being constant (intersept) and b being a regression coefficient on each free- variable. Double linear regression analysis requires simultaneous testing using F count Prasetyo (2022).
2. Research Methods
2.1. Research Related
The method used to measure the level of satisfaction is the DeLone and McLean method. From the data processing results obtained that all the qualities given by E-Learning, both in terms of system quality, information quality, and the quality of the service have not been able to satisfy students as users due to various factors, among them students as user feel uncomfortable in accessing E-learning, lack of accuracy, and lack of freshness in case of errors in the use of E-Learning Larasati & Andayani (2019). The research method used is qualitative descriptive with statistical analysis descriptives, as well as the purpose of the research is to know the effectiveness, use of e-Learing, and level of understanding to the use E-Larning at the University of De La Salle, University of Nusantara, and STMIK Parna Raya as a model of learning using social media Facebook, Line, And WhatsApp Ucu et al. (2018).
2.2. Research site
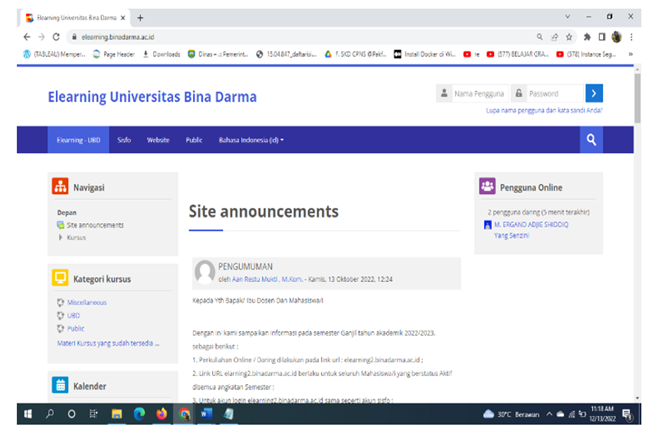
Observations or observations are performed by visiting directly the address of the E-Learning Moodle of the University of Bina Darma with the aim of obtaining information about the e-learning moodle. On the main display of the application there is a login form page for the user, as well as user menus owned by the university to be shown to the users such as students and lecturers of the main page on the e -learningMoodle can be seen in Figure 2.
Figure 2
|
Figure
2 E-Learning Moodle
Home Page |
2.3. Population and Samples
Population is not merely the number of objects or subjects studied, but includes all the characteristics or properties of such objects and objects. Hardani et al. (2020). The population in this study is a user who has already used the E-Learning Moodle at the University of Darma Palembang. The number of samples in this research are users who use the e-learning moodle either it is the user who is still active in the courses taken as the research objects on the E -LearningMoodle University of Bina Darma.
2.4. Research Variables
The variables that are identified and will be analyzed in the research can be seen in the table,
Table 1
|
Table 1 Variabel Penelitian |
||
|
No |
Variable |
Information |
|
1 |
(X2) is obtained from the
number of (activity tasks) students completed |
Activity tasks are student
activities i.e. quizzes, tasks, outs and outs. One of the variables and
indicators of evaluation of student learning outcomes during
the course of following subjects of E-Learning ranging from quizze,
out of tasks and out ofs. |
|
2 |
(X4) obtained from a lot of
students watching videos of the material given. |
Video material is a
video-format material given by a lecturer to a student in the form of a video
link. |
|
3 |
Course Completation (X) On can
be from the number of variables, X.2, X.4 |
Course completion, activities
tasks, materials of the student's overall activities. |
|
4 |
Learning Outcome (Y) is
obtained from learning outcomes or end values. |
One of the indicators of the
final grade measurement of every student. |
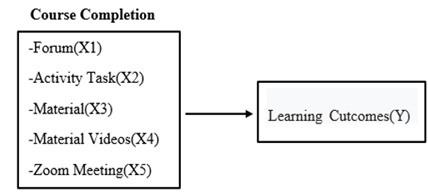
The model of the conceptual framework can describe the relationship with the variables performed to test in a study. Based on the conceptional framework, the study has the following hypothesis:
Figure 3
|
Figure 3 E-Learning Moodle Home Page |
Further implementation of processing and analysis of sample data in this study is done using the application SPSS.
3. Results and Discussion
3.1. Results
Before the sample data is tested, the normality of the data will be tested thoroughly using the SPSS statistical application, where it is obtained. Based on the above result, the lilifors count is smaller than the table or 0.009 < 0.104 which means that the data is distributed normally. Furthermore, double linear regression analysis is obtained using the statistical application SPSS,
3.1.1. Regression Testing of Activity Variables versus Learning Outcome Variables
Table 2
|
Table 2 Results Regressions
Statistical Variables Activity Versus Learning Outcome Variables |
|
|
Regression Statistics |
|
|
Multiple R |
0.67 |
|
R Square |
0.45 |
|
Adjusted R Square |
0.44 |
|
Standard Error |
6.08 |
|
Observations |
72.00 |
Table 3
|
Table 3 Anova Activity Variable Outcome versus Learning Outcome Variable |
|||||
|
df |
SS |
MS |
F |
Significance F |
|
|
Regression |
1.00 |
2082.95 |
2082.95 |
56.41 |
0.00 |
|
Residual |
70.00 |
2584.92 |
36.93 |
||
|
Total |
71.00 |
4667.88 |
|||
Table 4
|
Table 4 Results of Regression Test Variable Activity versus Variable Learning Outcome |
||||||||
|
Coefficients |
Standard Error |
t Stat |
P-value |
Lower 95% |
Upper 95% |
Lower 95.0% |
Upper 95.0% |
|
|
Intercept |
63.47 |
1.96 |
32.31 |
0.00 |
59.55 |
67.39 |
59.55 |
67.39 |
|
Activity Tasks (X2) |
1.04 |
0.14 |
7.51 |
0.00 |
0.76 |
1.32 |
0.76 |
1.32 |
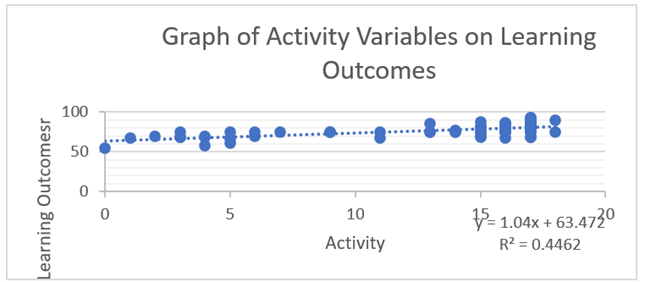
Based on the regression test results of the test of the activity of the task against the learning outcome there is a result that Significance F is 0.00. and obtained coeffients value of y= 1.04x + 63.47 which where the result has a positive influence of the variable of task activity against the student learning output variable with a correlation value of 0.67 or in other words produces a percentage of 67%. These results can be known students active in the work of the tasks at the E-Learning University of Bina Darma Palembang.
There is a positive influence of the activity task variable on the student learning outcome variable where students are known to be active in working on the existing tasks at the E-Learning University of Bina Darma Palembang. Here's a graph of the task activity variable versus learning outcome variable.
Figure 4
|
Figure 4 Activity Variable Chart Versus Learning Outcome Variable |
3.1.2. Test of Regression of Variable Matter versus Variable Learning Outcome
Table 5
|
Table 5 Results of Statistical Regressions of Variables Matter vs Learning Output Variable |
|
|
Regression Statistics |
|
|
Multiple R |
0.58 |
|
R Square |
0.34 |
|
Adjusted R Square |
0.33 |
|
Standard Error |
6.66 |
|
Observations |
72.00 |
Table 6
|
Table 6 Results Anova Variable Matter Versus Variable Learning Outcome |
|||||
|
df |
SS |
MS |
F |
Significance F |
|
|
Regression |
1.00 |
1566.95 |
1566.95 |
35.37 |
0.00 |
|
Residual |
70.00 |
3100.92 |
44.30 |
||
|
Total |
71.00 |
4667.88 |
|||
Table 7
|
Table 7 Results of the Regression Test of Variable Matter Versus Variable Learning Results |
||||||||
|
Coefficients |
Standard Error |
t Stat |
P-value |
Lower 95% |
Upper 95% |
Lower 95.0% |
Upper 95.0% |
|
|
Intercept |
67.14 |
1.87 |
35.98 |
0.00 |
63.42 |
70.86 |
63.42 |
70.86 |
|
Material (X3) |
0.69 |
0.12 |
5.95 |
0.00 |
0.46 |
0.92 |
0.46 |
0.92 |
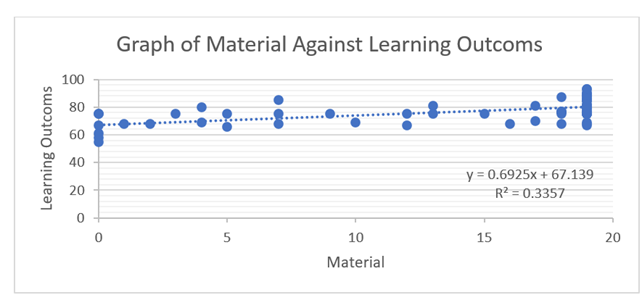
Based on the results of the variable test on the regression test between material variables versus learning variables with Significance F of 0.00. and obtained coeffients value of y= 0.6925x + 67.14 where the results have a positive influence of the material variable against student learning variable with a correlation value of 0.58 or with a percentage result of 58%. These results can be known students active in opening materials and have an influence as much as 58% in the learning results at E-Learning University of Bina Darma Palembang.
There is a positive influence of the material variable on the variable of student learning outcomes where it is known that students are active in opening the material provided at the E-Learning University of Bina Darma Palembang. Here's a graph of the material variable versus the learning result variable.
Figure 5
|
Figure 5 Chart of Variable Matter Versus Variable Learning Outcome |
3.2. Discourse
The data obtained and used in this study, before being analyzed, was tested for normality. From the results of the normality test using SPSS, the above resulted in lilifors counting smaller than the lilifor table or 0.009 < 0.104 which means that the data is distributed normally.
Based on the results of the double linear regression test of the Course Completion variable and against the learning results of students using the above-mentioned elearning. There is a positive influence of the variable activity of the task on the student result variable which is known students become more active in working on the existing tasks at E-Learning University Bina Darma Palembang.
Based on the results of the double linear regression test of the Course Completion variable and against the learning results of students using the above-mentioned elearning. It can be concluded that there is a positive influence on the learning outcomes of the existing variable X that is the material given by the lecturer. With there is the positive impact of the material variable of the faculty on the student learning outcome variable in which the student is known to be active in studying, understanding the material and working on the task that exists in accordance with the time already determined by his doses that at the E-Learning University of Bina Darma Palembang.
In connection with the still negative influence that can lead to less maximum student learning results related to the activity of tasks and materials on learning elearning, as well as to reduce the negative impact associated with the activities of these duties and materials, it is preferable that the lecturer can make a video of material that is compact and short. Next, the teacher can make the activity question answer after the explanation of the material on the zoom meeting or forum discussion of fellow students and lecturers to get a high percentage.
4. Conclusion
The regression test results of the activity test against the learning results obtained results y= 1.04x + 63.47 in which the result has a positive influence of the variable activity of the task on the student learning result variable, with such results can be known students active in the work of the tasks on E-Learning.
The test results on the regression test between material variables and learning outcomes were y= 0.6925x + 67.14, in which the result had a positive influence of the material variable on student learning outcome variables, with such results can be known students active in opening and learning as well as understand the material available on E-Learning.
Furthermore, the lecturer in the learning process using elearning complements the learning and evaluation activities by utilizing the existing facilities, especially those related to questioning and answering activities after the material explanation at the zoom meeting or forum discussion of fellow students and lecturers to obtain a high percentage.
CONFLICT OF INTERESTS
None.
ACKNOWLEDGMENTS
None.
REFERENCES
Anugerah, R. P., & Kusuma, W. A. (2021). Keefektivitasan Penggunaan Platform LMS Dalam Pelaksanaan Pembelajaran Jarak Jauh. Jurnal Komputer Dan Informatika, 9(2), 127–132. https://doi.org/10.35508/jicon.v9i2.4319
Elearning Universitas Negeri Yogyakarta. (2021). Petunjuk Penggunaan Besmart v3. 45.
Ghozali, I. (2018). Aplikasi Analisis Multivariate dengan Program SPSS-Imam Ghozali-2018. In Badan Penerbit Universitas Diponegoro.
Hardani, A.N.H., Andriani, H., Fardani,
R. A., Ustiawati, J., Utami,
E. F., Sukmana, D., J. & Istiqomah,
R. (2020). Metode Penelitian Kualitatif dan Kuantitatif.
Hartanto, W. (2016). Penggunaan E-Learning Sebagai Media Pembelajaran. Jurnal Pendidikan Ekonomi, 10(1), 1–18.
Larasati, N. A., & Andayani, S. (2019). Pengaruh Penggunaan Learning Management System (LMS) Terhadap Tingkat Kepuasan Mahasiswa Menggunakan Metode DeLone and McLean. Jurnal Teknik Informatika Unika St. Thomas (JTIUST), 04(01), 2548–1916. https://doi.org/10.17605/jti.v4i1.506
Muhammad, H., R. Eka Murtinugraha, & Sittati Musalamah. (2020). Pengembangan Media Pembelajaran E-Learning Berbasis Moodle Pada Mata Kuliah Metodologi Penelitian. Jurnal PenSil, 9(1), 54–60. https://doi.org/10.21009/jpensil.v9i1.13453
Nabillah, T., & Abadi, A. P. (2019). Faktor Penyebab Rendahnya Hasil Belajar Siswa. Prosiding Seminar Nasional Matematika Dan Pendidikan Matematika Sesiomadika, 659.
Prasetyo, R. A. (2022). Analisis Regresi Linear Berganda Untuk Melihat Faktor Yang Berpengaruh Terhadap Kemiskinan di Provinsi Sumatera Barat. Journal of Mathematics UNP, 7(2), 62. https://doi.org/10.24036/unpjomath.v7i2.12777
Puspitarini, D. (2022). Blended Learning sebagai Model Pembelajaran Abad 21. Ideguru: Jurnal Karya Ilmiah Guru, 7(1), 1–6. https://doi.org/10.51169/ideguru.v7i1.307
Rizal, S., & Walidain, B. (2019). Pembuatan Media Pembelajaran E-Learning Berbasis Moodle Pada Matakuliah Pengantar Aplikasi Komputer Universitas Serambi Mekkah. Jurnal Ilmiah Didaktika: Media Ilmiah Pendidikan Dan Pengajaran, 19(2), 178. https://doi.org/10.22373/jid.v19i2.5032
Siregar, S. F. (2019). Meningkatkan Hasil Belajar Siswa Pada Pelajaran Ilmu Pengetahuan Alam Di Kelas Vii-2 Melalui Pendekatan Pembelajaran Cara Belajar Siswa Aktif Di Smp Negeri 29 Medan. Jurnal Biolokus, 2(2), 217. https://doi.org/10.30821/biolokus.v2i2.539
Syarifudin, A. S. (2020). Impelementasi Pembelajaran Daring Untuk Meningkatkan Mutu Pendidikan Sebagai Dampak Diterapkannya Social Distancing. Jurnal Pendidikan Bahasa Dan Sastra Indonesia Metalingua, 5(1), 31–34. https://doi.org/10.21107/metalingua.v5i1.7072
Ucu, N. L., Paturusi, S. D. E., & Sompie, S. R. U. A. (2018). Analisa Pemanfaatan E-Learning Untuk Proses Pembelajaran. Jurnal Teknik Informatika, 13(1). https://doi.org/10.35793/jti.13.1.2018.20196
Wicaksono, D., & Iswan. (2019). Upaya Meningkatkan Hasil Belajar Peserta Didik Melalui Penerapan Model Pembelajaran Berbasis Masalah Di Kelas IV Sekolah Dasar Muhammadiyah 12 Pamulang, Banten. Jurnal Ilmiah PGSD, 3(2), 111–126. https://doi.org/10.33578/pjr.v2i3.5555
Widiyono, A. (2021). Pengaruh Penggunaan LMS dan Aplikasi Telegram terhadap Aktivitas Belajar. Jurnal Penelitian Ilmu Pendidikan, 14(1), 91–101. https://doi.org/10.21831/jpipfip.v14i1.37857
Wiragunawan, I. G. N. (2022). Pemanfaatan Learning Management System (Lms) Dalam Pengelolaan Pembelajaran Daring Pada Satuan Pendidikan. EDUTECH: Jurnal Inovasi Pendidikan Berbantuan Teknologi, 2(1), 83–90. https://doi.org/10.51878/edutech.v2i1.981
Zagoto, M. M. (2022). Peningkatan Hasil Belajar Mahasiswa Pada Mata Kuliah Dasar-Dasar Akuntansi 1 Melalui Implementasi Model Pembelajaran Kooperatif Word Square. Educativo: Jurnal Pendidikan, 1(1), 1–7. https://doi.org/10.56248/educativo.v1i1.1
 This work is licensed under a: Creative Commons Attribution 4.0 International License
© Granthaalayah 2014-2024. All Rights Reserved.