
EVALUATION OF FINANCIAL PERFORMANCES OF TECHNOLOGY COMPANIES TRADED IN BORSA İSTANBUL USING TOPSIS MULTI-CRITERIA DECISION-MAKING METHOD
Hatice Özkurt Çokgüngör
1![]()
![]()
1 İstanbul-Cerrahpaşa University, Social Sciences Vocational
School, İstanbul, Turkey
|
|
|
ABSTRACT |
|
|
The technology
sector, which makes significant contributions to the economy of countries,
has the ability to provide high added value. When we look at the distinction
between developed and developing countries in the world, we see that the
technology sector is at the forefront. Especially when we look at the
distinction between developed and developing countries, we see that the
importance given to the technology sector is more prominent in developed
countries in terms of sector. Investors use many ways to evaluate their
investments. One of these is the stock market. Although it is a very
challenging process, it requires knowledge, experience and detailed strategy.
By following what is happening in the markets, analyzing moment by moment,
and using the right time and strategies, investing in the stock market can
become profitable. The aim of this study is to reveal the financial situation
of the activities of the companies in the technology sector in BIST 100 using
the TOPSIS method. |
|||
|
Received 27 November 2023 Accepted 27 December 2023 Published 13 January 2024 Corresponding Author Hatice
Özkurt Çokgüngör, hozkurt@istanbul.edu.tr DOI 10.29121/granthaalayah.v11.i12.2023.5451 Funding: This research
received no specific grant from any funding agency in the public, commercial,
or not-for-profit sectors. Copyright: © 2023 The
Author(s). This work is licensed under a Creative Commons
Attribution 4.0 International License. With the
license CC-BY, authors retain the copyright, allowing anyone to download,
reuse, re-print, modify, distribute, and/or copy their contribution. The work
must be properly attributed to its author.
|
|||
|
Keywords: Financial Analysis, Technology, TOPSIS
Method |
|||
1. INTRODUCTION
The technology sector has many different areas such as computer software, hardware, networks, information and communication technologies, internet and intranet. Since it has a very dynamic structure, new developments emerge in this field every day. Therefore, the technology sector facilitates the strategies of businesses, their decision-making methods, and their methods of solving the problems they encounter. Rapid technological changes, especially in recent years, have begun to be felt in every aspect of life. With developing technology, production methods and other sectors change accordingly. Although developing technologies affect all life, businesses operating in the technology sector are increasing day by day, and the sector is expanding and deepening.
At the same time, information technologies also attract attention as one of the sectors that has gained momentum in growth recently. Investments in technology companies in the field of IT and technology are increasing in Turkey. One of the most important factors in the formation of economic growth differences between countries is the issue of how quickly countries can develop their technological capabilities. From this perspective, the performance of companies operating in technology and sectors intertwined with technology becomes important.
In this context, the study consists of four parts: introduction, literature review, methodology and interpretation of the findings and results of the research. 19 companies operating in the Borsa Istanbul (BIST) technology sector between 2020 and 2022 were included in the study, and ratio analyzes were made based on the financial statements of the companies between these years. The data obtained from these ratios analyzes were evaluated with the TOPSIS method and the performance levels of the companies were compared.
2. Literature Review
TOPSIS method created by Hwang & Yoon in 1981; It contributes to the decision-making process of businesses. When the literature on the TOPSIS method is examined, it is seen that the method is used to evaluate financial performance in line with certain criteria. Under this heading, previous studies on financial performance evaluation through financial ratios will be included. Purpose of financial statements; It is to provide information about the financial situation, financial performance and cash flows of businesses that help a wide range of users make decisions.
At this point, the numbers in the financial statements can be described as raw accounting data. In order to be used in decision making, these numbers must be converted into accounting information Al-Qatnani (2004), 31. One of the methods used to transform the numbers revealed by accounting into information is financial ratios. Financial ratios; It is used to describe the relationship between figures shown in the statement of financial position, profit and loss statement, budget control system or any part of the accounting organization Batty (1969). Financial performance analysis; It defines the process of analyzing and interpreting financial statements in terms of liquidity and working capital use, asset efficiency and profitability. One of the techniques commonly used for financial performance analysis today is "Ratio Analysis" Vataliya (2009), 212. In support of this assertion, it is observed that many studies in the literature on financial performance evaluation use financial ratios. Some of these studies are given below.[1].
Considering the studies of Feng & Wang (2000) and Feng & Wang (2001), in the first study; In the analysis of the performance of five airline companies operating in Taiwan using the TOPSIS method, 22 variables were considered as transportation and financial indicators and the performances of these companies were ranked in line with these variables. In the second study, the performances of four bus companies were analyzed by using the TOPSIS method, taking into account the ratios of their production activities, marketing efforts and financial indicators, and the companies were ranked. The study concluded that determining correct financial ratios is extremely important in calculating performance.
Yurdakul & İç (2003) using the balance sheets of five large-scale companies operating in the automotive industry in Turkey between 1998 and 2001, financial ratios (current ratio, stock turnover rate, gross sales profit/net sales, short-term debts/total debt, main These financial ratios, which are used in performance measurement, were first explained and calculated for the companies by rating the companies with the help of operating profit/net sales ratios). Then, the calculated ratios were converted into a single score showing the overall company performance for each company using the TOPSIS method. When the findings of the studies are examined, similarities are detected between the performance rankings created as a result of the TOPSIS method and the stock return rankings of companies, and the ranking made according to financial ratios and the performance rankings based on stock returns are consistent.
Akkaya (2004) analyzed the performance of an airline operating in Turkey using the TOPSIS method. It is stated in the study that 13 of the 63 ratios in question are successful in representing financial performance. It is stated in the research that these ratios will help practitioners to evaluate the financial performance of airline companies.
In a study conducted by Wang & Hsu (2004) on Wang et al. (2010) companies traded on the Taiwan stock exchange, using four financial ratios (current ratio, return per share, net profit margin and stock turnover rate), it was stated that the TOPSIS method could be useful in determining investment strategies and investors' decisions.
Eleven financial ratios (Stock and asset turnover rate, return on capital, acid test ratio, working capital ratio, borrowing ratio, asset profitability, receivables, liquidity ratio, net flow ratio) were developed by Bo & Haidong (2008) on one hundred and twelve companies traded on the Chinese stock exchange, current liabilities/net flow ratio), it was determined that the TOPSIS method can be used as an early warning system by businesses during financial crisis periods.
Yükçü & Atağan (2010) examined the financial performance of three hotel businesses affiliated with the same holding using financial ratios. It was stated in the study that TOPSIS management gives successful results in performance evaluation and that this method offers different evaluation options to decision makers.
Demireli (2010) used 10 financial ratios in his study examining the financial performance of three public banks providing services in Turkey. It has been determined that public banks operating widely in Turkey were affected by local and international financial crises, their performance scores fluctuated based on international data, and in this context, there was no noticeable improvement in the banking sector.
In the study conducted by Wang et al. (2010), the analysis was carried out using 6 financial ratios (return on assets, return on capital, current ratio, return per share, net profit margin ratio and stock turnover rate) of 13 companies traded on the Vietnam stock exchange. As a result, it was stated that the TOPSIS method could be useful in evaluating the financial performance of businesses and in creating portfolios for investors.
Torlak et al. (2011) evaluated the performance of 4 airline companies operating in the Turkish national airline industry with the fuzzy TOPSIS method, using data such as efficiency, advertising, customer service, product quality and e-commerce. As a result of the study, when all success factors were considered, Turkish Airlines was determined to be the most successful company, followed by Pegasus, Atlas Jet and Onur Air, respectively.
In the study conducted by Özgüven (2011), the performance of three large hypermarkets operating in the retail sector was analyzed with the TOPSIS method. In the study findings, five basic criteria used to evaluate the performance of retailers between 2005 and 2009 were taken into account. These criteria; It was determined as total number of stores/population, number of employees/population, number of newly opened stores/total number of stores, marketing sales and distribution expenses/total expenses and net profit/net sales. When the performances of retailers between 2005 and 2009 are evaluated, it is seen that Carrefour ranked first in terms of performance in 2005 and 2006, 2008Tesco-Kipa in 2009, and Migros in 2007 and.
Factor analysis was conducted by Kim & Jung (2011) on eight companies traded on the Korean stock exchange with sixteen financial criteria. By making a correlation analysis between the results of the method used and the results of the financial ratios, it was seen that the relationship was low. It has been observed that the TOPSIS method is an adequate method in selecting investment alternatives.
Uygurtürk & Korkmaz (2012) examined the financial performance of 13 main metal industry enterprises traded on the ISE. First of all, financial ratios were calculated in order to reveal the financial structure of the businesses, and then the calculated ratios were; Using the TOPSIS method, it is converted into a single score that represents overall company performance. In the study; 8 financial ratios were used: Current Ratio, Total Asset Turnover Rate, Stock Turnover Rate, Fixed Asset Turnover Rate, Liquidity Ratio, Total Debts/Total Assets, Net Profit Margin and Return on Equity. The calculated financial ratios were used as the input of the TOPSIS method and accordingly, the performance ranking of the enterprises and similar enterprises were compared within the framework of the same criteria, and their numerical success was determined and ranked. Finally, two portfolios consisting of businesses with high and low performance rankings determined by the TOPSIS method were created and the relationship between the returns of these portfolios and the performance ranking of the TOPSIS method was tried to be determined.
Atmaca (2012) focused on four sports businesses traded on the ISE in his study. In the research, 16 financial ratios were used to represent the financial performance of sports businesses. The study was based on the basic financial statements (balance sheet and income statement) of Trabzonspor, Fenerbahçe, Beşiktaş and Galatasaray Sportif A.Ş. between 2003 and 2010. Using these tables, a total of 16 financial ratios showing the assets, financial structure, capital, activity, liquidity and profitability levels of sports companies were used. It has been determined that the successes or failures of the four sports companies included in the study play an important role in the financial performance level and this situation is reflected in the financial statements of the companies.
Bulgurcu (2012) can be given as an example of studies conducted on technology companies operating in Turkey. In the study conducted for technology companies traded on ISE, 10 financial ratios were used. The research results were obtained using the TOPSIS method, similar to the above studies.
In their study, Kahveci & Turna (2016) measured the financial performance of tourism partnerships listed on Borsa Istanbul using the TOPSIS method. Companies were ranked according to their financial performance scores calculated using financial ratios for the years 2010-2015, and priority financial ratios that were effective in determining the performance scores of companies operating in the sector were determined.
Orçun & Eren (2017) is another study conducted on technology companies traded in Borsa Istanbul. Similar to other studies, this study tried to determine financial performance with financial ratios. TOPSIS method was used in this study for financial performance ranking purposes. Among the findings of the study; It was mentioned that there was no statistically significant similarity between the ranking made according to TOPSIS and the ranking made according to stock returns.
When the studies mentioned above are evaluated collectively; It is seen that financial ratios are frequently used in financial performance evaluation. The items included in the financial statements of businesses are first converted into financial ratios using ratios. Afterwards, businesses are ranked according to their financial performance using one of the multi-criteria decision-making techniques in line with the determined ratios. As a result of the literature review, it can be said that the most frequently used multi-criteria decision-making method is TOPSIS.
3. Evaluation of Financial Performance of Technology Companies
3.1. Data Set and Method of the Research
In the study, the financial performance of 19 technology companies traded on Borsa Istanbul was examined for three periods between 2020 and 2022. The companies within the scope of the research are presented in Table 1.
Table 1
|
Table 1 Companies Within the Scope of the Research |
||
|
Stock Exchange
Code |
Business Name |
|
|
1 |
FONET |
FONET BİLGİ
TEKNOLOJİLERİ |
|
2 |
KRONT |
KRON TEKNOLOJİ |
|
3 |
ARDYZ |
ARD GRUP
BİLİŞİM TEKNOLOJİLERİ |
|
4 |
ARENA |
ARENA BİLGİSAYAR |
|
5 |
INGRAM |
ARMADA BİLGİSAYAR |
|
6 |
ESCOM |
ESCORT TEKNOLOJİ |
|
7 |
IDEAL |
INGRAM MICRO
BİLİŞİM SİSTEMLERİ |
|
8 |
LINK |
LINK BİLGİSAYAR |
|
9 |
LOGO |
LOGO YAZILIM |
|
10 |
INDES |
INDEKS BİLGİSAYAR |
|
11 |
DESPC |
DESPEC BİLGİSAYAR |
|
12 |
DGATE |
DATAGATE BİLGİSAYAR |
|
13 |
PAPIL |
PAPİLON SAVUNMA TEKNOLOJİ |
|
14 |
SMART |
SMARTİKS YAZILIM |
|
15 |
KAREL |
KAREL ELEKTRONİK |
|
16 |
KFEIN |
KAFEİN YAZILIM
HİZMETLERİ |
|
17 |
ALCTL |
ALCATEL LUCENT TELETAŞ |
|
18 |
NETAS |
ASELSAN |
|
19 |
PKART |
NETAŞ TELEKOM |
Within the scope of the research, first of all, the financial ratios of the companies used in the research were calculated. The financial statements used in the calculation of financial ratios were downloaded from the official website of the Public Disclosure Platform (www.kap.gov.tr). Literature review was used to determine the financial ratios used within the scope of the research. First of all, financial ratios frequently used in the literature were determined; Afterwards, taking into account the studies of Bulgurcu (2012) and Orçun & Eren (2017), 8 financial ratios that were considered suitable for technology companies were preferred. The financial ratios used within the scope of the research are presented in Table 2.
Table 2
|
Table 2 Financial Ratios and Calculation Method Used in the Research |
|||
|
Symbol |
Financial Ratio
Name |
Calculation
Method |
TOPSIS Ideal
Solution Target |
|
Ratio 1 |
Current rate |
Current Assets / Short-Term
Liabilities |
Maximum |
|
Ratio 2 |
Cash Rate |
Cash and Cash Equivalents /
Short-Term Liabilities |
Maximum |
|
Ratio 3 |
Net Working Capital Turnover Rate |
Net Sales / Current Assets −
Short-Term Liabilities |
Maximum |
|
Ratio 4 |
Financial Leverage Ratio |
Total Liabilities / Total Assets |
Minimum |
|
Ratio 5 |
Interest Coverage Ratio |
Profit Before Interest and Tax/
Interest Expense |
Maximum |
|
Ratio 6 |
Period Net Profit Margin Ratio |
Period Net Profit / Net Sales |
Maximum |
|
Ratio 7 |
Asset Return Rate |
Net Profit for the Period / Total
Assets |
Maximum |
|
Ratio 8 |
Return on Equity Ratio |
Net Profit for the Period / Total
Equity |
Maximum |
Technology companies often have high entrepreneurial
ambition and are on the path to rapid growth. It can be said that high
liquidity is important in the technology sector, where acquisitions occur
frequently. In line with this explanation, Ertuğrul & Karakasoğlu (2009), Similar to the
studies of Bulgurcu
(2012), Uygurtürk & Korkmaz (2012) and Orçun
& Eren (2017), the TOPSIS ideal
solution target for liquidity ratios (Ratio 1, Ratio 2 and Ratio 3) was
determined as maximum ratio.
Liquidity ratios are described as a measure of the ability
of businesses to meet their short-term obligations. For creditors, high
liquidity ratios are considered as assurance and are expressed as a desirable
situation. A similar comment can be made partly from the perspective of
investors. However, high liquidity ratios can also be interpreted as the company
keeping its funds idle. In other words, excessively high liquidity ratios are
considered a sign of poor management, similar to excessively low liquidity
ratios. Therefore, there is uncertainty in terms of the TOPSIS ideal solution
target for liquidity ratios. Within the
scope of liquidity ratio, current ratio, cash ratio and net working capital
turnover rate were included in the study. At this point, the Acid test ratio is
excluded because the stock item for technology companies is relatively
unimportant compared to other sectors. The calculation methods of these ratios
are shown in Table 2.
Two ratios were used in the research to analyze the financial structure. The first of these ratios is the financial leverage ratio; In other words, it is the foreign resource ratio or debt ratio. Financial leverage ratio shows how much of the company's assets are financed by foreign resources. Ertuğrul & Karakasoğlu (2009); Considering the studies of Bulgurcu (2012), Uygurtürk & Korkmaz (2012) and Orçun & Eren (2017), the TOPSIS ideal solution target of the financial leverage ratio for Turkey, where borrowing costs are high, was determined as minimum.
The second ratio used within the scope of the research for financial structure analysis is the interest coverage ratio. The interest coverage ratio is an indicator of whether the business has sufficient earnings to cover its interest obligations. For this reason, the TOPSIS ideal solution target was determined as maximum. Three ratios were used in the research for profitability analysis. At this point, in order to evaluate profitability from a different perspective, attention was paid to the profitability ratio on sales, the profitability ratio on assets and the profitability ratio on equity. For businesses, it is desired that profitability be as high as possible. In this regard, the TOPSIS ideal solution target was determined as maximum for all three profitability ratios.
In order to evaluate profitability based on sales, the net profit ratio for the period was used. This ratio provides information about the net efficiency of business activities. Asset profitability ratio was used to evaluate profitability on assets. This ratio is used to analyze to what extent assets are used profitably in the business. To evaluate profitability based on equity, the equity profitability ratio was included in the scope of the research. This ratio is calculated to determine to what extent the values allocated to the business by the partners are used effectively and efficiently.
3.2. TOPSIS Method
TOPSIS (Technique for Order Preference by Similarity to Ideal Solution) method was developed by Yoon (1987) as a multi-criteria decision-making technique. The method is based on selecting the alternative with the shortest distance to the positive ideal solution and the farthest distance to the negative ideal solution. Below is the performance evaluation process of the TOPSIS method, which consists of 6 basic steps Dumanoğlu and Ergül (2010): 105-107. The calculations made for 2020 are presented below to serve as an example for the solution process of the TOPSIS method, which consists of six steps. Similar calculations were made for 2021 and 2022; However, these calculations are not included in the study.
Step 1: Creating the Initial Decision Matrix (A);
Aij= 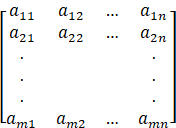 (1)
(1)
Step 2: Creating the Standard Decision Matrix (R);
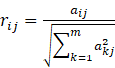 (2)
(2)
Rij=  (3)
(3)
Step 3: Creating the Weighted Standard Decision Matrix (V);

Vij= 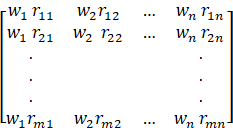 (4)
(4)
The weights for the evaluation criteria are determined as w1, w2,…….,wn. For the weighted normalized decision matrix to be created, the columns of the V matrix are calculated by multiplying the values in the columns of the R matrix with the relevant evaluation criterion weight values.
Step 4: Creating Ideal (A+) and Negative Ideal (A-) Solutions;
A* = ![]() (5)
(5)
A* = ![]() .
.
A- = ![]() (6)
(6)
A- = ![]() .
.
Step 5: Obtaining Distance Values to Ideal and Negative Ideal Points;
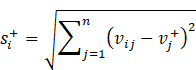 J=1,2,…, j (7)
 J=1,2,…, j (8)
Step 6: Calculation of Relative Closeness to Ideal Solution(![]() );
);
Here, the calculation of the relative closeness value to
the ideal solution by using ideal and negative ideal separation measures in
calculating the relative closeness to the ideal solution (![]() )
is shown in the formula below.
)
is shown in the formula below.
![]() =
= ![]() (9)
(9)
0 £![]() £ 1
£ 1
4. Findings and Evaluation
In this part of the study, the performances of the 19 companies included in the analysis for the years 2020-2022 were determined using the TOPSIS method. To serve as an example, the stages of the TOPSIS method for 2020 are as follows.
Step 1: Creating the Decision Matrix
The decision matrix is the first step of the TOPSIS method. In the first step, the decision matrix is created. In the rows are the decision points whose superiority should be understood, and in the columns are the factors to be used in the decision-making phase. It was created for technology companies as in Table 3.
Table 3
|
Table 3 Decision Matrix - Year 2020 |
||||||||
|
Ratio 1 |
Ratio 2 |
Ratio 3 |
Ratio 4 |
Ratio 5 |
Ratio 6 |
Ratio 7 |
Ratio 8 |
|
|
FONET |
2,9526 |
0,9214 |
3,5539 |
0,1275 |
391,7811 |
0,4273 |
0,2551 |
0,2924 |
|
KRONT |
1,5307 |
0,3789 |
2,5456 |
0,4151 |
11,0098 |
0,1985 |
0,1041 |
0,1779 |
|
ARDYZ |
6,1723 |
1,7865 |
1,5850 |
0,1064 |
51,9903 |
0,5245 |
0,3382 |
0,3785 |
|
ARENA |
1,5266 |
0,2139 |
9,1478 |
0,6497 |
1,7009 |
0,0127 |
0,0388 |
0,1107 |
|
INGRAM |
1,4419 |
0,2110 |
5,9181 |
0,8069 |
2,4811 |
0,0048 |
0,0088 |
0,0423 |
|
ESCOM |
3,3289 |
0,2158 |
0,0478 |
0,0339 |
21,2391 |
92,7057 |
0,3458 |
0,3579 |
|
IDEAL |
5,0981 |
1,4619 |
1,4963 |
0,2420 |
13,9792 |
0,1174 |
0,1088 |
0,4495 |
|
LINK |
12,6294 |
10,6900 |
0,5320 |
0,1145 |
50,7875 |
0,6183 |
0,2355 |
0,2659 |
|
LOGO |
1,3382 |
0,6437 |
3,9654 |
0,5100 |
35,2924 |
0,2088 |
0,1037 |
0,2116 |
|
INDES |
1,1635 |
0,3908 |
18,5798 |
0,8358 |
6,8924 |
0,0162 |
0,0410 |
0,2497 |
|
DESPC |
1,5320 |
0,0714 |
6,9692 |
0,6463 |
1,7416 |
0,0308 |
0,0731 |
0,2066 |
|
DGATE |
1,5548 |
0,0645 |
9,5379 |
0,6337 |
23,5271 |
0,0224 |
0,0744 |
0,2033 |
|
PAPIL |
29,2778 |
24,4107 |
0,3180 |
0,0482 |
26,5041 |
0,3531 |
0,0998 |
0,1049 |
|
SMART |
2,0997 |
0,4016 |
2,2235 |
0,1981 |
2,1415 |
0,1375 |
0,0460 |
0,0573 |
|
KAREL |
1,4062 |
0,4190 |
2,8194 |
0,6672 |
3,5804 |
0,1194 |
0,0803 |
0,2412 |
|
KFEIN |
1,2160 |
0,3396 |
9,6321 |
0,3007 |
10,2846 |
0,1942 |
0,1020 |
0,1459 |
|
ALCTL |
1,8181 |
0,4782 |
2,3318 |
0,6465 |
6,1231 |
1,0000 |
0,9424 |
2,6662 |
|
NETAS |
1,0590 |
0,1801 |
17,2304 |
0,7571 |
0,7338 |
0,0410 |
0,0295 |
0,1214 |
|
PKART |
2,8270 |
0,8818 |
0,3742 |
0,2420 |
23,7261 |
0,1174 |
0,1088 |
0,1435 |
Step 2: Creating the Standard Decision Matrix
It is the creation of a normalized decision matrix. Thus, the data set with high values is reduced to the range between -1 and 1. When calculating the normalized decision matrix, the numbers in the decision matrix must first be squared. Table 4 shows the squares of the numbers in the decision matrix.
Table 4
|
Table 4 Squares of Numbers in the Decision Matrix – Year 2020 |
||||||||
|
Ratio 1 |
Ratio 2 |
Ratio 3 |
Ratio 4 |
Ratio 5 |
Ratio 6 |
Ratio 7 |
Ratio 8 |
|
|
FONET |
0,0876 |
0,0344 |
0,1096 |
0,0585 |
0,9709 |
0,0046 |
0,2211 |
0,1027 |
|
KRONT |
0,0454 |
0,0141 |
0,0790 |
0,1904 |
0,0273 |
0,0021 |
0,0902 |
0,0625 |
|
ARDYZ |
0,1832 |
0,0666 |
0,0492 |
0,0488 |
0,1288 |
0,0057 |
0,2931 |
0,1329 |
|
ARENA |
0,0453 |
0,0080 |
0,2838 |
0,2981 |
0,0042 |
0,0001 |
0,0336 |
0,0389 |
|
INGRAM |
0,0428 |
0,0079 |
0,1836 |
0,3702 |
0,0061 |
0,0001 |
0,0076 |
0,0149 |
|
ESCOM |
0,0988 |
0,0080 |
0,0015 |
0,0156 |
0,0526 |
0,9999 |
0,2996 |
0,1257 |
|
IDEAL |
25,9902 |
0,0545 |
0,0464 |
0,1110 |
0,0346 |
0,0013 |
0,0943 |
0,1579 |
|
LINK |
0,3748 |
0,3988 |
0,0165 |
0,0525 |
0,1259 |
0,0067 |
0,2041 |
0,0934 |
|
LOGO |
0,0397 |
0,0240 |
0,1230 |
0,2340 |
0,0875 |
0,0023 |
0,0899 |
0,0743 |
|
INDES |
0,0345 |
0,0146 |
0,5764 |
0,3835 |
0,0171 |
0,0002 |
0,0355 |
0,0877 |
|
DESPC |
2,3470 |
0,0027 |
0,2162 |
0,2965 |
0,0043 |
0,0003 |
0,0633 |
0,0726 |
|
DGATE |
0,0461 |
0,0024 |
0,2959 |
0,2908 |
0,0583 |
0,0002 |
0,0645 |
0,0714 |
|
PAPIL |
0,8688 |
0,9106 |
0,0099 |
0,0221 |
0,0657 |
0,0038 |
0,0865 |
0,0368 |
|
SMART |
0,0623 |
0,0150 |
0,0690 |
0,0909 |
0,0053 |
0,0015 |
0,0398 |
0,0201 |
|
KAREL |
0,0417 |
0,0156 |
0,0875 |
0,3061 |
0,0089 |
0,0013 |
0,0696 |
0,0847 |
|
KFEIN |
0,0361 |
0,0127 |
0,2988 |
0,1379 |
0,0255 |
0,0021 |
0,0884 |
0,0513 |
|
ALCTL |
0,0540 |
0,0178 |
0,0723 |
0,2966 |
0,0152 |
0,0108 |
0,8166 |
0,9366 |
|
NETAS |
0,0314 |
0,0067 |
0,5346 |
0,3473 |
0,0018 |
0,0004 |
0,0256 |
0,0427 |
|
PKART |
0,0839 |
0,0329 |
0,0116 |
0,1110 |
0,0588 |
0,0013 |
0,0943 |
0,0504 |
|
TOTAL |
30,5137 |
1,6473 |
3,0648 |
3,6619 |
1,6988 |
1,0446 |
2,7175 |
2,2576 |
Equation (2) is used in the creation of the normalized
decision matrix. In Equation (2), lines i; j
represents columns. In the numerator part of the equation, there is the number (![]() )
for the relevant ratio and the relevant company in the decision matrix; The
denominator is the sum of squares of all companies (
)
for the relevant ratio and the relevant company in the decision matrix; The
denominator is the sum of squares of all companies (![]() ) for the relevant ratio, in other words, the
numbers in the TOTAL row at the bottom of Table 4. The decision matrix
is standardized by dividing it by the square root of the sum of the squares of
the relevant column values in the decision matrix. The normalized decision
matrix calculated with Equation 2 is presented in Table 5.
) for the relevant ratio, in other words, the
numbers in the TOTAL row at the bottom of Table 4. The decision matrix
is standardized by dividing it by the square root of the sum of the squares of
the relevant column values in the decision matrix. The normalized decision
matrix calculated with Equation 2 is presented in Table 5.
Table 5
|
Table 5 Normalized Decision Matrix – Year 2020 |
||||||||
|
|
Ratio 1 |
Ratio 2 |
Ratio 3 |
Ratio 4 |
Ratio 5 |
Ratio 6 |
Ratio 7 |
Ratio 8 |
|
FONET |
0,0968 |
0,0302 |
0,1165 |
0,0042 |
12,8395 |
0,0140 |
0,0084 |
0,0096 |
|
KRONT |
0,0502 |
0,0124 |
0,0834 |
0,0136 |
0,3608 |
0,0065 |
0,0034 |
0,0058 |
|
ARDYZ |
0,2023 |
0,0585 |
0,0519 |
0,0035 |
1,7038 |
0,0172 |
0,0111 |
0,0124 |
|
ARENA |
0,0500 |
0,0070 |
0,2998 |
0,0213 |
0,0557 |
0,0004 |
0,0013 |
0,0036 |
|
INGRAM |
0,0473 |
0,0069 |
0,1939 |
0,0264 |
0,0813 |
0,0002 |
0,0003 |
0,0014 |
|
ESCOM |
0,1091 |
0,0071 |
0,0016 |
0,0011 |
0,6961 |
3,0382 |
0,0113 |
0,0117 |
|
IDEAL |
0,1671 |
0,0479 |
0,0490 |
0,0079 |
0,4581 |
0,0038 |
0,0036 |
0,0147 |
|
LINK |
0,4139 |
0,3503 |
0,0174 |
0,0038 |
1,6644 |
0,0203 |
0,0077 |
0,0087 |
|
LOGO |
0,0439 |
0,0211 |
0,1300 |
0,0167 |
1,1566 |
0,0068 |
0,0034 |
0,0069 |
|
INDES |
0,0381 |
0,0128 |
0,6089 |
0,0274 |
0,2259 |
0,0005 |
0,0013 |
0,0082 |
|
DESPC |
0,0502 |
0,0023 |
0,2284 |
0,0212 |
0,0571 |
0,0010 |
0,0024 |
0,0068 |
|
DGATE |
0,0510 |
0,0021 |
0,3126 |
0,0208 |
0,7710 |
0,0007 |
0,0024 |
0,0067 |
|
PAPIL |
0,9595 |
0,8000 |
0,0104 |
0,0016 |
0,8686 |
0,0116 |
0,0033 |
0,0034 |
|
SMART |
0,0688 |
0,0132 |
0,0729 |
0,0065 |
0,0702 |
0,0045 |
0,0015 |
0,0019 |
|
KAREL |
0,0461 |
0,0137 |
0,0924 |
0,0219 |
0,1173 |
0,0039 |
0,0026 |
0,0079 |
|
KFEIN |
0,0399 |
0,0111 |
0,3157 |
0,0099 |
0,3370 |
0,0064 |
0,0033 |
0,0048 |
|
ALCTL |
0,0596 |
0,0157 |
0,0764 |
0,0212 |
0,2007 |
0,0328 |
0,0309 |
0,0874 |
|
NETAS |
0,0347 |
0,0059 |
0,5647 |
0,0248 |
0,0240 |
0,0013 |
0,0010 |
0,0040 |
|
PKART |
0,0926 |
0,0289 |
0,0123 |
0,0079 |
0,7776 |
0,0038 |
0,0036 |
0,0047 |
Step 3: In the third step, the weighted normalized decision matrix is created. First of all, criterion weights are determined. The point to be considered at this stage is that the sum of the criterion weights must be equal to 1. In this research, each ratio was given equal weight and the weight coefficient of the ratios was calculated as 1 / 8 = 0.125. It was used to create the weighted normalized decision matrix. In the equation, w represents the weight coefficient.
Table 6
|
Table 6 Weighted Normalized Decision Matrix – Year 2020 |
||||||||
|
Ratio 1 |
Ratio 2 |
Ratio 3 |
Ratio 4 |
Ratio 5 |
Ratio 6 |
Ratio 7 |
Ratio 8 |
|
|
FONET |
0,0121 |
0,0038 |
0,0146 |
0,0005 |
1,6049 |
0,0018 |
0,0010 |
0,0012 |
|
KRONT |
0,0063 |
0,0016 |
0,0104 |
0,0017 |
0,0451 |
0,0008 |
0,0004 |
0,0007 |
|
ARDYZ |
0,0253 |
0,0073 |
0,0065 |
0,0004 |
0,2130 |
0,0021 |
0,0014 |
0,0016 |
|
ARENA |
0,0063 |
0,0009 |
0,0375 |
0,0027 |
0,0070 |
0,0001 |
0,0002 |
0,0005 |
|
INGRAM |
0,0059 |
0,0009 |
0,0242 |
0,0033 |
0,0102 |
0,0000 |
0,0000 |
0,0002 |
|
ESCOM |
0,0136 |
0,0009 |
0,0002 |
0,0001 |
0,0870 |
0,3798 |
0,0014 |
0,0015 |
|
IDEAL |
0,0209 |
0,0060 |
0,0061 |
0,0010 |
0,0573 |
0,0005 |
0,0004 |
0,0018 |
|
LINK |
0,0517 |
0,0438 |
0,0022 |
0,0005 |
0,2081 |
0,0025 |
0,0010 |
0,0011 |
|
LOGO |
0,0055 |
0,0026 |
0,0162 |
0,0021 |
0,1446 |
0,0009 |
0,0004 |
0,0009 |
|
INDES |
0,0048 |
0,0016 |
0,0761 |
0,0034 |
0,0282 |
0,0001 |
0,0002 |
0,0010 |
|
DESPC |
0,0063 |
0,0003 |
0,0285 |
0,0026 |
0,0071 |
0,0001 |
0,0003 |
0,0008 |
|
DGATE |
0,0064 |
0,0003 |
0,0391 |
0,0026 |
0,0964 |
0,0001 |
0,0003 |
0,0008 |
|
PAPIL |
0,1199 |
0,1000 |
0,0013 |
0,0002 |
0,1086 |
0,0014 |
0,0004 |
0,0004 |
|
SMART |
0,0086 |
0,0016 |
0,0091 |
0,0008 |
0,0088 |
0,0006 |
0,0002 |
0,0002 |
|
KAREL |
0,0058 |
0,0017 |
0,0115 |
0,0027 |
0,0147 |
0,0005 |
0,0003 |
0,0010 |
|
KFEIN |
0,0050 |
0,0014 |
0,0395 |
0,0012 |
0,0421 |
0,0008 |
0,0004 |
0,0006 |
|
ALCTL |
0,0074 |
0,0020 |
0,0096 |
0,0026 |
0,0251 |
0,0041 |
0,0039 |
0,0109 |
|
NETAS |
0,0043 |
0,0007 |
0,0706 |
0,0031 |
0,0030 |
0,0002 |
0,0001 |
0,0005 |
|
PKART |
0,0116 |
0,0036 |
0,0015 |
0,0010 |
0,0972 |
0,0005 |
0,0004 |
0,0006 |
Step 4: In the
fourth step, ideal and negative ideal solutions need to be determined. While the best performance values of
the weighted normalized decision matrix form the ideal solution, the solution
resulting from the worst performance values is the negative ideal solution. The
point to be considered at this point is to choose the ideal solution target
(maximum or minimum) correctly. For example, while the maximum value for profit
is the ideal solution; In terms of cost, the minimum value will be the ideal
solution.
Table 7
|
Table 7 Positive and Negative Ideal Solution Values – 2020 |
|
||||||||
|
Ratio 1 |
Ratio 2 |
Ratio 3 |
Ratio 4 |
Ratio 5 |
Ratio 6 |
Ratio 7 |
Ratio 8 |
||
|
Positive Ideal Solution (A+) |
0,1199 |
0,1000 |
0,0761 |
0,0034 |
1,6049 |
0,3798 |
0,0039 |
0,0109 |
|
|
Negative Ideal Solution (A−) |
0,0043 |
0,0003 |
0,0002 |
0,0001 |
0,0030 |
0,0000 |
0,0000 |
0,0002 |
|
As can be seen in Table 2, the ideal solution target for ratio 1 was determined as maximum. Accordingly, in the weighted normalized decision matrix presented in Table 6, the highest number for Ratio 1, 0.1199, was chosen as the ideal solution value. For ratio 4, the ideal solution target was determined as minimum. Therefore, the ideal solution value 0.0043 determined for Ratio 4 is the lowest number for Ratio 4 in the weighted normalized decision matrix. Negative ideal solution values are the lowest number for ratios whose ideal solution target is maximum; The ideal solution target is determined as the highest number for minimum ratios.
Step 5: Distances to the ideal solution and the negative ideal solution are calculated. At this stage, Sj+ shows how far the alternative is from the positive ideal solution, and Sj- shows how far it is from the negative ideal solution. Distances from the positive and negative ideal solution were calculated using Equation (7) and Equation (8), respectively.
Table 8
|
Table 8 Relative Closeness Values to the Ideal Solution – Year 2020 |
|||
|
S + |
S - |
C* |
|
|
FONET |
0,4095 |
1,6020 |
0,7964 |
|
KRONT |
1,6136 |
0,0434 |
0,0262 |
|
ARDYZ |
1,4501 |
0,2112 |
0,1272 |
|
ARENA |
1,6499 |
0,0376 |
0,0223 |
|
INGRAM |
1,6472 |
0,0253 |
0,0152 |
|
ESCOM |
1,5268 |
0,3890 |
0,2031 |
|
IDEAL |
1,6009 |
0,0574 |
0,0346 |
|
LINK |
1,4515 |
0,2149 |
0,1290 |
|
LOGO |
1,5174 |
0,1425 |
0,0859 |
|
INDES |
1,6289 |
0,0801 |
0,0469 |
|
DESPC |
1,6500 |
0,0288 |
0,0172 |
|
DGATE |
1,5634 |
0,1012 |
0,0608 |
|
PAPIL |
1,5453 |
0,1856 |
0,1072 |
|
SMART |
1,6487 |
0,0116 |
0,0070 |
|
KAREL |
1,6431 |
0,0166 |
0,0100 |
|
KFEIN |
1,6157 |
0,0555 |
0,0332 |
|
ALCTL |
1,6321 |
0,0272 |
0,0164 |
|
NETAS |
1,6534 |
0,0704 |
0,0408 |
|
PKART |
1,5633 |
0,0945 |
0,0570 |
Step 6: In the
last stage, the relative closeness to the ideal solution ![]() is calculated. Afterwards, the order is made
from largest to smallest according to the value of closeness to the ideal
solution. The business with the highest value close to the ideal solution means
the business with the highest performance. The relative closeness value to the
ideal solution was calculated with the help of Equation 9.
is calculated. Afterwards, the order is made
from largest to smallest according to the value of closeness to the ideal
solution. The business with the highest value close to the ideal solution means
the business with the highest performance. The relative closeness value to the
ideal solution was calculated with the help of Equation 9.
4.1. Financial Performance Measurement via TOPSIS Method
19 businesses were included in the scope of the research and 8 financial ratios (criteria) were determined to measure their financial performance. In the research; Separate decision matrices for the years 2020, 2021 and 2022 using 8 financial ratios calculated as Current Ratio, Cash Ratio, Net Working Capital Turnover Rate, Financial Leverage Ratio, Interest Coverage Ratio, Net Profit for the Period Ratio, Asset Profitability Ratio and Equity Profitability Ratio (19 x 8) was created. In the application phase of the TOPSIS method, 8 financial ratios (criteria), Ertuğrul & Karakasoğlu (2009), It was weighted equally, similar to the studies of Bulgurcu (2012), Uygurtürk & Korkmaz (2012) and Orçun & Eren (2017). Therefore, the weight ratio of each determined financial ratio in the TOPSIS calculation was determined as 0,125. The calculated financial ratios were converted into a single score showing the overall business performance through the TOPSIS method; Afterwards, the companies were ranked and the performance rating process was completed.
Ranking the financial performances of businesses using the TOPSIS method is useful for making single-period comparisons. However, in order to make comparisons covering a period longer than a single period, an index should be created as suggested by Bayramoğlu & Basarir (2016). After Bayramoğlu and Başarır (2016) ranked the financial performances of businesses according to TOPSIS management for each period; They gave each company a score for each period according to their success order. The sum of the success scores of companies for different periods was used to evaluate the long-term financial performance of that company. Similar to the study of Bayramoğlu & Başarır (2016), it was decided to create a performance index in this study in order to compare long-term financial performance. However, the performance index in this study differs from the study by Bayramoğlu & Başkar (2016). In this study, the performance index was calculated as explained below.
Step 1: First
of all, the relative closeness values (![]() )
to the ideal solution estimated through the TOPSIS method are collected and the
share of each enterprise in the total is calculated as a percentage for each
year with the following formula. In
other words, the share of each business in the total is determined as a
percentage. The percentage share of each business also constitutes the
performance index score of that business for that period.
)
to the ideal solution estimated through the TOPSIS method are collected and the
share of each enterprise in the total is calculated as a percentage for each
year with the following formula. In
other words, the share of each business in the total is determined as a
percentage. The percentage share of each business also constitutes the
performance index score of that business for that period.
![]() =
= ![]() x 100 (9)
x 100 (9)
![]() : The relative closeness value of
business i to the ideal solution
: The relative closeness value of
business i to the ideal solution
![]() : The sum of the relative closeness values of
all businesses to the ideal solution
: The sum of the relative closeness values of
all businesses to the ideal solution
Step 2: By
adding up the financial performance scores calculated separately for each
business period, a long-term financial performance ranking is made based on
three-period totals.
4.2. Findings of the Research
Within the scope of the research, the relative closeness values to the ideal solution calculated through the TOPSIS method and the performance ranking and performance index scores determined according to these values are presented separately for the 2020, 2021 and 2022 periods.
Table 9
|
Table 9 TOPSIS Results for 2020 |
|||
|
C* |
Performance Index
Score |
||
|
1 |
FONET |
0,7964 |
43,3763 |
|
2 |
KRONT |
0,0262 |
1,4275 |
|
3 |
ARDYZ |
0,1272 |
6,9261 |
|
4 |
ARENA |
0,0223 |
1,2120 |
|
5 |
INGRAM |
0,0150 |
0,8190 |
|
6 |
ESCOM |
0,2031 |
11,0601 |
|
7 |
IDEAL |
0,0346 |
1,8853 |
|
8 |
LINK |
0,1290 |
7,0250 |
|
9 |
LOGO |
0,0859 |
4,6760 |
|
10 |
INDES |
0,0468 |
2,5502 |
|
11 |
DESPC |
0,0171 |
0,9324 |
|
12 |
DGATE |
0,0608 |
3,3102 |
|
13 |
PAPIL |
0,1073 |
5,8416 |
|
14 |
SMART |
0,0071 |
0,3880 |
|
15 |
KAREL |
0,0099 |
0,5397 |
|
16 |
KFEIN |
0,0332 |
1,8086 |
|
17 |
ALCTL |
0,0163 |
0,8898 |
|
18 |
NETAS |
0,0409 |
2,2255 |
|
19 |
PKART |
0,0570 |
3,1068 |
|
TOTAL |
1,8361 |
100 |
|
The business with the highest relative closeness value to the ideal solution, C*, should be considered as the business with the best financial performance compared to other businesses within the scope of the research for the relevant period. According to Table 9, the company with the best financial performance for 2020 is FONET (0,7964).
Accordingly, FONET with the highest C* value received a performance index score of 43,3763; SMART, with the lowest C* value, received a performance index score of 0,3880. It is seen that there is a difference of approximately 42,98 performance index points (43,3763 – 0,3880) between the best financial performance and the weakest financial performance in 2020.
The relative closeness values of the enterprises within the scope of the research to the ideal solution with the TOPSIS method for 2021 and the performance ranking and performance index scores based on these values are presented in Table 10.
Table 10
|
Table 10 TOPSIS Results for 2021 |
|||
|
C* |
Performance Index Score |
||
|
1 |
FONET |
0,0139 |
1,1446 |
|
2 |
KRONT |
0,0020 |
0,1630 |
|
3 |
ARDYZ |
0,0035 |
0,2856 |
|
4 |
ARENA |
0,0019 |
0,1552 |
|
5 |
INGRAM |
0,0018 |
0,1469 |
|
6 |
ESCOM |
0,1795 |
14,8265 |
|
7 |
IDEAL |
0,0006 |
0,0490 |
|
8 |
LINK |
0,0026 |
0,2144 |
|
9 |
LOGO |
0,9861 |
81,4359 |
|
10 |
INDES |
0,0020 |
0,1676 |
|
11 |
DESPC |
0,0018 |
0,1516 |
|
12 |
DGATE |
0,0019 |
0,1568 |
|
13 |
PAPIL |
0,0023 |
0,1869 |
|
14 |
SMART |
0,0018 |
0,1493 |
|
15 |
KAREL |
0,0018 |
0,1451 |
|
16 |
KFEIN |
0,0018 |
0,1510 |
|
17 |
ALCTL |
0,0018 |
0,1472 |
|
18 |
NETAS |
0,0015 |
0,1221 |
|
19 |
PKART |
0,0024 |
0,2013 |
|
TOTAL |
1,2109 |
100 |
|
According to Table 10, the business with the best financial performance for 2021 is LINK (0,8036). In the rest of the table, it is seen that LOGO (0,9861) and ESCOM (0,1795) businesses perform better financially than other businesses within the scope of the research. The business with the weakest financial performance for 2021 was determined as IDEAL (0,0490).
The relative closeness values of the enterprises within the scope of the research to the ideal solution with the TOPSIS method for 2022 and the performance ranking and performance index scores based on these values are presented in Table 11.
Table 11
|
Table 11 TOPSIS Results for 2022 |
|||
|
C* |
Performance Index Score |
||
|
1 |
FONET |
0,7460 |
4,2135 |
|
2 |
KRONT |
0,9977 |
5,6348 |
|
3 |
ARDYZ |
0,9976 |
5,6342 |
|
4 |
ARENA |
0,9977 |
5,6351 |
|
5 |
INGRAM |
0,9977 |
5,6349 |
|
6 |
ESCOM |
0,0022 |
0,0124 |
|
7 |
IDEAL |
0,9977 |
5,6348 |
|
8 |
LINK |
0,9975 |
5,6340 |
|
9 |
LOGO |
0,9976 |
5,6344 |
|
10 |
INDES |
0,9977 |
5,6350 |
|
11 |
DESPC |
0,9977 |
5,6349 |
|
12 |
DGATE |
0,9977 |
5,6349 |
|
13 |
PAPIL |
0,9974 |
5,6333 |
|
14 |
SMART |
0,9977 |
5,6352 |
|
15 |
KAREL |
0,9978 |
5,6355 |
|
16 |
KFEIN |
0,9976 |
5,6345 |
|
17 |
ALCTL |
0,9949 |
5,6193 |
|
18 |
NETAS |
0,9976 |
5,6346 |
|
19 |
PKART |
0,9977 |
5,6347 |
|
TOTAL |
17,7054 |
100 |
|
In the financial performance evaluation made through the TOPSIS method for 2022, FONET (0,7964) and LOGO (0,9861) appear as the businesses with the highest financial performance, similar to the 2020 and 2021 periods. Afterwards, ESCOM (0,2031) and (0,1795) are seen as the most successful enterprise in terms of financial performance, respectively. ESCOM again has the weakest financial performance for 2022 (0,0022).
In order to evaluate long-term financial performance in line with the purpose of the study, the performance index scores of the enterprises for the three periods within the scope of the research were combined and presented collectively in Table 12.
Table 12
|
Table 12 Performance Index Scores of Businesses (2020 – 2022) |
|||||
|
Performance Index Scores |
|||||
|
SIRA |
ŞİRKET |
2020 |
2021 |
2022 |
TOPLAM |
|
1 |
FONET |
43,3763 |
1,1446 |
4,2135 |
48,7344 |
|
2 |
KRONT |
1,4275 |
0,1630 |
5,6348 |
7,2252 |
|
3 |
ARDYZ |
6,9261 |
0,2856 |
5,6342 |
12,8459 |
|
4 |
ARENA |
1,2120 |
0,1552 |
5,6351 |
7,0023 |
|
5 |
INGRAM |
0,8190 |
0,1469 |
5,6349 |
6,6008 |
|
6 |
ESCOM |
11,0601 |
14,8265 |
0,0124 |
25,8991 |
|
7 |
IDEAL |
1,8853 |
0,0490 |
5,6348 |
7,5691 |
|
8 |
LINK |
7,0250 |
0,2144 |
5,6340 |
12,8735 |
|
9 |
LOGO |
4,6760 |
81,4359 |
5,6344 |
91,7463 |
|
10 |
INDES |
2,5502 |
0,1676 |
5,6350 |
8,3528 |
|
11 |
DESPC |
0,9324 |
0,1516 |
5,6349 |
6,7189 |
|
12 |
DGATE |
3,3102 |
0,1568 |
5,6349 |
9,1018 |
|
13 |
PAPIL |
5,8416 |
0,1869 |
5,6333 |
11,6618 |
|
14 |
SMART |
0,3880 |
0,1493 |
5,6352 |
6,1724 |
|
15 |
KAREL |
0,5397 |
0,1451 |
5,6355 |
6,3204 |
|
16 |
KFEIN |
1,8086 |
0,1510 |
5,6345 |
7,5941 |
|
17 |
ALCTL |
0,8898 |
0,1472 |
5,6193 |
6,6563 |
|
18 |
NETAS |
2,2255 |
0,1221 |
5,6346 |
7,9822 |
|
19 |
PKART |
3,1068 |
0,2013 |
5,6347 |
8,9428 |
|
THRESHOLD VALUE |
16 |
||||
The companies with the most successful financial performance in 2020 - 2022 were LOGO, FONET and ESCOM (Table 12). The companies with the weakest financial performance in 2020 - 2022 are SMART, KAREL and INGRAM.
According to Bayramoğlu and others; The standard value for good financial performance can be symbolized by the threshold value. Businesses with total performance index scores higher than the threshold value can be considered financially successful, and those below can be described as having poor financial performance Bayramoğlu and Basarir (2016). The threshold value of total performance index scores for 2020 – 2022 for the technology companies analyzed in this study was calculated as 16. The most successful companies in terms of performance between 2020-2022 were LOGO, FONET, ESCOM, LINK, ARDYZ and PAPIL, respectively. In conclusion; It has also been concluded that since technology investments are large-scale investments, the liquidity of the companies in the performance ranking in question, the permanent capital size to finance especially long-term investments in the financial structure, and fixed asset investments as an indicator of capacity come to the fore.
This situation is especially true for Borsa Istanbul A.C. It can be interpreted that investors shape their investments based on the news instead of investing by taking financial indicators into consideration, and this situation can be interpreted as taking positions according to the news, especially in the technology sector, causing a move away from market efficiency. Investors making decisions based on the results obtained from companies' balance sheets and income statements, instead of the information they receive when purchasing shares, will both bring the stock market closer to efficiency and enable it to be interpreted as a long-term investment alternative by taking advantage of the stock market's profit opportunities more accurately and accurately.
Financial ratios are frequently used in the literature to measure financial performance; In the following, it is seen that the TOPSIS method is used for performance ranking. In the light of this information, in this study, businesses were ranked according to financial performance through the TOPSIS method, using 8 financial ratios. In addition, unlike previous studies in the literature, the differences between the financial performances of businesses were revealed more precisely both in terms of periods, through the developed performance index score; and long-term performance rankings could be made. Moreover, with the threshold value calculation, it was possible to consider businesses in a binary structure as financially successful and weaker than average. In this respect, it is thought that the study will contribute to both practitioners and the literature.
Although this study is a comparison of the financial performance of technology companies traded on BIST for the period 2020 - 2022, it should be described as a situation analysis. The methods and evaluations used within the scope of the study are guiding for similar studies. Therefore, it can be recommended that both practitioners, policy makers and researchers repeat similar analyzes frequently.
5. Conclusion
The ability of businesses to continue their activities in their environments depends on their competitiveness. This shows the extent to which the business uses (performance) functions such as cost, profit, production and workforce. Measuring and analyzing the performance of businesses with the help of financial ratios becomes important in determining the market values of businesses and comparing them with each other.
In this study, it was tried to reveal how the financial performance of businesses can be evaluated in the long term by using the TOPSIS method. The study focused on technology companies, taking into account their growth rate in recent years and their ability to attract investments.
The increasing importance of technology in terms of increasing the competitiveness of countries and increasing the level of welfare causes companies in this sector to have a more strategic position. In this context, the financial performance of companies is important for both their own lifespan and the country's economy.
CONFLICT OF INTERESTS
None.
ACKNOWLEDGMENTS
None.
REFERENCES
Akkaya, G. C. (2004). Finansal Rasyolar Yardımıyla Havayolları İşletmelerinin Performansının Değerlendirilmesi. Dokuz Eylül Üniversitesi İktisadi ve İdari Bilimler Fakültesi Dergisi, Sayı, 19(1), 15-29.
Al-Qatnani, K. (2004). The Effect of Using Accounting Information on the Administrative Performance of Jordanian Public Share holding Companies. Amman, Jordan: University of Jordan.
Atmaca, M. (2012). “İMKB’de İşlem Gören Spor Şirketlerinin TOPSIS Yöntemi İle Finansal Performans Değerlendirmesi. İktisat, İşletme ve Finans Dergisi, 27(320), 91-108. https://doi.org/10.3848/iif.2012.320.3478.
Batty, J. (1969). Management Accountancy (Ed. 3rd). Macdonald & Evans Ltd.
Bo, J., & Haidong, L. (2008). Research on Financial Early Warning for Listed Companies Based on TOPSIS Method.
Bulgurcu, B. (2012). Application of TOPSIS Technique for Financial Performance Evaluation of Technology Firms in Istanbul Stock Exchange Market. Procedia-Social and Behavioral Sciences, 62, 1033–1040. https://doi.org/10.1016/j.sbspro.2012.09.176.
Demireli, E. (2010). TOPSİS Çok Kriterli Karar Verme Sistemi: Türkiye’deki Kamu Bankaları Üzerine Bir Uygulama. Girişimcilik ve Kalkınma Dergisi, Sayı, 5(1), 101-112.
Ertuğrul, İ., & Karakasoğlu, N. (2009). Performance Evaluation of Turkish Cement Firms with Fuzzy Analytic Hierarchy Process and TOPSIS Methods. Expert Systems with Applications, 36, 702–715. https://doi.org/10.1016/j.eswa.2007.10.014.
Feng, C.-M., & Wang, R.-T. (2000). Performance Evaluation For Airlines Including The Consideration of Financial Ratios. Journal of Air Transport Managemant, Sayı, 6, 133-142. https://doi.org/10.1016/S0969-6997(00)00003-X.
Feng, C.-M., & Wang, R.-T. (2001). Considering The Financial Ratios on The Performance Evaluation of Highway Industry. Transport Reviews, Sayı, 21(4), 449-467. https://doi.org/10.1080/01441640010020304.
Hwang, C. L., & Yoon, K. (1981). Multiple Attribute Decision Making: Methods and Applications. New York: Springer-Verlag.
Kahveci, M., & Turna, İ. (2016). BİST’te İşlem Gören Turizm İşletmelerinin TOPSIS Tekniği ile Finansal Performanslarının Analizi ve Değerlendirilmesi. Muhasebe ve Denetime Bakış Dergisi, 48, 99-114.
Kim, G., & Jung, S. (2011). Exploiting the Decision-Making Tecnique to Explore the Relationship Between the Financial Factors and the Stock Preference.
Orçun, Ç., & Eren, S. (2017). TOPSIS Yöntemi ile Finansal Performans Değerlendirmesi: XUTEK Üzerinde Bir Uygulama. Muhasebe ve Finansman Dergisi, (75), 139-154. https://doi.org/10.25095/mufad.399899.
Torlak, G., Şevkli, M., Sanal, M., & Zaim, S. (2011). Analyzing Business Competition by Using Fuzzy TOPSIS Method: An Example of Turkish Domestic Airline Industry. Expert Systems with Applications, Sayı, 38, 3396– 3406. https://doi.org/10.1016/j.eswa.2010.08.125.
Uygurtürk, H., & Korkmaz, T. (2012). Finansal Performansın TOPSIS Çok Kriterli Karar Verme Yöntemi İle Belirlenmesi: Ana Metal Sanayi İşletmeleri Üzerine Bir Uygulama. Eskişehir Osmangazi Üniversitesi İİBF Dergisi, 7(2), 95-115.
Vataliya, K. (2009). Financial Accounting. India: Paradise Publisher.
Wang, T.-C., & Hsu, J.-C. (2004). Evaluation of the Business Operation Performance of the Listing Companies by Applying TOPSIS Method. IEEE International Conference on Systems, Man and Cybernestics, Sayı: 2, 1286-1291. https://doi.org/10.1109/ICSMC.2004.1399802.
Wang, T.-C., Chang, J.-F., Anh, T.-N., & Chang, T.-S. (2010). Applying TOPSIS Method to Evaluate the Business Operation Performance of Vietnam Listing Securities Companies. International Conference on Computational Aspects of Social Networks, IEEE Computer Society, 273-277. https://doi.org/10.1109/CASoN.2010.69.
Yoon, K. (1987). A Reconciliation Among Discrete Compromise Situations. Journal of the Operational Research Society, 38(3), 277-286. https://doi.org/10.2307/2581948.
Yurdakul, M., & İç, Y. (2003). Türk Otomotiv Firmalarının Performans Ölçümü ve Analizine Yönelik Topsıs Yöntemini Kullanan Bir Örnek Çalışma. Gazi Üniversitesi, Mühendislik ve Mimarlık Fakültesi Dergisi, 18(1), 1-18.
Yükçü, S., & Atağan, G. (2010). TOPSIS Yöntemine Göre Performans Değerleme. Muhasebe ve Finansman Dergisi, Sayı, 1(45), 28-35.
Özgüven, N. (2011). Kriz Döneminde Küresel Perakendeci Aktörlerin Performanslarının TOPSIS Yöntemi İle Değerlendirilmesi. Atatürk Üniversitesi İktisadi ve İdari Bilimler Fakültesi Dergisi, Sayı, 25(2), 151-162.
[1] Considering the
focus group of this study, only previous studies conducted on businesses
operating in Turkey are included.
 This work is licensed under a: Creative Commons Attribution 4.0 International License
© Granthaalayah 2014-2024. All Rights Reserved.

