EVALUATION OF WATER POLLUTION STATUS OF TRIYUGA RIVER IN UDAYAPUR DISTRICT, NEPAL
Dr. Bishnu Dev Das 1![]()
![]() ,
Sonu Pradhan 1
,
Sonu Pradhan 1![]() , Amrita Sardar 1
, Amrita Sardar 1![]() , Dr. Niroj Paudel 2
, Dr. Niroj Paudel 2![]() , Dr. Ranjan Kumar Mishra 3
, Dr. Ranjan Kumar Mishra 3![]()
1 Department
of Botany, Mahendra Morang Adarsh Multiple Campus, Biratnagar, Tribhuvan
University, Nepal
2 National
Institute of Horticultural and Herbal Science, Rural Development
Administration, Wanju, 55365, Republic of Korea
3 Department of Geography, TMBU, Bhagalpur, Bihar, India
|
|
|
ABSTRACT |
|
|
The present investigation has been
conducted to assess the status of physiochemical and microbiological
parameters to understand the present scenario of water quality at Triyuga River water at Belaka
municipality of Udayapur district, Nepal. The
temperature ranged from 180C to 200C, the TDS value
ranged from 89 mg/L to 112 mg/L and were below the WHO guideline value of
1200 mg/L, the pH values of the surface water sources in the present study
were found to be alkaline ranging above from 7.6 to 7.9 were found within the
range of WHO guideline value of 6.5-8.5. Similarly the values of dissolved oxygen ranged from 6.4
mg/L to 10.4 mg/L and were above the WHO guideline value of 5 mg/L, the
bicarbonate (HCO3) value ranged from 105 mg/L to 125 mg/L and were
below the WHO guideline value of 125-350 mg/L, the values of Nitrate ranged
from 3 mg/L to 5 mg/L and were below the WHO guideline of 50 mg/L, the values of Nitrite ranged from 0.3 mg/L to
0.5 mg/L, the value of Ammonium ranged from 0 mg/L to 0.3 mg/L, the values of Iron ranged from 1 mg/L to 1.5
mg/L and were above the WHO guideline of 0.3 mg/L and the phosphate was not
detected in all the three different sites of surface water samples. The fecal
coliform was found to be positive in all the samples and the value of fecal
coliform recorded was 15, 15 and 21 MPN/100ml in Site I, II and III
respectively. |
|||
|
Received 22 December 2023 Accepted 22 January
2024 Published 06 February 2024 Corresponding Author Dr.
Ranjan Kumar Mishra, ranjan78arsenic@gmail.com
DOI 10.29121/granthaalayah.v12.i1.2024.5442 Funding: This research
received no specific grant from any funding agency in the public, commercial,
or not-for-profit sectors. Copyright: © 2024 The
Author(s). This work is licensed under a Creative Commons
Attribution 4.0 International License. With the
license CC-BY, authors retain the copyright, allowing anyone to download,
reuse, re-print, modify, distribute, and/or copy their contribution. The work
must be properly attributed to its author.
|
|||
|
Keywords: Belaka Municipality,
Microbiological, Physiochemical, Pollution, Triyuga
River, Surface Water |
|||
1. INTRODUCTION
All life, including that of humans, animals, and plants,
depends on water. It sustains all facets of human livelihoods and is necessary
for the general well-being of humans. Water is also essential for the
maintenance of productive human endeavours like fishing, tourism,
transportation services, sanitation, and the production of food, energy, and
industrial goods UNEP (2009). According to Hema & Subramani (2013), rivers are the
primary sources of fresh water for all human activities. Rivers are the main
source of freshwater and have long been utilized for energy production,
transportation, irrigation, waste water transportation, and municipal water
supply Iscen et al. (2008). Water is
a fundamental component of all living things' fluids, including rain, streams,
lakes, and oceans. It is also a prerequisite for human and industrial
development Das
& Chaudhary (2021).
Any physical, chemical, or biological alteration in the quality of water that endangers life or renders the water unfit for intended uses is referred to as water pollution Miller (2002). One of the most important environmental problems facing the world today is water pollution. When contaminated water serves as a medium for the spread of illness, it is accountable for a great deal of the mortality of various organisms. Diseases linked to water and sanitation claim thousands of lives worldwide WHO (2010).
Owing to its paramount significance, numerous investigations
concerning the quality of surface water have been conducted in various parts of
Nepal, including the Bagmati River in the Kathmandu valley Karn & Harada (2001), Kodku Khola, Lalitpur Maharjan (2006), Sirsiya River of central southern Nepal Shah & Pant (2013), Gosainkunda Lake Raut et al.(2013), Bagmati River
in Kathmandu Valley Gautam et al. (2013), Kolpu Khola in Sisdol Landfill Area of Nuwakot
District Shrestha et al. (2015), Chimdi in Sunsari district Das (2017), Pokhara lake Das (2017), Betana wetland in Morang Das et al. (2018), Sanbarish Pond of Morang District Das et al. (2020), Lakes of
Chitwan National Park, Central Nepal Bhusal & Devkota (2020) and Rara Lake Kaphle et al. (2021). Keeping these
aspects into consideration, the present study has been designed to assess
the Triyuga river water on the basis of
physicochemical characteristics.
2. MATERIALS AND METHODS
2.1. STUDY AREA
The study area is situated at latitude
26°54′25.56′′ N and longitude 86°40′40.80′′
E in the Udayapur district of eastern Nepal. The
district has a total area of 2,063 km2, with Gaighat
(Triyuga) serving as its headquarters. There are
317,532 people living in the Udayapur district. There
are four urban and four rural municipalities in the Udayapur
district. The district is situated between 360 and 2310 meters above sea level.
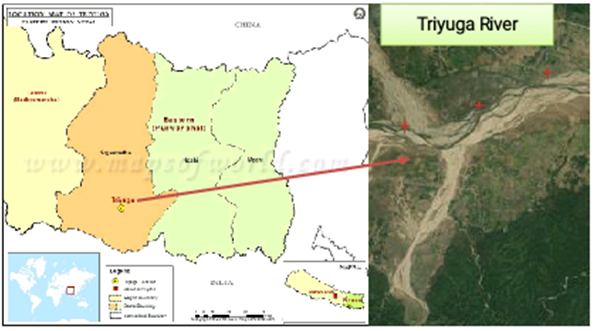
Figure 1
|
Figure 1 Map of the Study Area (Triyuga River) |
The Trijuga (or Triyuga) River Basin is situated in Nepal's Udaypur district, on the Terai and Siwarik borders. The river basin is close to important national transit hubs, where burgeoning trade and commerce with India are conducted both domestically and internationally. In certain areas of the Basin, industrial development, irrigation projects, and traditional fishing operations are currently underway, suggesting that the region has more potential to contribute to the nation's economic growth. As a result, the Trijuga River Basin was given top priority in the government of Nepal's 2019–2020 policies and programs. All of the aforementioned development and the basin's overall sustainable progress will be determined by the mitigation of the frequent flooding and other water-related disasters that have occurred in the basin Worlshop-Trijuga River Master Plan-GWP (n.d.).
2.2. DATA COLLECTION
Samples of river water were taken between the hours of eight
and eleven in the morning and placed in plastic bottles that had been cleaned
with distilled water before being sent to the departments of microbiology and
botany at the MMAM campus in Biratnagar, Nepal. Important chemical variables
like Dissolved oxygen, Iron, Total Alkalinity, Nitrate-nitrogen, Nitrite,
phosphate-phosphorus, ammonium-ammonia, and iron were examined. Using a
multi-parameter water quality monitoring instrument (HANNA), certain water
variables, such as temperature, pH, and TDS, were estimated immediately
following the collection of water samples. The Modified Winkler Method was used
to measure dissolved oxygen (DO), the Phenol Disulfonic
Acid Method was used to measure nitrate-nitrogen (NO3-N), and the Stannous
Chloride Method was used to measure phosphate-phosphorus
(PO4-P). Ammonium, Iron and Arsenic were determined with the help of
‘Field Test Kits', methods. Water samples were collected and analyzed following the standard protocol APHA (2005).
3. RESULTS AND DISCUSSION
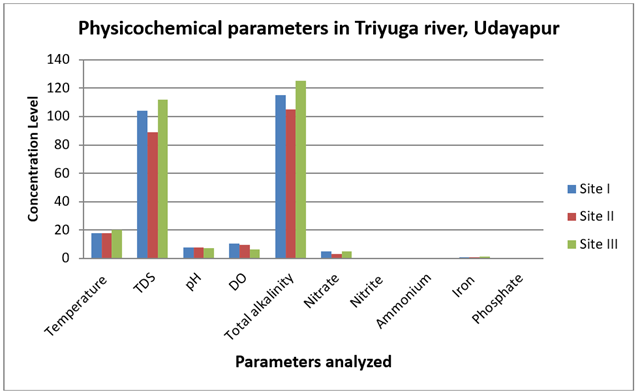
The samples were analyzed during the period of post-monsoon 2020. The physiochemical and bacteriological parameters of three different sites of water measured during the study period. All the results are enumerated in the table1 and Figure 2.
Temperature
The surface water temperature at sites I, II, and III varied from 180C to 200C, with an average of 18.660C degrees. The temperature values recorded at each sampling site fall within the WHO's permissible limit, which is 12-25°C for drinking water. Warmer water than colder water promotes growth and can exacerbate corrosion issues as well as taste, odor, and color issues WHO (2008).
Total dissolved solid (TDS)
The average TDS was 101.66 mg/L, with TDS ranging from 89
mg/L to 112 mg/L from sites I, II, and III, respectively. All of the total
dissolved solid values fell short of the 1200 mg/L WHO guideline. Total
dissolved solid is a measurement of all the organic and inorganic materials
that have been dissolved in a specific amount of water. Total dissolved solids
have an impact on how pure and suitable the water is for irrigation and
drinking. A high concentration of dissolved solids raises the density of water,
affects the osmoregulation of freshwater organisms, decreases the solubility of
gases, and decreases the use of water for industrial, agricultural, and
drinking purposes Saxena
(1989).
Hydrogen- ion- concentration (pH)
The pH values of sites I, II, and III ranged from 7.5 to
7.9, with an average pH of 7.66 and it was generally found to be alkaline, with
values above 7.0 falling within the WHO drinking water standard range. It was
discovered that the majority of the pollution at Site 3 during the study period
came from damping of municipal and residential waste. Because of the organic
matter's breakdown, Site 3's pH is now acidic. The pH of the water at the
disposal site can be greatly impacted by the industrial and municipal waste Mahmood
et al. (1992).
The negative logarithm of a solution's hydrogen ion concentration is called pH which is one of the most crucial elements in the management of water quality, even though it typically has no direct effect on water users Shrivastva et al. (1989). The pH of water may be influenced by a wide range of contaminants, including point and non-point natural sources of water pollutants from residential, commercial, and agricultural activities. Water with a pH of less than 4 has been known to cause eye irritation and redness WHO (1999).
Dissolved oxygen (DO)
The average amount of dissolved oxygen (DO) was 8.8 mg/L,
with values ranging from 6.4 mg/L to 10.4 mg/L from sites I, II, and III,
respectively. Almost all of the sampling sites in the current study had
dissolved oxygen values above the WHO guideline value of 6 mg/L, indicating
anthropogenic contamination of the surface water (river) source. Depletion of
DO was also brought on by increased microbial breakdown of a significant amount
of organic matter at Site 3. The concentration of oxygen is reduced due to
heavy organic matter contamination. Under such circumstances, oxygen in the
water can occasionally completely disappear Trivedy & Goel (1986). It is among the most
crucial elements in determining the quality of the water. The amount of oxygen
dissolved in the water is measured by the amount of dissolved oxygen. It gets into water bodies either by air or as
a byproduct of aquatic plants. The oxygen content of the water can be high or
low. Water that is saturated with oxygen tastes good, while water that is
deficient in oxygen tastes bland.
Total alkalinity (TA)
Total alkalinity is the capacity of water to resist acidification. The alkalinity values provide an idea of the nature of salt present in water. It controls the pH of water bodies, which controls the biota's quality. Human health is not harmed by alkalinity per se. For residential use, water supplies with less than 100 mg/L are preferred Trivedy & Goel (1986). Because of the relationship between alkalinity, carbon dioxide, and pH value, alkalinity can exist in water below the neutral point of pH 7.0 Twort & Crowley (1985). The bicarbonate (HCO3) value ranged from 105mg/L to 125 mg/L from the site I, site II and site III respectively and the average total alkalinity value was 115 mg/L were below the WHO guideline value of 125-350 mg/L. The TDS of river water at Site 3 is increased by more anthropogenic activities, home septic tanks, and the discharge of household waste.
Nitrate (NO3)
The value of nitrate ranged from 3mg/L to 5mg/L from the
site I, site II and the site III respectively and the average nitrate value was
4.33 mg/L. The nitrate values of all samples were below the WHO permissible
limit of 50 mg/L. Through the biochemical activities of microorganisms,
excessive use of nitrogenous fertilizers, organic manures, human and animal
wastes, and industrial effluents contaminate surface water with inorganic
pollutants like nitrate. The contaminated drinking water with excess concentration
of nitrate may cause respiratory disease methaemoglobinaemia
by absorbance of nitrate in blood which prevents oxygen transport in bottle fed
infants upto 4 months Cecil
(1982). This is caused by
conversion of nitrate to nitrite in the stomach and due to this baby may die Annable (1987).
Nitrite (NO2)
The value of nitrite ranged from 0.3 mg/L to 0.5 mg/L from the site I, site II and site III respectively and the average nitrite was 0.43 mg/L. Nitrites are an element of the nitrogen cycle that occur naturally and are chemically inert. It has nitrogen in an oxidation state that is comparatively unstable. Microbial action has the ability to decrease it. Through chemical and biological processes, it can further reduce nitrite to various compounds or oxidize it to nitrate ICAIR Life Systems, Inc. (1987).
Ammonium (NH4)
The value of ammonium ranged from 0mg/L to 0.3mg/L from
the site I, site II and site III respectively and the average ammonium was 0.3
mg/L. Since ammonia in drinking water
does not immediately pose a health risk, no health-based guidelines have been
proposed for it. However, as its concentration level rises and falls, nitrite
formation occurs in distribution systems, manganese removal filters malfunction
and problems with taste and odor arise. Ammonia (NH3)
is converted to ammonium, a positively charged ion, by the addition of a
hydrogen proton. The concentration of dissolved salts in the water, its pH, and
temperature all affect how much ammonium is produced. Ammonium concentrations
that are high can promote the growth of aquatic plants and algae.
Iron (Fe)
The value of iron ranged from 1mg/L to 1.5mg/L L from the site I, site II and site III respectively and
the average iron value was 1.16 mg/L. All the iron values of surface water
samples were found to be above the WHO guideline value of 0.3 mg/L. Iron is
found in most raw waters.
An essential component of human nutrition is iron.
Although the element is not hazardous, it is unattractive because excessive
amounts of it can have a bitter taste, leave brown stains on clothes, and
encourage the growth of iron bacteria, which worsens the quality of the water
by creating slimes or offensive odors Twort & Crowley (1985). When large amounts of
iron are consumed, the condition known as hemochromatosis occurs, causing iron
accumulation to cause tissue damage WHO
(1991).
Phosphate (PO4)
Phosphate was not detected in all the three different sites of water samples. The main structural and nutritional component of biota, phosphorus, is the least abundant and is thought to be the main factor limiting primary production in many freshwater ecosystems Morris & Fan (1998). Through household sewage, agricultural fertilizers, and industrial effluents, it finds its way into water bodies as a pollutant. Since phosphorus is actively absorbed by plants, it is rarely found in fresh water at high concentrations. Before nitrogen becomes limiting, high phosphorus concentrations can be a sign of pollution and cause an algal bloom. Controlling phosphorus levels is necessary for the management of surface water, especially for the supply of drinking water. These levels should also be below the rate at which algae grow ENPHO (2002). Long-term phosphorus consumption is a significant contributor to age-related bone loss Takeda et al. (2004). It is in abundance in igneous rocks and occurs in the form of 187 different minerals Golterman (1975).
Table 1
|
Table 1 Water Quality in Triyuga Rive, Udayapur, Nepal (Post-Monsoon, 2020) |
|||||||
|
S.N. |
Parameters |
Units |
Post-monsoon (2020) |
Average |
WHO Guidelines |
||
|
|
|
|
Site I |
Site II |
Site III |
|
|
|
1 |
Temperature |
00C |
18 |
18 |
20 |
18.66 |
12-25 |
|
2 |
TDS |
(mg/L) |
104 |
89 |
112 |
101.66 |
1200 |
|
3 |
pH |
|
7.9 |
7.6 |
7.5 |
7.66 |
6.5-8.5 |
|
4 |
DO |
(mg/L) |
10.4 |
9.6 |
6.4 |
8.8 |
4-6 |
|
5 |
T. alkalinity |
(mg/L) |
115 |
105 |
125 |
115 |
125-350 |
|
6 |
Nitrate |
(mg/L) |
0.75 |
0.44 |
0.73 |
0.35 |
50 |
|
7 |
Nitrite |
(mg/L) |
0.5 |
0.3 |
0.5 |
0.43 |
3 |
|
8 |
Ammonium |
(mg/L) |
0.3 |
0 |
0 |
0.3 |
1.5 |
|
9 |
Iron |
(mg/L) |
1 |
1 |
1.5 |
1.16 |
0.3 |
|
10 |
Phosphate |
(mg/L) |
0 |
0 |
0 |
0 |
1 |
|
11 |
Fecal coliform |
MPN |
15 |
15 |
21 |
17 |
0 |
All the parameters are expressed in mg/L except Temperature (0C), pH.
Figure 2
|
Figure 2 Physiochemical Analysis of Triyuga River, Udayapur, Nepal (2020) |
Bacteriological Examination (Fecal
coliform)
The value of fecal coliform recorded was 15, 15 and 21 MPN/100ml in Site I, II and III respectively. Surface water microbial pollution can be identified by changes in the abundance of bacterial pollution Kavka & Poetsch (2002). According to Baghel et al. (2005), the presence of bacteria in surface water not only suggests that the water is contaminated with feces, but also raises possible health risks for humans. High indicator bacterial loads are also linked to higher temperatures Isobe et al. (2004). Escherichia is the genus of bacteria that cause feces, with occasional strains of Enterobacter, Citrobacter, and Klebsiella also contributing to the population. Only E. Coli is specifically related to fecal pollution among these organisms WHO (1991). Non-fecal coliforms are slightly more common in animal and human feces than fecal coliforms. Non-fecal coliforms are only recognized as the presumed indicator of fecal contamination because they can also be found in soil and vegetation.
4. CONCLUSION
At Belaka, water of Triyuga River is mainly used for domestic and irrigation purposes and some of them used for drinking purposes also in rural areas. The direct discharge of effluent from home septic tanks, vegetable markets, and household garbage, among other anthropogenic activities, is contaminating the water in this river by combining organic and inorganic contaminants. The quality of drinking water is eventually compromised by these contaminants. Thus, water from this river becomes unsuitable for drinking and other domestic purposes.
Based on the findings of the physiochemical and coliform variables of the surface water (river), it has been determined that the Triyuga River at the study site is contaminated with fecal and household waste materials. The river water that sustains the pollution's nature contains fecal coliform. From a microbiological perspective, water from the studied area should not be used for drinking or household purposes; instead, it should be boiled to eliminate bacteria before being used for any other purpose. The temperature and pH values of three different sites were within the permissible limit of WHO guideline. TDS, Nitrate, Nitrite, Ammonium and Total alkalinity values from all three different sites were below the WHO guideline value. Dissolved oxygen and iron values from all three different sites were above the WHO guideline value.
The results of the current study showed that the river water quality is somewhat contaminated, and they recommend that the necessary precautions be taken to keep these water sources clean. Therefore, the river water can be used for irrigation with precaution, and it is in need for any form of treatment to be used for domestic purposes. Though the present study, was aimed to generate baseline data on surface water quality of study area in Nepal, it needs further detailed investigations, monitoring and treatment to keep the surface water sources of Triyuga River safe for drinking and domestic uses.
CONFLICT OF INTERESTS
None.
ACKNOWLEDGMENTS
We would like to thank the Department of Botany, Mahendra Morang Adarsha Multiple Campus, Biratnagar for the entire assistance in research. We are also grateful to the people of study area for their humble cooperation during the field study.
REFERENCES
APHA (2005). Standard Methods for the Examination of Water and Waste Water, 20th Edition. American Public Association, Washington D. C.
Annable, M. D. (1987). An Introduction to Micchighan's Water Resources. Institute of Water Research. Micchighan State University, Fast Lancing, Macchighan, 64.
Baghel, V., Krishna, G., Sanjay, D, & Durgesh, T. (2005). Bacterial Indicators of Faecal Contamination of the Gangetic River System Right at Its Source. Ecological Indicators. https://doi.org/10.1016/j.ecolind.2004.09.002.
Bhusal, A., & Devkota, A. (2020). Physico-Chemical characteristics of Lakes of Chitwan National Park, Central Nepal, 12(1), 33-39.
Cecil (1982). Textbook of Medicine (Ed J. B. Wyngaarden and L. H. Smith Jr), WB Sounders Co; Philadelphia 894-896.
Das, B. D. & S. K. Chaudhary (2021). Application of Water Quality Index (WQI) for Groundwater Quality Assessment of Biratnagar, Nepal. Our Nature, 19(1), 54-61. https://doi.org/10.3126/on.v19.i1.41260.
Das, B. D. (2017). Assessment of Surface Water Quality of Chimdi Lake of Sunsari District, Nepal. International Journal of Natural Resource Ecology and Management, 2(2), 20-23. https://doi.org/10.11648/j.ijnrem.20170202.11.
Das, B. D., Kumar, B. N., Mishra, R. K. & Choudhary, S. K. (2018). Assessment of Water Quality Index for the Surface Water in Betna Wetland of Morang District, Nepal. Journal of Emerging Technologies and Innovative Research (JETIR), 5(2), 831-834.
Das, B. D., Mishra, R. K., Kumar, A., Kumari, R., Das, V., Paudel, N., & Choudhary, S. K. (2020). Assessment of Surface Water Quality by Using Water Quality Index of Sanbarish Pond of Morang District, Nepal. American Scientific Research Journal for Engineering, Technology, and Sciences (ASRJETS), 63(1), 137-143.
Das, B. D. (2017). Evaluation of Water Pollution Status During Pre-monsoon Period of Fewa Lake, Pokhra, Nepal. EC Microbiology, 11(6), 264-269.
ENPHO (2002). Water Pollution in Kathmandu Valley. ENPHO magazine, 7-16. Environment and Public Health Organization, New Baneshwor, Kathmandu, Nepal.
Gautam, R., Shrestha, J. & Shrestha, G. (2013). Assessment of River Water Intrusion at the Periphery of Bagmati River in Kathmandu Valley. Nepal Journal of Science and Technology, 14(1), 137-146. https://doi.org/10.3126/njst.v14i1.8934.
Golterman, H. L. (1975). Physiochemical Limnology. Elsevier Scientific Publishing CO., NewYork 489.
Hema, S. & Subramani, T. (2013). Study of Physico-Chemical Characteristics of Surface Water Using Regression Analysis of Cauvery River and Its Tributaries in Tamilnadu, India. Asian Journal of Chemistry, 25(6), 3199-3203. https://doi.org/10.14233/ajchem.2013.13590.
ICAIR Life Systems, Inc. (1987). Drinking Water Criteria Document On Nitate Nitrite. Washington, DC, US Environmental Protection Agency, Office of Drinking Water.
Iscen, C. F., Emiroglu Ö., Ilhan, S., Arslan, N., Yilmaz, V. & Ahiska, S. (2008). Application of Multivariate Statistical Techniques in the Assessment of Surface Water Quality in Uluabat Lake, Turkey. Environmental Monitoring and Assessment144, (1-3), 269-276. https://doi.org/10.1007/s10661-007-9989-3.
Isobe, K. O., Tarao, M., Chiem, N. H., Minh, L. Y., & Takada, H. (2004). Effect of Environmental Factors on the Relationship Between Concentrations of Coprostanol and Fecal Indicator Bacteria in Tropical (Mekong Delta) and Temperate (Tokyo) Freshwaters. Appl Environ Microbiol, 70, 814-821.
Kaphle, B., Wang, J. B., Kai, Jl. et al. (2021). Hydrochemistry of Rara Lake: A Ramsar Lake From the Southern Slope of the central Himalayas, Nepal. J. Mt. Sci. 18, 141-158. https://doi.org/10.1007/s11629-019-5910-0.
Karn, S., & Harada, H. (2001). Surface Water Pollution in Three Urban Territories of Nepal, India, and Bangladesh. Environmental Management. 28. 483-96. https://doi.org/10.1007/s002670010238.
Kavka, G. G., & Poetsch, E. (2002). Microbiology. In: Literathy P, KollerKreimel V, Liska I (eds) Technical Report of the International Commission for the Protection of the Danube River. Eigenverlag ICPDR, Vienna, 138-150.
Maharjan, L. D. (2006). Water Quality of KodkuKhola, Lalitpur, Nepal.
Mahmood, N., Chowdhury, M.S.U., Hossain, M.M., Haider, S.M.B. & Chowdhury, S.R. (1992). Review of the State of Environment Relating to Marine Fisheries of Bangladesh. Country status report. BOBP (FAO) MS. CU, 85.
Miller, G. T. (2002). Living in the Environment. Wads Worth Publishing Company, Belmont, California.
Mishra, R. K., Das, B. D., Kumar, P. C., Choudhary, J., Jha, S. K., Kumari, R., Choudhary, S.K. & Paudel, N. (2020). Arsenic in Surface Waters: A Report from River Ganga and its Tributary Jamania at Bhagalpur, Bihar, India. American Scientific Research Journal for Engineering, Technology, and Sciences (ASRJETS), 71(1), 272-281.
Morris, G.L., & Fan, J. (1998). Reservoir Sedimentation Handbook: Design and Management of Dams, Reservoirs and Watersheds for Sustainable Use. The McGraw-Hill companies, Inc., New York.
Raut, R., Sharma, S., Bajracharya, R., Sharma, C., & Gurung, S. (2013). Physico-Chemical Characterization of Gosainkunda Lake. Nepal Journal of Science and Technology, 13(1), 107-114. https://doi.org/10.3126/njst.v13i1.7449.
Saxena, M. M. (1989). Environmental Analysis. Water, Soil and Air. Agro Botanical Publishers, India.
Shah, B., & Pant, B. (2013). Water Quality Assessment of Sirsiya River. Nepal Journal of Science and Technology. https://doi.org/10.3126/njst.v13i2.7727.
Shrestha, U., Shrestha, J., & Devkota, R. (2015). Assessment of Water Quality of KolpuKhola in Sisdol Landfill Area of Nuwakot District. Nepal Journal of Science and Technology, 15(1), 107-114. https://doi.org/10.3126/njst.v15i1.12026.
Takeda, E., Taketani, Y., Sawada, N., Sato, T. & Yamamoto, H. (2004). The Regulation and Function of Phosohate in the Human Body. BioFactors (Oxford, England), 21, 345-55. https://doi.org/10.1002/biof.552210167.
Trivedy, R. K., & Goel, P. K. (1986). Chemical and Biological Methods for Water Pollution Studies. Environmental Publications, Karad (India), 1-125.
Twort, A. C., & Crowley, F. W. (1985). Water Supply. Edward Arnold (Publishers) Ltd. London.
UNEP (2009). Water Security and Ecosystem Services. The Critical Connection. A Contribution to the United Nations World Water Assessment Programme (WWAP). Country Done this Study (Unit Nation Environmental Programme (UNEP).
WHO (1991). Guidelines for Drinking-Water Quality, Vol: I, II and III. World Health Organization, Geneva.
WHO (1999). Guidelines for Drinking - Water Quality, Vol. 2, Health Criteria and Other Supporting Information, 2nd Ed., World Health Organization, Ganeva.
WHO (2008). Guidelines for Drinking- Water Quality 3rd Ed.
WHO (2010). Global Health Observatory (GHO) Reports World Health Statistics. Retrived 2010, September 5.
Worlshop-Trijuga River Master Plan-GWP (n.d.).
 This work is licensed under a: Creative Commons Attribution 4.0 International License
© Granthaalayah 2014-2024. All Rights Reserved.