
COMPATIBILITY ANALYSIS OF THE SOIL CALCIUM CONTENT BY MULTIFREQUENCY EC SENSORS
János Horváth 1![]()
![]() ,
Dr. László Kátai 2
,
Dr. László Kátai 2![]()
![]() ,
Dr. István Szabó 2
,
Dr. István Szabó 2![]()
![]()
1 Ph.D.
Student, Doctoral School of Mechanical Engineering, Hungarian University of
Agriculture and Life Sciences, Páter Károly utca 1, 2100 Gödöllő,
Hungary
2 Professor,
Institute of Technology, Hungarian University of Agriculture and Life Sciences,
Páter Károly utca 1, H-2100
Gödöllő, Hungary
|
|
|
ABSTRACT |
|
|
Nowadays in precision agriculture, the on-the-go measurement of soil
nutrients is an important research topic in the sustainable nutrient
management practices. Determining the nutrient content of soils and the
judicious and site-specific replacement of missing mineral compounds of soil
has a major impact on production costs in terms of current fertilizer prices.
Soil sensors currently on the market can only determine total soil salinity.
Therefore, selective soil salinity testing is only possible using laboratory
methods. However, these methods are rather expensive, slow, and cumbersome.
Growers often need faster and cheaper soil sampling process and immediate
results. We believe that by developing measurement models of soil sensors,
the data delivery process could be significantly shortened, so that
measurement results could be processed and used even in real time. In this
paper, we prove that electrical conductivity measurements can be a suitable
tool for the determination of the selective salinity of soil. In our
experiments, the calcium cation content of soil was measured by conductometry
in laboratory conditions. In our model, we investigated the effect of a
reasonable and well-considered variation of the measuring current frequency
on the measurement output variable, i.e. the electrical conductivity (often
abbreviated as EC) value. Our experiments have shown that with
multi-frequency, solutions containing predetermined concentrations of Ca2+
ions, the EC obtained as an output parameter follows different functions. |
|||
|
Received 29 November 2023 Accepted 30 December 2023 Published 13 January 2024 Corresponding Author János
Horváth, Horvath.Janos.7@phd.uni-mate.hu DOI 10.29121/granthaalayah.v11.i12.2023.5437 Funding: This research
received no specific grant from any funding agency in the public, commercial,
or not-for-profit sectors. Copyright: © 2023 The
Author(s). This work is licensed under a Creative Commons
Attribution 4.0 International License. With the
license CC-BY, authors retain the copyright, allowing anyone to download,
reuse, re-print, modify, distribute, and/or copy their contribution. The work
must be properly attributed to its author.
|
|||
|
Keywords: Electrical Conductivity, Selective Soil
Salinity, Variable Frequency |
|||
1. INTRODUCTION
1.1. COMPOSITION OF Minerals IN SOIL SOLUTION and the hydrated shells
Effective
agricultural soil management should consider the structural, biological, and
mineral aspects of soil health, extending beyond the focus on nitrogen (N),
phosphorus (P), and potassium (K), to ensure the production of nutritionally
dense food Patel (2016) . The soil moisture contains a
diverse array of inorganic salts, organic matter, and gases. Mineral salts that
dissolve in the soil are dissociated into ions carrying positive and negative
charges, each surrounded by a hydrate shell. The predominant ions found in the
soil solution include:
·
Ca2+,
Mg2+, Na+, K+, NH4+ and
in some soils Al3+, Fe3+ or Fe2+ (as cations)
·
HCO3–,
CO32–, Cl–, SO42–, NO3–,
H2PO4–, HPO42– (as anions).
Most dissolved organic compounds in soil comprise organic acids and low-molecular-weight humic substances, with the most notable dissolved gases being CO2 and O2. Soluble substances in the soil primarily result from weathering and soil formation processes. Partial root contact with soil particles and the soil solution limits the effective absorption of nutrients by plant roots. Furthermore, the soil texture plays a significant role in determining the soil's capacity to retain air, water, and nutrients Mbosowo & Ebinimitei (2018). However, salts can also infiltrate the soil solution through groundwater in proximity to the surface. Furthermore, the application of fertilizers and compounds in irrigation water in agricultural regions can alter the soil's salinity Stefanovits et al. (2005). The exploration of the interaction between solvated ions and water has garnered significant attention due to its pivotal role in diverse chemical, biological, and environmental processes Waluyo et al. (2011). Numerous experimental and theoretical studies have delved into aqueous solutions of ions, both in bulk Ohtaki & Radnai (1993), Marcus (2010), Jungwirth & Tobias (2006), Craig & Henry (2009).
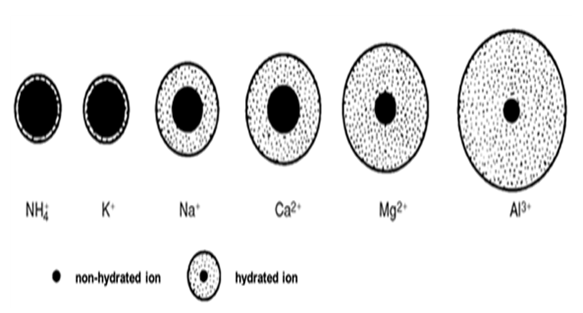
Figure 1 illustrates the size of the hydrate
shell in aqueous solution. The thickness of the hydrate sphere in the solution
is influenced by the diameter of the dehydrated cation and its charge.
Generally, the smaller the diameter of the dehydrated cation and the higher its
charge, the thicker the hydrate sphere in the aqueous solution. This
characteristic also impacts the mobility of hydrated ions. Notably, potassium
stands out as the most mobile element in the soil, making it readily available
to plants. However, caution is necessary to prevent its leaching from the
vadose zone of the soil due to its high mobility Dayo-Olagbende
& Ewulo (2021).
Figure 1
|
Figure 1 The Dimensions of the Aqueous Hydrate Envelope for Each Element in the Soil, As Outlined by Stefanovits et al. (2005) |
Indeed,
the common cations found in soil exhibit a broad spectrum of sizes, as depicted
in Figure 2. Research by Rengasamy (1998) demonstrated that the dispersive
impact of Na surpasses that of K, while the flocculating effect of Ca is more
pronounced than that of Mg. Traditionally, these cations have been referred to
as base or base-forming cations Rengasamy (2016). The hydrated radii of these
cations play a crucial role in shaping the composition of soil.
Figure 2

|
Figure 2 The Ionic and Hydrated Radii, Expressed in Angstroms, For Certain Common Ions are Detailed in Research Conducted by Luo et al. (2019). |
1.2. ASSESSING SOIL nutrient PROPERTIES THROUGH THE soil SENSORS
In the
realm of crop production sensor measurements, various sensor categories are
employed, including crop sensors, environment sensors, function monitoring
sensors, and soil sensors. In investigating the trend of sensor-based
solutions, it becomes evident that the future of site-specific crop production
is evolving towards a sensor-centric approach. This shift is driven by the
ongoing challenge in precision agriculture—swift and cost-effective acquisition
of crucial soil characteristics Hajdú (2018).
Nowadays,
sensor technology stands out as one of the rapidly advancing domains in
precision agriculture. A soil sensor, for instance, serves as a tool capable of
identifying alterations in the physical or chemical characteristics of the
soil, translating them into electrical signals, electric currents, and
voltages. Precision agriculture hinges on the continuous monitoring of soil
conditions through the integration of information technology and GPS technology
Mandal et al. (2021). Subsequently, the gathered data is
analysed to manage the spatial-temporal variations in both soil and field
crops. Gathering, processing, and analyzing data are
essential elements of precision agriculture, which seeks to enhance
agricultural productivity Kukadiya and Meva (2023). In the future the evolution of
sophisticated, intelligent AI algorithms that possess the capability to learn,
adapt, and potentially take autonomous actions, as opposed to merely adhering
to predetermined instructions, marks a pivotal moment for innovators and
technology providers Trisal & Mandloi
(2021). This valuable information guides
decisions regarding the specific application of crop inputs, encompassing the
judicious use of water and fertilizers. The adoption of such technology holds
the potential to enhance efficiency while simultaneously curbing losses
associated with water and fertilizer usage Popp et al. (2018).
Calcium
plays a major role in developing the strength of the cell wall, helping to
record potassium, phosphorus, and nitrogen. It reduces sodium uptake, thereby
increasing the salt tolerance of the plant, which is an advantage for saline
soils. It is essential for root growth, which without calcium does not grow but
dies. The escalating costs of fertilizer and growing environmental concerns
related to chemical run-off into drinking water sources have propelled
precision agriculture and site-specific management to the forefront of
contemporary technological advancements in agriculture and ecology. With the
rising expenses of fertilizer production inputs, notably nitrate (N), phosphate
(P), and potassium (K), those involved in agriculture seek ways to optimize
plant yield while minimizing the application and consumption of fertilizers.
Given that these macro-nutrients exhibit variations even on a small scale
within a cultivated field, numerous researchers have endeavored
to create an on-the-go sensing device capable of mapping the presence of these
chemicals in situ. This map, when overlaid with parameters like pH, electrical
conductivity (EC), crop yield, and soil mechanical properties, can provide a
precise prescription for fertilizer application that varies spatially Sinfield et al. (2010).
In 2020,
the global Agricultural Sensors market achieved a valuation of USD 1,505.4
million, and it is projected to attain USD 3,200.8 million by 2028,
demonstrating a Compound Annual Growth Rate (CAGR) of 11.04%. Smart Sensors
empower farmers to optimize yields while minimizing resource usage, including
fertilizer, water, and seeds. Through the integration of sensors and field
mapping, farmers can effectively manage their crops at a micro-scale,
conserving resources and mitigating environmental impacts. The roots of smart
agriculture trace back to the 1980s when Global Positioning System (GPS)
capabilities became available for civilian use. The accurate mapping of crop
fields enabled farmers to monitor and apply fertilizer and weed treatments
precisely where needed. In the 1990s, early adopters of precision agriculture
utilized crop yield monitoring to generate recommendations for fertilizer and
pH corrections. As technological advancements allowed for more variables to be
considered in crop models, more accurate suggestions for fertilizer
application, irrigation, and optimal yield harvesting became possible ICT - Agricultural Sensors
Market. (2022).
Numerous
researchers and manufacturers are actively working on on-the-go soil sensors
designed to directly assess the mechanical, physical, and chemical properties
of the soil. While these widely adopted ground sensors may be less precise
compared to individual sampling and laboratory tests, their practical advantage
lies in their rapid measurement capabilities, making them a more economical
choice in practice Hajdú (2018). In the times ahead, there will be
widespread access to faster and more cost-effective measurement tools for
mechanized soil testing and nutrient mapping solutions. Achieving sustainable
agricultural and environmental management requires a deeper comprehension of
soil characteristics at increasingly precise scales. Traditional methods like
soil sampling and laboratory analyses, being slow and expensive, fall short in
delivering this essential information Adamchuk & Rossel (2010).
Proximity
detection is characterized by the utilization of sensors deployed in the field
to capture signals from the ground, where the sensor unit is either in direct
contact with or close to the ground (within 2 m), as defined by Viscarra Rossel et al. (2011). In practical terms, the following
measurement principles and sensors are differentiated, as outlined by Grunwald et al. (2015):
·
Electrical
Conductivity Sensors (EC)
·
Ground
Penetrating Radar and Reflectometers
·
VIS-NIR-MIR
Diffuse Reflectance Sensors
·
Magnetic
Susceptibility Sensors
·
Gamma-Ray
sensors
·
X-ray
Sensors
·
Additional Proximal Soil Sensors, such as
photoacoustic spectroscopy, laser-induced breakdown spectroscopy, laser-induced
fluorescence spectroscopy, and inelastic neutron scattering, are available.
Mechanical sensors gauging soil penetration resistance have been widely
employed and integrated into soil science and precision agriculture alongside
other sensors. These applications span from assessing soil compaction to
creating 3D models of soil layers.
Certainly, the various sensors can be combined as needed, termed as a multisensory measurement.
1.3. Conductometry in soil sEnsor technology
Soil characteristics often exhibit substantial variation within a field, posing a challenge in precision agriculture where acquiring sufficient soil data is crucial for accurately understanding this variability. Soil electrical conductivity (EC) has emerged as a widely adopted tool for mapping soil diversity within fields, with correlations typically established with soil texture, moisture, and salinity. Soil texture, being a critical factor in crop yields, influences water-holding capacity, cation-exchange capacity, rooting depths, drainage, and other properties impacting crop production Lund (2008).
Electrical conductivity characterizes the good conductance of components. Conductometry, an analytical method, is based on measuring the electrical conductivity of solutions. In analytical chemistry, the measurement of electrical conductivity in electrolyte solutions provides analytical information, with insights derived from changes due to chemical reactions. The conductivity of materials (denoted as G, with the unit in siemens, S) is the reciprocal of their electrical (ohmic) resistance (denoted as R, with the unit in ohms, Ω). Electric conduction necessitates the presence of charge carriers (e.g., electrons or anions and cations) capable of movement under the influence of an electric field. Ion migration in the solution due to the electric field facilitates the electrical conduction of solutions. This underlies the distinction between electrical conductors and insulators.
Pure (distilled) water, containing minimal charge carriers at a concentration [H+] = [OH–] ≈ 10–7 mol L-1 corresponding to autoproteolysis, conducts electricity to a negligible extent, rendering it essentially an insulator. However, the concentration of cations and anions in aqueous solutions of electrolytes can be significant, rendering them conductive based on the degree of electrolytic dissociation. Each ion in the solution contributes to the conduction value, and while these contributions are inseparable, conductometry is not suited for the selective measurement of individual ions, making it a non-ion-specific method Galbács et al. (2015).
· Consequently, its analytical application is limited to systems that either contain only a single electrolyte (where the "background" contribution is negligible)
· or undergo chemical reactions altering the mobility of ions, significantly deviating from a non-zero "background" Galbács et al. (2015).
The global issue of soil salinization poses a significant threat to land productivity Hossain (2019). Saline soils have been identified in over 100 countries, covering more than 1,125 million hectares of land Wicke et al. (2011). With an annual increase of approximately 1–2%, it is estimated that by 2050, soil salinity could affect 50% of available arable lands, posing a serious challenge to the sustainable development of global agriculture Massoud (1981).
The measurement of electrical conductivity stands out as a crucial in-situ tool for soil testing essential in precision farming practice. Consequently, a substantial body of literature focuses on the development of EC detectors. These detectors typically employ a traditional four-electrode configuration Li et al. (2006), Seifi et al. (2010), Pei et al. (2012). The conventional current-voltage four-electrode method is designed for in-situ measurements, aiming to develop an affordable, user-friendly, and precise in-situ soil EC detector with integrated control and data processing procedures Seifi et al. (2010). Apparent soil electrical conductivity, derived through this method, serves as a simple and cost-effective means of obtaining valuable information about soil characteristics crucial for precision agriculture Seifi et al. (2010).
This
paper aims to present fundamental research on measuring the selective calcium
content of soil through multifrequency electrical conductivity measurements
based on conductometry principles as is EC measurement. This basic research
within the framework of the Hungarian University of Agriculture and Life
Sciences, Institute of Technology soil sensor research project, focuses on
methodological advancements to replace slower, more complex, and relatively
expensive laboratory determinations of salinity with as many on-the-go
measurements as possible. It is important to note that, to the best of current
knowledge, conductivity tests using soil sensors alone may not be sufficient to
infer the salinity properties of a given field. The measurement is influenced
by factors such as the uneven distribution of nutrients, varying pH conditions,
diverse particle compositions, differences in organic matter content, and even
temperature fluctuations Corwin & Lesch (2005).
2. Methods and Materials
2.1. SpecificationS
2.1.1. Solutions
The experiments took place at the Institute of Technology laboratory within the Hungarian University of Agriculture and Life Sciences, maintaining a constant temperature of 22 ℃. Both solutions and soil were subjected to measurements under these conditions.
The objective of the study was to investigate the impact of cations from dissolved salts in soil moisture under natural conditions. Calcium ions (Ca2+) were selected for examination due to the pressing and costly concern of judiciously replacing Ca2+ microelements in cultivated plants. To introduce these ions into the soil solution, water-soluble salts were utilized, specifically the chloride salts of the Ca2+ cation. For the experiment, 1 M concentration (1 M = 1 mol dm-3) stock solutions were prepared from Calcium chloride (CaCl2), 99.0 - 103.0%, CAS: 10043-52-4. These solutions underwent further dilution using a series of concentrations: 1 M; 0.66 M; 0.33 M, and distilled water, where 0 M served as the reference measurement. To prevent measurement errors, the system was consistently rinsed with distilled water between measurements, ensuring any residual ions on the electrode from the prior measurement did not influence the subsequent results.
2.1.2. soil
For our
research, the soil sample were taken with pHH2O < 7 and
undetectable CaCO3 content from Szárítópusta,
Gödöllő, from 0-20 cm layers of arable land (47°
35' 47.65" N, 19° 21' 18.54" E). According to the classification of
the IUSS working group WRB, 2015, the soil type was identified as Eutrict Arenosol (Aeolic, Aric,
Ochric, Raptic) soil at 232 m altitude, characterized
by a sandy texture.
2.1.3. Hardware for measurement circle
Components of the measurement circuit, as illustrated in Figure 3, include:
1) SOURCETRONIC
ST2829C Precision LCR meter with USB memory stick.
2) SOURCETRONIC
ST26011B Test Fixture: The instrument features a resolution of 0.00001 nS and a basic accuracy of 0.05%. The voltage applied to
the electrodes during measurement is 10 V DC, and the
instrument's output impedance is 100 Ω.
3) KSP‐F01A
Dosing Pump.
4) Measuring
cup (500 ml, 50 ml increments) utilized for storing the input solution.
5) Measuring
cylinder with dimensions of Ø 61 mm x 137 mm.
6) Two
measuring electrodes with Ø 2 mm, a length of 80 mm (full length insulated,
uninsulated part length 5 mm), a probe distance of 12 mm, made of stainless
steel.
7) Piping with
an inner diameter of Ø 3 mm.
8) Tray with a
raiser.
Figure 3

|
Figure 3 The Measurement Circuit |
2.2. the measurement procedure
The precision LCR meter conducted measurements,
registering electrical conductivity between two stainless steel electrodes
immersed in predefined soil solutions following a predetermined program
frequency. After completing the measurement sequence, the system initiated a
continuous cycle, restarting the measurement process endlessly. Frequency
values employed for the measurements were documented within the range of 20 Hz
to 106 Hz.
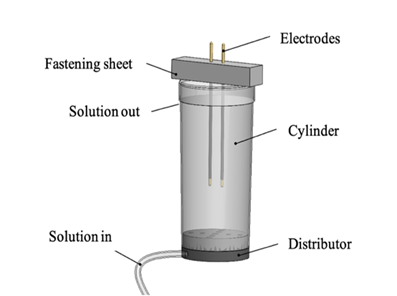
Each new measurement cycle commenced with the
calibration of the peristaltic pump, ensuring a liquid delivery rate of 0.5 g s-1.
Throughout the measurements, the pump at the bottom of the measuring cylinder
propelled the liquid solution into the cylinder (refer to Figure 4). The solution was
introduced into the cylinder through a 3D-printed distribution plug, ensuring
uniform saturation of the soil within the cylinder. Exiting the measuring
cylinder through perforations at the top, the solution collected on the tray
beneath, facilitating the continuous removal of used output liquid.
Figure 4
|
Figure 4 The Measurement Cylinder and Associated Components |
Prior to initiating each new measurement, the soil
pastes in the measuring cylinder underwent rinsing with distilled water. This
precautionary step aimed to prevent any influence from ions lingering from the
preceding measurement on the current results. The experiments were iterated
three times for each mixed input solution, involving the addition of 300 ml of
the input solution in each instance, followed by neutralization using 300 ml of
distilled water. If the electrical conductivity of the soil paste remained
above 0.1 mS during washing, an additional rinse with 100 ml of distilled water
was conducted. Each measurement was replicated three times.
3. Results and Discussions
3.1. the behaviour of calcium solutions in SOIL
Based on
the measurements with Calcium chloride solutions of different concentrations,
the arithmetic mean of the measured electrical conductivity (EC) values was
calculated for each concentration and frequency. This was done by examining the
adjacent values and averaging them if the variation did not exceed 5 % (Δ
< 5 %). Consequently, frequency-dependent averages were obtained for the
overall measurement. Then, after performing the necessary calculations, the
measurement results of the calculated data series per ion, per concentration
and per measurement frequency were recorded. The result of the measurement is
shown in Figure 5.
Figure 5

|
Figure 5 Electrical Conductivity (EC) Values for Various Concentrations of CaCl2 Solutions, Along with Standard Deviation |
It should
be observed that:
·
The
distilled water (0M), representing the reference data series, is not visible
due to its nearly zero values.
·
The
measurement at 5 kHz frequency is flawed, evident from the extent of scatter in
the data.
·
The
measured values were evaluated for measurement reliability using the standard
deviation of the mean estimate as shown in Figure 5.
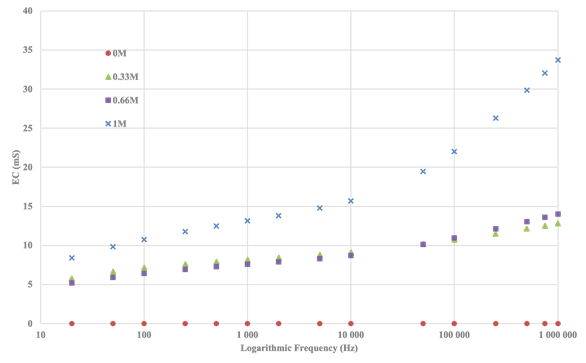
It was
evaluated that by plotting the variations of the electrical conductivity (EC)
of the tested concentrations on a logarithmic scale, we can better elucidate
the different behaviour of the solutions. Figure 6 not only illustrates the
correlation between increasing concentration and increasing EC, but also
highlights that as the measurement frequency increases, the measured EC value
also increases.
Figure 6
|
Figure 6 Electrical Conductivity (EC) Values for Varied Concentrations of CaCl2 Solutions Across Logarithmic Frequency Scales. |
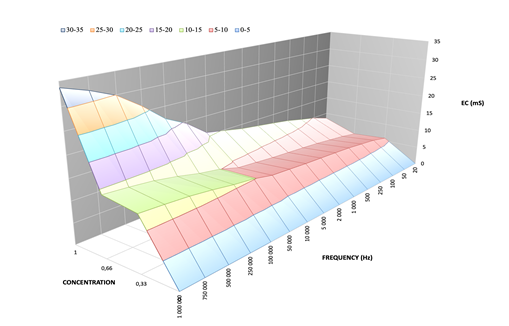
Representing
the measurements in a 3D space provides a more pronounced illustration of the behavior of the solutions, as depicted in the ensuing
diagrams in Figure 7.
Figure 7
|
Figure 7 Electrical Conductivity (EC) Portrayed in Relation to Ca2+ Concentration and Frequency |
Ultimately,
by graphing the frequency on a linear scale and plotting the EC measurement
outcomes for solutions of varied concentrations, fitting a function to the
acquired points was performed, with a consideration that R2 >
0.9. The reference functions for the diverse Ca2+ cation
concentrations are delineated in Figure 8.
Figure 8
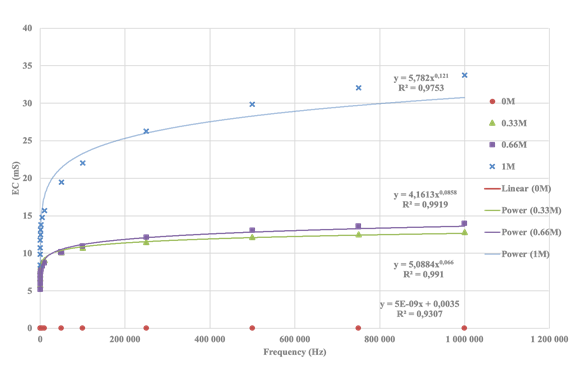
|
Figure 8 EC Saturation Curve for Solutions with Different Ca2+ Concentrations |
The
reference functions for the calcium (Ca2+) cation in the established
measurement model are as follows, demonstrating a highly accurate fit:
·
1M
solution: ![]() , R2=0.9753
, R2=0.9753
· 0.66M solution: ![]() R2=0.9919
R2=0.9919
·
0.33M
solution: ![]() , R2=0.991
, R2=0.991
· 0M solution as is distilled water: ![]() , R2=0.9307
, R2=0.9307
4. Conclusion
As soil
sensors become more widespread, on-the-fly measurement of important soil
properties such as nutrient content will allow farmers to get immediate
information on the condition of the soil as the most important resource for
production. This measurement method not only saves resources, but also
minimises environmental impact through the judicious and site-specific
application of nutrients. The use of soil sensors facilitates rapid, real-time,
and cost-effective soil testing and nutrient mapping solutions Trosin et al. (2021), Khan et al. (2021).
In the
present study, we sought to answer whether one of the simplest, most
economical, and widely used measurement methods - a novel approach to measuring
electrical conductivity - could provide an opportunity for selective laboratory
measurement of soil salinity. Our experiments showed a significant correlation
between the relative concentration of Ca2+ in soil, the measurement
frequency, and the measured electrical conductivity (EC). As the measurement
frequency increased, the measured EC of CaCl2-saturated soil varied
according to the functions detailed in the results and increased with
increasing frequency in a manner that could be described by functions.
In the future, our aim is to develop a mathematical model that can be used to guide the estimation of the selective salinity of soil under laboratory conditions using the conductometric method. An interpolation model based on regression functions of reference values shows that by systematically varying the measurement frequencies, the selective salinity of a known soil can be determined by EC measurements under laboratory conditions. For solutions with identical Ca2+ ion concentrations, EC saturates according to different functions depending on the measurement frequency.
CONFLICT OF INTERESTS
None.
ACKNOWLEDGMENTS
We would like to acknowledge the Hungarian University of Agriculture and Life Sciences, Institute of Technology for the financial support and the for the great interest work and concession of their areas allowing this work could be carried out. The authors would like to thank Imre Czinkota for his intellectual suggestions when preparing the article.
REFERENCES
Adamchuk, V. I., & Rossel, R. A. V. (2010). Development of On-the-Go Proximal Soil Sensor Systems. In R. A. Viscarra Rossel, A. B. McBratney, & B. Minasny (Eds.), Proximal Soil Sensing. Springer Netherlands, 15–28. https://doi.org/10.1007/978-90-481-8859-8_2.
Corwin, D. L., & Lesch, S. M. (2005). Apparent Soil Electrical Conductivity Measurements in Agriculture. Computers and Electronics in Agriculture, 46(1–3), 11–43. https://doi.org/10.1016/j.compag.2004.10.005.
Craig, V. S. J., & Henry, C. L. (2009). Specific Ion Effects at the Air–Water Interface: Experimental Studies. In W. Kunz, Specific Ion Effects, 191–214. World Scientific. https://doi.org/10.1142/9789814271585_0007.
Dayo-Olagbende, G.O., & Ewulo, B.S. (2021). Ionic Mobility of Cations as Affected by Redox Status of Two Different Soil Textures. Bulgarian Journal of Soil Science, 6(1), 18–32. https://doi.org/10.5281/ZENODO.4887052.
Galbács, G., Galbács, Z., & Sipos, P. (2015). Instrumental Analytical Chemistry Exercises. JATEPress. (in Hungarian).
Ghosal, S., Hemminger, J. C., Bluhm, H., Mun, B. S., Hebenstreit, E. L. D., Ketteler, G., Ogletree, D. F., Requejo, F. G., & Salmeron, M. (2005). Electron Spectroscopy of Aqueous Solution Interfaces Reveals Surface Enhancement of Halides. Science, 307(5709), 563–566. https://doi.org/10.1126/science.1106525.
Grunwald, S., Vasques, G., & Rivero, R. (2015). Fusion of Soil and Remote Sensing Data to Model Soil Properties. Advances in Agronomy, 131, 1–109. https://doi.org/10.1016/bs.agron.2014.12.004.
Hajdú, J. (2018). Quick Soil Testing and Soil Mapping. Agronapló, 22, 65–67. (in Hungarian).
Hossain, S. (2019). Present Scenario of Global Salt Affected Soils, its Management and Importance of Salinity Research. International Journal of Biological Sciences, 1(1), 1–3.
ICT - Agricultural Sensors Market. (2022, August 28).
Jungwirth, P., & Tobias, D. J. (2006). Specific Ion Effects at the Air/Water Interface. Chemical Reviews, 106(4), 1259–1281. https://doi.org/10.1021/cr0403741.
Khan, S. I., Rahman, A., Islam, S., Nasir, M. K., Band, S. S., & Mosavi, A. (2021). IoT and Wireless Sensor Networking-Based Effluent Treatment Plant Monitoring System. Acta Polytechnica Hungarica, 18(10), 205–224. https://doi.org/10.12700/APH.18.10.2021.10.11.
Kukadiya, H, and Meva, D. (2023). Machine Learning in Agriculture for Crop Diseases Identification: A Survey. International Journal of Research - GRANTHAALAYAH, 11(3), 87–100. https://doi.org/10.29121/granthaalayah.v11.i3.2023.5099.
Li, M., Wang, M., & Wang, Q. (2006). Development and Performance Test of a Portable Soil EC Detector. Applied Engineering in Agriculture, 22(2), 301–307.
Lund, E. D. (2008). Soil Electrical Conductivity. In Soil Science Step-by-Step Field Analysis. John Wiley & Sons, Ltd 137–146. https://doi.org/10.2136/2008.soilsciencestepbystep.c11.
Luo, J., Ye, S., Li, T., Sarnello, E., Li, H., & Liu, T. (2019). Distinctive Trend of Metal Binding Affinity via Hydration Shell Breakage in Nanoconfined Cavity. The Journal of Physical Chemistry C, 123(23), 14825–14833. https://doi.org/10.1021/acs.jpcc.9b03004.
Mandal, M., Paramanik B., Sarkar A., and Mahata D. (2021). Precision Farming in Floriculture. International Journal of Research - GRANTHAALAYAH, 9(1), 75-77. https://doi.org/10.29121/granthaalayah.v9.i1.2021.2871.
Marcus, Y. (2010). Effect of Ions on the Structure of Water. Pure and Applied Chemistry, 82(10), 1889–1899. https://doi.org/10.1351/PAC-CON-09-07-02.
Massoud, F. I. (1981). Salt Affected Soils at a Global Scale and Concepts for Control, 21. Rome, FAO.
Mbosowo, E. M. & Ebinimitei C. S. (2018). The Effect of Soil Conditions on the Physiological Indices of Costus Afer ker gawl. International Journal of Research - Granthaalayah, 6(1), 362-367. https://doi.org/10.29121/granthaalayah.v6.i1.2018.1630.
Ohtaki, H., & Radnai, T. (1993). Structure and Dynamics of Hydrated Ions. Chemical Reviews, 93(3), 1157–1204. https://doi.org/10.1021/cr00019a014.
Patel, A. (2016). Addressing Soil Health Management Issues in india. International Journal of Research - Granthaalayah, 4(12), 110-123. https://doi.org/10.29121/granthaalayah.v4.i12.2016.2399.
Pei, X., Zheng, L., Zhao, Y., Zhang, M., & Li, M. (2012). Development and Performance Test for a New Type of Portable Soil EC Detector. AICT-392(Part I), 418. https://doi.org/10.1007/978-3-642-36124-1_50.
Popp, J., Erdei E., & Oláh J. (2018). The Prospects of Precision Agriculture in Hungary. International Journal of Engineering and Management Sciences, 3(1), Article 1. (in Hungarian). https://doi.org/10.21791/IJEMS.2018.1.15.
Rengasamy, P. (1998). Processes Involved in Sodic Behaviour. In ‘Sodic Soils. Distribution, Properties, Management, and Environmental Consequences’. (Eds ME Sumner, R Naidu), 35–50.
Rengasamy, P. (2016). Soil Chemistry Factors Confounding Crop Salinity Tolerance—A Review. Agronomy, 6(4), 53. https://doi.org/10.3390/agronomy6040053.
Seifi, M. R., Alimardani, R., & Sharifi, A. (2010). Design and Development of a Portable Soil Electrical Conductivity Detector. Asian Journal of Agricultural Sciences, 2(4), 168–173.
Sinfield, J. V., Fagerman, D., & Colic, O. (2010). Evaluation of Sensing Technologies for on-the-go Detection of Macro-Nutrients in Cultivated Soils. Computers and Electronics in Agriculture, 70(1), 1–18. https://doi.org/10.1016/j.compag.2009.09.017.
Stefanovits, P., Filep, Gy., & Füleky, Gy. (2005). Soil science. Mezőgazda.
Trisal, A., & Mandloi, D. D. (2021). Machine Learning: An Overview. International Journal of Research - GRANTHAALAYAH, 9(7), 343-348. https://doi.org/10.29121/granthaalayah.v9.i7.2021.4120.
Trosin, M., Dekemati, I., & Szabó, I. (2021). Measuring Soil Surface Roughness with the RealSense D435i. Acta Polytechnica Hungarica, 18(6), 141–155. https://doi.org/10.12700/APH.18.6.2021.6.8.
Viscarra Rossel, R. A., Adamchuk, V. I., Sudduth, K. A., McKenzie, N. J., & Lobsey, C. (2011). Chapter Five - Proximal Soil Sensing: An Effective Approach for Soil Measurements in Space and Time. In D. L. Sparks (Ed.), Advances in Agronomy, 113, 243–291. https://doi.org/10.1016/B978-0-12-386473-4.00005-1.
Waluyo, I., Huang, C., Nordlund, D., Bergmann, U., Weiss, T. M., Pettersson, L. G. M., & Nilsson, A. (2011). The Structure of Water in the Hydration Shell of Cations from X-Ray Raman and Small Angle X-Ray Scattering Measurements. The Journal of Chemical Physics, 134(6), 064513. https://doi.org/10.1063/1.3533958.
Wicke, B., Smeets, E., Dornburg, V., Vashev, B., Gaiser, T., Turkenburg, W., & Faaij, A. (2011). The Global Technical and Economic Potential of Bioenergy From Salt-Affected Soils. Energy & Environmental Science, 4(8), 2669–2681. https://doi.org/10.1039/C1EE01029H.
 This work is licensed under a: Creative Commons Attribution 4.0 International License
© Granthaalayah 2014-2024. All Rights Reserved.

