APPLICATION OF THE TAM MODEL AND FINANCIAL LITERACY IN QRIS DIGITAL PAYMENT DECISIONS (STUDY ON SEMARANG STATE POLYTECHNIC STUDENTS)
Edi Wijayanto 1![]() , Sri Widiyati 2, Muhammad Rois 3, Tyas Listyani 4, Manarotul
Fatati 5
, Sri Widiyati 2, Muhammad Rois 3, Tyas Listyani 4, Manarotul
Fatati 5
1 Accounting
Major, Politeknik Negeri Semarang, Indonesia
|
|
|
ABSTRACT |
|
|
The rapid
evolution of digital technology, especially in the digital economy and
payment sector, has driven the widespread adoption of digital payment
services utilizing QR Codes. The Quick Response Code Indonesian Standard
(QRIS), introduced by Bank Indonesia and the Indonesian Payment System
Association (ASPI) on August 17, 2019, serves as the national QR code
standard, facilitating QR code-based payments across Indonesia. QRIS
presently allows the acceptance of payment applications, whether from banks
or non-banks, at various establishments. This study, involving 370 students
from a population of 6,128, utilizes the Structural Equation Model (SEM) for
analysis, demonstrating a robust fit with a GFI value surpassing 0.917. The
findings reveal that TAM variables—perceived ease of use, usefulness,
enjoyment, and financial literacy—significantly influence the interest in
adopting QRIS for digital payments, supported by probability values below 1%. |
|||
|
Received 27 November 2023 Accepted 28 December 2023 Published 13 January 2024 Corresponding Author Edi Wijayanto, ediwijayanto@polines.ac.id DOI 10.29121/granthaalayah.v11.i12.2023.5436 Funding: This research
received no specific grant from any funding agency in the public, commercial,
or not-for-profit sectors. Copyright: © 2023 The
Author(s). This work is licensed under a Creative Commons
Attribution 4.0 International License. With the
license CC-BY, authors retain the copyright, allowing anyone to download,
reuse, re-print, modify, distribute, and/or copy their contribution. The work
must be properly attributed to its author.
|
|||
|
Keywords: QRIS, TAM Variables, Financial Literacy |
|||
1. INTRODUCTION
Digital growth has developed rapidly until now, including in the economic aspect. One innovation that is developing and being used is a QR code-based digital payment service, commonly known as QRIS. QRIS (Quick Response Code Indonesian Standard) is a national QR code standard to facilitate QR code payments in Indonesia. It was launched by Bank Indonesia and the Indonesian Payment System Association (ASPI) on August 17, 2019, as a national QR code standard. QRIS facilitates the use of various payment applications from organizers, both banks and non-banks, in various places such as shops, traders, stalls, parking lots, tourist tickets, and donations (merchants) with the QRIS logo. Even though the QRIS providers at merchants differ, users can choose various payment applications according to their preferences.
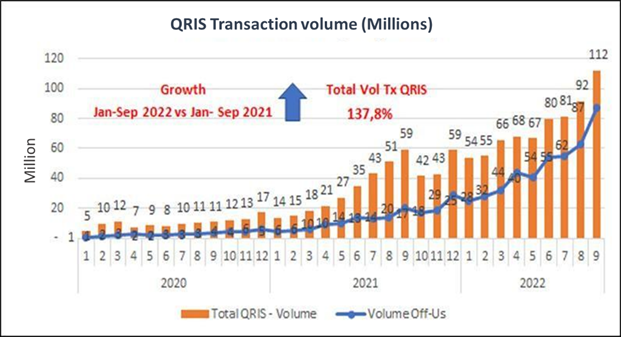
In October 2022, QRIS transaction volume reached 112 million, showing significant growth of up to 1735% compared to March 2020, which was only 5.08 million. For bulleted lists
Figure 1
|
Figure 1 Graph
of QRIS Transaction Volume Growth March 2020 – September 2022 Source Indonesian
Payment Systems Association (ASPI) by Bank Indonesia (BI) |
Even though QRIS adoption is increasing, many shops still need to understand or know about QRIS fully. QRIS is an obstacle that must be researched to maximize the implementation of QRIS utilization in the economic sector. According to research Widiyati et al. (2019) the obstacles to the sustainability of financial MSMEs are related to capital resources and also access to financial institutions and financial literacy. According to research Palupi et al. (2022), financial literacy and ease of using QRIS can influence the decision of MSME players to adopt the QRIS payment system. This research is in line with research Akbar (2022), which confirms that the low financial literacy of the Indonesian people causes these obstacles. So, financial literacy is a factor in empowering consumers to use QRIS.
Developments influence payment decisions via digital payment tools in financial technology. The growth of digital payment services can be affected by concerns about the confidentiality and security of personal data and the risk of transaction failure that could lead to fraud Adiatama & Sari (2020). Technology acceptance theory is the research framework, especially the Technology Acceptance Model (TAM). TAM emphasizes that perceptions of ease, usefulness, and comfort influence attitudes toward the use of technology. The combination of financial literacy and TAM becomes an analytical tool to explore the factors that can affect user attitudes and behavior in adopting QRIS.
This research aims to identify the influence of perceived convenience, usefulness, and comfort variables on the decision to use QRIS and evaluate the impact of financial literacy on the decision to use QRIS among Semarang State Polytechnic students. The urgency of this research lies in its contribution to understanding the factors that influence the decision to use payments via QRIS, which can help determine the level of success of QRIS as a digital payment tool. The results of this research will likely become the basis for the government and other stakeholders to design a more effective socialization and education model to encourage the transition of people's payment decisions from cash payments to QRIS digital payments. By increasing payment decisions via QRIS, it can expected that it can increase transaction security, reduce the risk of fraud, accelerate economic growth, and improve the welfare of society as a whole.
2. RESEARCH METHODS
Quantitative research methods use large amounts of
data to test hypotheses using the theoretical basis of QRIS (Quick Response Code Indonesian Standard),
TAM (Technology Acceptance Model), and financial literacy. This research was
conducted by collecting data through a questionnaire using a 5-point. Likert scale with answer options
namely 1) Strongly Disagree (STS), 2) Disagree (ST), 3) Neutral (N), 4) Agree
(SJ), 5) Strongly Agree (SS) filled in by respondents on variables including 4
(four) independent variables such as Perceived Convenience (X1), Perceived
Usefulness (X2), Perceived Comfort (X3), and Financial Literacy (X4) as well as QRIS digital payment decisions (y) as the
dependent variable.
The population in the research were Semarang state polytechnic students, using purposive sampling techniques for 370 respondents from 500 students who were given questionnaires. The statistical data processing process is carried out using SmartPLS software with SEM analysis, which involves testing validity, reliability, normality, and the influence of factors. This data analysis technique allows testing a series of relationships between independent and dependent variables simultaneously. This research also uses the AMOS data processing application for statistical data processing analysis techniques. The Structural Equation Model (SEM) is used to test the effectiveness of experimental variables and allows the testing of several models in answering the research problem formulation.
Figure 2
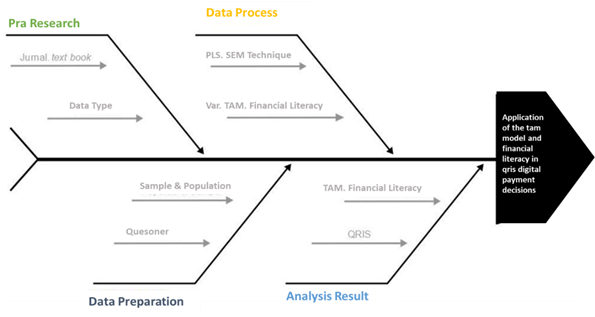
|
Figure 2 Research Fish Bone |
3. RESULTS AND DISCUSSION
Research
respondents had varying levels of QRIS knowledge, with 9% knowing it for over
three years, 49% for 1-3 years, and 42% for less than one year. As many as 43%
of respondents spent less than 100,000 in QRIS purchases, 50% spent 100,000 to
500,000, and 7% spent more than 500,000. 1.35% of respondents needed to learn
how to complete transactions with QRIS, while 98.65% were familiar with it.
Statistical
data was processed using AMOS to analyze the
Technology Acceptance Model (TAM) application and financial literacy in
Semarang State Polytechnic students' interest in using QRIS.
Table 1
|
Table 1 Validity Test |
|||||||
|
Indicator |
Results |
Information |
Indicator |
Results |
Information |
||
|
Decision |
Benefit |
0.406 |
Valid |
X32 |
Comfortable |
0.920 |
Valid |
|
Decision |
Comfortable |
0.028 |
Valid |
X31 |
Comfortable |
0.891 |
Valid |
|
Decision |
Literacy |
0.274 |
Valid |
X41 |
Literacy |
0.895 |
Valid |
|
X13 |
Easy |
0.897 |
Valid |
X42 |
Literacy |
0.882 |
Valid |
|
X12 |
Easy |
0.934 |
Valid |
X43 |
Literacy |
0.867 |
Valid |
|
X11 |
Easy |
0.888 |
Valid |
X44 |
Literacy |
0.890 |
Valid |
|
X24 |
Benefit |
0.892 |
Valid |
Y21 |
Decision |
0.782 |
Valid |
|
X23 |
Benefit |
0.846 |
Valid |
Y22 |
Decision |
0.928 |
Valid |
|
X22 |
Benefit |
0.919 |
Valid |
Y23 |
Decision |
0.789 |
Valid |
|
X21 |
Benefit |
0.918 |
Valid |
Y24 |
Decision |
0.884 |
Valid |
|
X34 |
Comfortable |
0.915 |
Valid |
X14 |
Easy |
0.913 |
Valid |
|
X33 |
Comfortable |
0.901 |
Valid |
||||
The
test results for each indicator show that the Pearson Correlation is positive,
so all indicators are declared valid.
Table 2
|
Table 2 Reliability Test |
|||
|
Variable |
Result |
Requirement |
Information |
|
X1 |
0.934 |
> 0.7 |
Reliable |
|
X2 |
0.921 |
> 0.7 |
Reliable |
|
X3 |
0.921 |
> 0.7 |
Reliable |
|
X4 |
0.899 |
> 0.7 |
Reliable |
|
Z |
0.912 |
> 0.7 |
Reliable |
|
Y |
0.913 |
> 0.7 |
Reliable |
From
the processing results, the Cronbach's Alpha value was obtained, all the values
of the variables X, Y and Z were above 0.7 so it could be
concluded that all the variables used were declared reliable.
Table 3
|
Table 3 Model Fit Test |
||||
|
Model |
RMR |
GFI |
AGFI |
PGFI |
|
Default model |
.067 |
.933 |
.901 |
.672 |
|
Saturated model |
.000 |
1.000 |
||
|
Independence model |
.586 |
.716 |
.692 |
.659 |
|
Zero model |
.602 |
.000 |
.000 |
.000 |
The
GFI value shows more than 0.933, so the data shows a better-fit value. Changes
in the independent variable can explain changes in the dependent variable as
much as 93.3%, while changes in other variables can explain 6.7%.
Table 4
|
Table 4 Normality Test (Assessment of Normality (Group number 1)) |
||||||
|
Variable |
min |
max |
skew |
c.r. |
kurtosis |
c.r.2 |
|
Y14 |
1.000 |
5.000 |
.157 |
1.231 |
-.294 |
-1.154 |
|
X14 |
1.000 |
5.000 |
.020 |
.160 |
-.268 |
-1.051 |
|
Y24 |
1.000 |
5.000 |
-.175 |
-1.374 |
-.365 |
-1.431 |
|
Y23 |
1.000 |
5.000 |
-.235 |
-1.983 |
-.375 |
-1.472 |
|
Y22 |
1.000 |
5.000 |
-.154 |
-1.208 |
-4.91 |
-1.929 |
|
Y21 |
1.000 |
5.000 |
-.149 |
-1.170 |
-.122 |
-.481 |
|
Y13 |
1.000 |
5.000 |
.075 |
0.592 |
-.607 |
-2.385 |
|
Y12 |
1.000 |
5.000 |
.105 |
.824 |
-.313 |
-1.230 |
|
Y11 |
1.000 |
5.000 |
-.150 |
-1.18 |
-.423 |
-1.660 |
|
X44 |
1.000 |
5.000 |
.299 |
2.350 |
-.330 |
-1.295 |
|
X43 |
1.000 |
5.000 |
-.045 |
-.352 |
-.540 |
-2.120 |
|
X42 |
1.000 |
5.000 |
.096 |
.751 |
-.408 |
-1.602 |
|
X41 |
1.000 |
5.000 |
-.152 |
-1.191 |
-.407 |
-1.599 |
|
X31 |
1.000 |
5.000 |
.074 |
.582 |
-.510 |
-2.002 |
|
X32 |
1.000 |
5.000 |
.099 |
.776 |
-.365 |
-1.435 |
|
X33 |
1.000 |
5.000 |
.117 |
.917 |
-.379 |
-1.488 |
|
X34 |
1.000 |
5.000 |
.069 |
.544 |
-.417 |
-1.638 |
|
X21 |
1.000 |
5.000 |
.014 |
.107 |
-.289 |
-1.136 |
|
X22 |
1.000 |
5.000 |
.050 |
.392 |
-.575 |
-2.259 |
|
X23 |
1.000 |
5.000 |
.064 |
.503 |
-.160 |
-.629 |
|
X24 |
1.000 |
5.000 |
.104 |
.820 |
-.146 |
-.572 |
|
X11 |
1.000 |
5.000 |
-.002 |
-.015 |
-.439 |
-1.724 |
|
X12 |
1.000 |
5.000 |
.168 |
1.318 |
-.552 |
-2.167 |
|
X13 |
1.000 |
5.000 |
.212 |
1.663 |
-.302 |
-1.184 |
|
Multivariate |
8.961 |
2.440 |
||||
The
table above shows that none of the critical ratio (C.R.) values
are outside -2,580 to 2,580, so it shows that the data is
univariately normally distributed. Meanwhile, the Multivariate Value is 2440,
so it can also be concluded that the Data is Normally Distributed Multivariate.
Table 5
|
Table 5 Multicollinearity Test |
|||
|
Collinearity
Statistics |
|||
|
Model |
Tolerance |
VIF |
|
|
1 |
(Constant) |
||
|
X11 |
0.455 |
2.765 |
|
|
X21 |
0.564 |
3.122 |
|
|
X31 |
0.446 |
2.765 |
|
|
X41 |
0.455 |
2.654 |
|
All
Tolerance values for each variable are more significant than
0.10, and all VIF values for each variable are smaller than
10.00. So, based on the decision taken in the multicollinearity test, it can be
concluded that there are no symptoms of multicollinearity in the regression
model.
Table 6
|
Table 6 Heteroscedasticity Test |
||||||
|
Unstandardized Coefficients |
Standardized Coefficients |
|||||
|
Model |
B |
Std. Error |
Beta |
T |
Sig. |
|
|
1 |
(Constant) |
0.55 |
0.224 |
2.45 |
0.016 |
1 |
|
|
X13 |
-0.003 |
0.035 |
-0.071 |
0.943 |
|
|
|
X24 |
-0.019 |
0.039 |
-0.499 |
0.619 |
|
|
|
X33 |
0.016 |
0.039 |
0.404 |
0.687 |
|
|
|
X43 |
0.018 |
0.04 |
0.454 |
0.765 |
|
The
significance value of the four variables is less than 0.05, so by the basis for
decision-making in the Glejser test, it can be
concluded that symptoms of heteroscedasticity occur in the regression model.
Table 7
|
Table 7 Autocorrelation Test |
|||||
|
Model |
R |
R Square |
Adjusted R Square |
Std. Error of the Estimate |
Durbin-Watson |
|
1 |
.894a |
.800 |
.798 |
1.45875 |
1.933 |
The
Durbin Watson distribution value (1.933) is greater than the upper limit table
value (du), namely 1.765, and smaller than 4-du (4-2.235 = 1.765) or more
briefly du < d < 4-du, so it can be concluded that Ho is accepted and
rejecting H1, which means there are no problems or symptoms of autocorrelation.
Table 8
|
Table 8 Structural Equation Modelling (SEM) AMOS Test |
|||||
|
Estimate |
S.E. |
C.R. |
P |
Label |
|
|
Decision Benefit |
.293 |
.204 |
1.437 |
.*** |
par_24 |
|
Decision Comfortable |
.005 |
.153 |
.030 |
.*** |
par_25 |
|
Decision Literacy |
.180 |
.143 |
1.262 |
.*** |
par_26 |
|
Decision Easy |
.160 |
.131 |
1.223 |
.*** |
par_28 |
Based
on the processing results with the AMOS program, the regression weight results
obtained, as in the table, show that all variables have a significant effect.
The
research results show a significant influence of three independent variables on
QRIS digital payment decisions. Perceived convenience has a positive
coefficient of 0.160 with a significance of 0.000, perceived usefulness has a
positive coefficient of 0.293 with a significance of 0.000, and perceived
comfort has a positive coefficient of 0.005 with a significance of 0.000. Apart
from that, financial literacy also plays a significant role, with a positive
coefficient of 0.180 and a significance of 0.000. By rejecting the null
hypothesis (H0) and accepting the alternative hypothesis (H1) for these three
variables, it can be concluded that perceived convenience, usefulness, and
financial literacy significantly influence QRIS digital payment decisions.
The
results of this research are in line with Iskandar et al. (2022), Syafitri (2020), Davis (1985), Handayani & Abdillah (2019), Santoso (2010), Latifiana (2017), Luckandi (2019), Mulasiwi & Julialevi
(2020), Ong & Nuryasman
(2022), Saleh (2020), and Sihaloho et al. (2020) but
contrary to research Handayani & Abdillah (2019), and Tresnawati (2019)
4. CONCLUSION
This research shows that perceived ease of use, usefulness, enjoyment, and financial literacy influence QRIS digital payment decisions. It would be best to conduct further research on the MSME customer community.
CONFLICT OF INTERESTS
None.
ACKNOWLEDGMENTS
None.
REFERENCES
Adiatama, M. H., & Sari, D. (2020). Persepsi Milenial Terhadap Layanan Mobile Payment Di Indonesia Dengan Menggunakan Pendekatan Technology Acceptance Model (TAM). EProceedings of Management, 7(2).
Akbar, A. (2022). Pengaruh Literasi Keuangan Dan Kemudahan Penggunaan Terhadap Keputusan Menggunakan Qris Pada Umkm Selama Masa Pandemi Covid-19 Dalam Perspektif Ekonomi Islam (Studi Pada UMKM di Kota Bandar Lampung). UIN Raden Intan Lampung.
Davis, F. D. (1985). A Technology Acceptance Model for Empirically Testing New End-User Information Systems: Theory and Results. Massachusetts Institute of Technology.
Handayani, A. T., & Abdillah, L. A. (2019). Analisis Penerimaan Pengguna dalam Memanfaatkan Media Sosial Terhadap Usaha Kecil Menengah Menggunakan Metode Technology Acceptance Model (TAM). Bina Darma Conference on Computer Science (BDCCS), 1(6), 2214-2221.
Iskandar, J., Prasetya, A., Sari, Y. K., & Cahyono, T. A. (2022). Analisis Penerimaan Sistem Informasi Akademik Universitas Bhinneka Pgri Menggunakan Integrasi Model Tpb Dan Tam. JIPI (Jurnal Ilmiah Penelitian Dan Pembelajaran Informatika), 7(1), 254-263. https://doi.org/10.29100/jipi.v7i1.2739
Latifiana, D. (2017). Studi Literasi Keuangan Pengelola Usaha Kecil Menengah (UKM). Prosiding Seminar Pendidikan Ekonomi Dan Bisnis, 3(1).
Luckandi, D. (2019). Analisis Transaksi Pembayaran Menggunakan Fintech Pada UMKM di Indonesia: Pendekatan Adaptive Structuration Theory. JIKO (Jurnal Informatika Dan Komputer), 4(1), 1-10.
Mulasiwi, C. M., & Julialevi, K. O. (2020). Optimalisasi Financial Teknologi (Fintech) Terhadap Peningkatan Literasi Dan Inklusi Keuangan Usaha Menengah Purwokerto. Performance: Jurnal Personalia, Financial, Operasional, Marketing Dan Sistem Informasi, 27(1), 12-20. https://doi.org/10.32424/1.jp.2020.27.1.2284
Ong, V., & Nuryasman, M. N. (2022). Pengaruh Persepsi Risiko, Persepsi Kemudahan, dan Literasi Keuangan terhadap Minat Penggunaan Linkaja. Jurnal Manajerial Dan Kewirausahaan, 4(2), 516-524. https://doi.org/10.24912/jmk.v4i2.18259
Palupi, A. A., Hartati, T., & Sofa, N. (2022). Pengaruh Literasi Keuangan Dan Kemudahan Penggunaan Sistem Qris Terhadap Keputusan Bertransaksi Menggunakan Qris Pada UMKM. Seminar Nasional Riset Terapan Administrasi Bisnis Dan MICE, 10(1), 67-75.
Rasyid, R. A., Sunarya, E., & Ramdan, A. M. (2020). Analisis Minat Menggunakan Mobile Payment Dengan Pendekatan Technology Accpetance Model Pada Pengguna Link Aja Sukabumi. Hirarki: Jurnal Ilmiah Manajemen Dan Bisnis, 2(2), 116-125. https://doi.org/10.30606/hirarki.v2i2.387
Saleh, M. (2020). Pengaruh Literasi Keuangan dan Kualitas Pembelajaran Keuangan Terhadap Penggunaan Fintech Mahasiswa Manajemen Dan Akuntansi Universitas Fajar. Manor: Jurnal Manajemen Dan Organisasi Review, 2(2), 94-105. https://doi.org/10.47354/mjo.v2i2.243
Santoso, B. (2010). Pengaruh Perceived Usefulness, Perceived Ease of Use, Dan Perceived Enjoyment Terhadap Penerimaan Teknologi Informasi (studi empiris di Kabupaten Sragen). UNS (Sebelas Maret University).
Sihaloho, J. E., Ramadani, A., & Rahmayanti, S. (2020). Implementasi Sistem Pembayaran Quick Response Indonesia Standard Bagi Perkembangan UMKM di Medan. Jurnal Manajemen Bisnis, 17(2), 287-297. https://doi.org/10.38043/jmb.v17i2.2384
Sucuahi, W. T. (2013). Determinants of Financial Literacy of Micro Entrepreneurs in Davao City. International Journal of Accounting Research, 42(826), 1-8. https://doi.org/10.12816/0001127
Syafitri, S. (2020). Pengaruh Persepsi Kemudahan Penggunaan, Kepercayaan, Fitur Layanan Terhadap Minat Menggunakan Financial Technology (Fintech) Pada Aplikasi Ovo (Studi Kasus Pada Mahasiswa Feb Upgris Angkatan 2016-2019). Prosiding Konstelasi Ilmiah Mahasiswa Unissula (KIMU) Klaster Ekonomi.
Tresnawati, Y. (2019). Analisis Penerimaan Sistem Pembelajaran Berbasis Edmodo Bagi Peserta Didik dengan Menggunakan Technology Acceptance Model (TAM): Studi Kasus pada SMKN 4 Bandung. Journal of Information Technology, 1(1), 5-10. https://doi.org/10.47292/joint.v1i1.2
Widiyati, S., Wijayanto, E., & Prihatiningsih. (2019). Supporting the Sustainability of Regional Industry Core Competence in Salatiga. International Journal of Research -GRANTHAALAYAH, 7(6), 165-177. https://doi.org/10.29121/granthaalayah.v7.i6.2019.785
 This work is licensed under a: Creative Commons Attribution 4.0 International License
© Granthaalayah 2014-2024. All Rights Reserved.