SEEPAGE ANALYSIS ON THE EMBANKMENT BODY ZONAL TYPE DAM IN BAGONG EAST JAVA INDONESIA
Kuntjoro 1![]()
![]() ,
Bagas Aryananda 1,
Mohamad Khoiri 1
,
Bagas Aryananda 1,
Mohamad Khoiri 1
1 Civil
Infrastructure Engineering, Institut Teknologi Sepuluh Nopember Surabaya, Indonesia
|
|
|
ABSTRACT |
|
|
Dam
construction is one form of water resource utilization in Indonesia. In
addition to its potential functions and benefits, dams in Indonesia also pose
significant risks. Therefore, detailed planning for dam construction is
essential. The Bagong Dam has a zonal embankment type with a vertical core.
This type of dam has larger pores or voids compared to concrete/asphalt dams.
Consequently, a detailed seepage calculation is necessary to avoid adverse
events. Water seepage can be addressed by analyzing it using the Geo-Studio
software, which can identify the depression line, as well as the velocity and
discharge of seepage through the dam body. The analysis includes conditions
such as Normal Water Surface (NWS), Flood Water Surface (FWS), Rapid
Drawdown, and Dead Storage. The analysis will produce seepage patterns
(depression lines), seepage discharge, and seepage velocity. The calculated
seepage discharge in Geo-Studio is 5.82 x 10⁻³ m3/s, compared to the manually
calculated seepage discharge of 5.98 x 10⁻³ m3/s, resulting in a negligible
difference of 2.672%, with a discharge difference of 0.00016 m3/s. The
highest critical velocity occurs in rip-rap material and embankments at a
height of 4.04 x 10⁻¹ in the NWS modelling. The critical diameter limit for
the most critical (smallest) material to be carried away is found in clay
material with a critical diameter of 5.61.10-14 cm. The safety factor for
suffusion symptoms indicates the most critical value in NWS modelling, with a
value of 4.51. The seepage discharge is still within safe limits since the
calculated discharge through the dam body is 0.062 m3/s less than the
permitted discharge. |
|||
|
Received 05 November 2023 Accepted 08 December
2023 Published 31 December 2023 Corresponding Author Kuntjoro, kuntjoro_rivers@yahoo.co.id DOI 10.29121/granthaalayah.v11.i12.2023.5412 Funding: This research
received no specific grant from any funding agency in the public, commercial,
or not-for-profit sectors. Copyright: © 2023 The
Author(s). This work is licensed under a Creative Commons
Attribution 4.0 International License. With the
license CC-BY, authors retain the copyright, allowing anyone to download,
reuse, re-print, modify, distribute, and/or copy their contribution. The work
must be properly attributed to its author.
|
|||
|
Keywords: Dam Construction, Zonal Embankment,
Seepage Analysis |
|||
1. INTRODUCTION
The Bagong Dam in Trenggalek Regency, East Java, Indonesia, stands as a critical infrastructure in the utilization of water resources in the region. As a zonal embankment dam with a vertical core, the Bagong Dam plays a vital role in providing water for irrigation, energy, and clean water supply. Due to the distinctive characteristics of its zonal material, this dam requires special attention concerning the potential seepage that could lead to detrimental impacts Ahmed et al. (2015), Emeka & Chukwuemeka (2018) such as erosion and material movement El-Gawad (2020), Aga (2021).
Unlike concrete or asphalt dams, embankment dams exhibit higher porosity due to the differences in their material composition Beiranvand & Komasi (2021). Hence, a profound understanding of water seepage becomes crucial Min et al. (2018). Potential risks, such as the transport of material by seepage causing cavities in the dam body (erosion) Azdan & Samekto (2008), necessitate thorough investigation Suyono Sosrodarsono (2002).
In this context, seepage analysis becomes a crucial step to ensure the long-term safety and performance of the Bagong Dam. This research aims to provide in-depth insights into seepage patterns, seepage discharge, seepage velocity, and critical factors under various operational conditions such as Flood Water Surface (FWS), Normal Water Surface (NWS), Rapid Drawdown, and Dead Storage.
The significance of this analysis is directly tied to the safety of the residents around the dam and the sustainability of the infrastructure Alnealy & Alghazali (2015). Therefore, the careful selection of Geo-Studio (SEEP/W) Pd-T-14-2004-A. (2004), Lin Zhong (2021) software as the analytical tool is warranted. Geo-Studio excels in evaluating dam performance with a certain level of complexity, particularly in analyzing water seepage and excessive pore pressure dissipation in porous materials like soil and rock Kuntjoro et al. (2022), Shmela & Shakshem (2013).
By formulating focused research questions, including seepage patterns, seepage discharge, seepage velocity, critical grain size limits, and slope safety factors, this research is expected to make a significant contribution to the understanding and management of seepage in zonal embankment dams. The research location at the Bagong Dam in Trenggalek Regency takes centre stage, and through this study, it is anticipated that practical solutions will be found to enhance the safety and efficiency of water resource management in the region.
Figure 1

|
Figure 1 Map of Bagong Dam Location as Study Area |
2. MATERIAL AND METHOD
2.1. Embankment Material
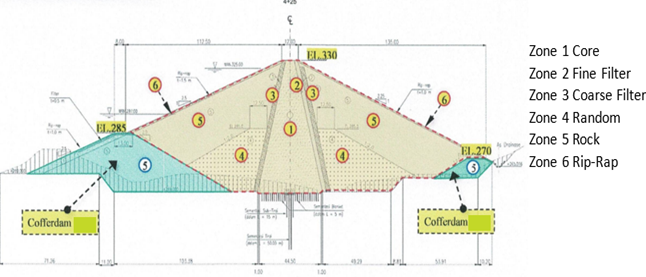
The embankment material, as indicated in Figure 2, PT. Mettana Engineering Consultant. (2018), Bangunan (2004), comprises soil as specified. The GeoStudio application program will be used for slope stability analysis. Seep/W will be employed to obtain seepage data and determine the phreatic surface, providing input for pore water pressure in Slope/W. The results of the Seep/W analysis will be displayed in the seepage analysis section Pd-T-14-2004-A. (2004). The availability of earth fill material is outlined in Table 1.
Figure 2
|
Figure 2 Cross-Sectional View of the Main Dam |
Table 1
|
Table 1 Analysis of Availability of Earth Fill Materials for the Dam Body |
|||
|
No |
Material Type |
Volume (m3) |
Quarry Location |
|
1 |
Zone I - Core (Clay) |
13,94,496 |
Flooded area and dam foundation excavation |
|
2 |
Zone II - Fine Filter |
6,60,330 |
Badak River, Sidodadi
Village, Nglegok and Garum, Blitar,
approximately 90-110 km from the site |
|
3 |
Zone III - Coarse Filter |
2,69,561 |
Crushing results from river deposits and quarry rock material, maximum
distance of 0-2 km. |
|
4 |
Zone IV - Random Stone |
9,54,262 |
Excavation from tunnel, spillway, foundations, right and left abutments,
within 0-2 km distance |
|
5 |
Zone V - Stone Fill |
60,46,648 |
Quarry 1,2,3 and expansion area on the right side of the flooded area,
within 0-2 km distance |
|
6 |
Zone VI - Rip Rap |
|
Quarry 1,2,3 and expansion area on the right side of the flooded area,
within 0-2 km distance |
2.2. Seepage in the Dam Body
Seepage, or permeability, is the property that allows liquids to flow through porous materials. Soil is considered a permeable material, allowing water to flow through its Hardiyatmo (2002). The degree of soil permeability is determined by pore size, soil type, and soil density, expressed as K (velocity unit in cm/s or m/s).
The dam body must be able to withstand the forces exerted by seepage water flowing through the dam body and foundation. To assess the resistance capability of the dam body and its foundation against these forces, the research focuses on the following:
· Formation of seepage lines within the dam body at specific elevations of the planned water surface in the reservoir.
· Infiltration water capacity flowing through the dam body.
· Possibility of suffusion phenomena (piping) caused by hydrodynamic forces in the filtration water flow.
These aspects can be determined by establishing the seepage line formation within the dam body and creating a network of filtration flow trajectories (seepage flow-net) within the dam body. The seepage calculations in this study utilize Darcy's Law, expressed in equations 1 to 3.
![]() (1)
(1)
![]() (2)
(2)
![]() (3)
(3)
Referring to the Japanese standards Hardiyatmo (2002), the allowed seepage discharge must comply with regulations including:
· The total seepage from the reservoir passing through the foundation and dam body must not be less than 1% of the average river flow entering the reservoir.
· The total measured seepage water from the reservoir passing through the foundation and dam body at the seepage collection point (located downstream of the dam) must not exceed 0.05% of the water capacity stored in the reservoir.
2.3. Seepage Line Patterns
Seepage line patterns in the watertight zone of a dam can be obtained using the Casagrande method. When the vertical permeability value (kv) differs from the horizontal permeability value (kh), deformation of the seepage lines will occur by reducing the horizontal coordinate by a factor of √(kv/kh) Suyono Sosrodarsono (2002), Azdan & Samekto (2008).
2.4. Critical Velocity
A critical upward flow velocity on the downstream slope,
with its vertical component potentially causing the displacement of dam
material particles on the surface, is referred to as the critical velocity.
This concept was theoretically developed by Justin Aga
(2021). The magnitude of the
filtration velocity is regulated in SNI 8065:2016 SNI
8062. (2015) as shown in Table 2 below. The analysis of
the critical velocity is obtained through the filtration flow network method with Equation
4.
![]() (4)
(4)
The value of i in this analysis is derived from the seepage analysis using GeoStudio in the previous sub-section. Meanwhile, the value of k is obtained from the soil test results, which determine the parameters of the dam body composition.
Table 2
|
Table 2 Standard Seepage Velocity for Embankment Dams [20] |
||
|
Material |
Standard SNI 8065:2016 |
|
|
Lowest |
Highest |
|
|
Core |
1.00. x 10-7 |
1.00. x 10-5 |
|
Fine Sand Drainage |
1.0. x 10-2 |
5.0. x 10-2 |
|
Coarse Sand Drainage |
5.0. x 10-2 |
5.0. x 10-1 |
|
Outer Stability Layer
1 |
5.0. x 10-4 |
1 |
|
Outer Stability Layer
2 |
5.0. x 10-4 |
1 |
|
Outer Stability Layer
3 |
5.0. x 10-4 |
1 |
2.5. Critical Particle Diameter
Safety against reservoir slope failure and seepage is a primary requirement for dam stability. Additionally, the particle diameter is one of the causes of seepage; therefore, the criteria for particle diameter have been established in the Construction Material Criteria for Embankment Dams Affandi (2014). The research results are presented in Table 3 below. This analysis employs equation 5, which is simplified to equation 9.
![]() (5)
(5)
 (6)
(6)
![]() (7)
(7)
![]() (8)
(8)
![]() (9)
(9)
Table 3
|
Table 3 Standard of Seepage Velocity for Embankment Dams SNI 8062. (2015) |
|
|
Material |
Standard Material Criteria (mm) |
|
Core |
0.001 |
|
Filter |
0.02 |
|
Filter |
0.02 |
|
Transition |
1 |
|
Rock Fill |
10 |
|
Rock Fill |
10 |
2.6. Safety Against Piping
If the upward seepage pressure in the soil is equal to the critical gradient, the soil will be in a state of buoyancy. This condition can also result in the transport of fine soil particles, leading to the formation of pipes in the soil, known as piping" Pengairan (1999), Hardiyatmo (2002). Piping can cause the formation of air voids within the dam, significantly reducing soil resistance, which poses a significant risk to dam stability. The following equations, 10 and 11, are used to determine the permissible Piping Safety Factor to prevent piping and boiling phenomena.
![]() (10)
(10)
![]() (11)
(11)
The value of ical in the actual implementation is obtained from the reading of the piezometer instrument. However, since this study is in the planning phase, the value of ical is derived from the most critical gradient value obtained from the Geo-Studio analysis.
3. RESULTS AND DISCUSSION
3.1. Seepage Patterns (Depression Lines)
The representation of seepage patterns, known as depression lines, will involve a comparison between two methods: manual and GeoStudio. In the manual representation, the vertical impermeable core zone will be referred to from the depression line formation as described in the book "Embankment Dam Type" Suyono Sosrodarsono (2002). This manual representation will then be compared with the depression lines Fell et al. (2005) generated using the GeoStudio SEEP/W software.
Due to the absence of references regulating the manual depiction of depression lines with more than 3 zones, the comparison in this analysis will be focused on the seepage patterns (depression lines) using 3 material zones. The final results obtained from the GeoStudio SEEP/W method with multiple zones, as outlined in the design plan, will be compared. The manual method results, as depicted in Figure 4, will be compared with the FEM SEEP/W method results, as shown in Figure 5.
Figure 3

|
Figure 3 Manual Depression Lines at Normal Water Level (NWL) Condition |
Figure 4

|
Figure 4 GeoStudio Depression Lines at Normal Water Level (NWL) Condition |
As evident from the above results, it can be observed that the seepage patterns
(depression lines) show minimal differences between the manual and GeoStudio
analyses (analysis results). Below are Figure 6, Figure 7, Figure 8 depicting depression
lines under various water level conditions using GeoStudio with the planned
design.
Figure 5

|
Figure 5 GeoStudio Depression Line in the Planned Design Under Normal Water Level Conditions |
Figure 6

|
Figure 6 GeoStudio Depression Line in the Planned Design Under Flood Water Level Conditions |
Figure 7

|
Figure 7 GeoStudio Depression Line in the Planned Design Under Dead Storage Conditions |
Figure 8

|
Figure 8 GeoStudio Depression Line in the Planned Design Under Rapid Drawdown Conditions |
3.2. Seepage Discharge
In the analysis of seepage discharge, the author will once again compare two methods: manual and GeoStudio. The seepage discharge analysis using GeoStudio yields a value of 5.82×10⁻³ m³/s. This result is obtained by multiplying the length of the dam crest, which is 625 m, by the seepage discharge obtained from the GeoStudio output graph, which is 9.31×10⁻⁶ m³/s.
Meanwhile, in the manual seepage calculation, the author refers to the reference book "Embankment Dam Type" Suyono Sosrodarsono (2002) using the Casagrande method. To estimate the magnitude of filtration capacity (seepage) flowing through the body and foundation of the dam, the author relies on the flow trajectory network and equipotential line network taken from the Geo-Studio depression lines (isolines in Geo-Studio).
The seepage discharge value on the body of the Bagong dam using manual analysis is 5.98×10⁻³ m³/s. Thus, it can be concluded that the results of the manual seepage analysis produce a discharge that is not significantly different from using the GeoStudio software. The difference in discharge between the two methods is 0.00016 m3/s with a percentage difference of 2.672%.
3.3. Critical Velocity
To prevent hydrodynamic forces from causing dangerous phenomena such as piping and boiling in the body and foundation of the dam, the flow velocity within the body and foundation of the dam at certain levels needs to be restricted. The analysis of critical velocity values is obtained using the flow network method, with a recapitulation of critical velocities for each material zone compared to the SNI 8065:2016 standard, as shown in Table 4.
Based on the analysis results in Table 4, it can be concluded that these values do not differ significantly from the applicable SNI 8062. (2015) and fall within reasonable limits for almost all materials. Therefore, the results of this analysis will be used as a reference for the critical velocity limits within the dam body to prevent erosion. However, besides the velocity factor, consideration should also be given to the size of particle diameter to prevent erosion.
Table 4
|
Table 4 Table of Critical Velocity Limits for Each Material Zone |
|||
|
Material |
Vc |
Standard SNI 8065:2016 |
|
|
|
|
Lowest |
Highest |
|
Clay |
2.78E-08 |
1.00.E-07 |
1.00.E-05 |
|
Fine Filter |
1.09E-05 |
1.0.E-02 |
5.0.E-02 |
|
Coarse Filter |
3.92E-05 |
5.0.E-02 |
5.0.E-01 |
|
Random Stone |
1.45E-04 |
5.0.E-04 |
1 |
|
Stone Fill |
4.04E-01 |
5.0.E-04 |
1 |
|
Rip-Rap |
4.04E-01 |
5.0.E-04 |
1 |
3.4. Critical
Particle Diameter
In determining the critical particle diameter limit, we employ the formula for the permissible Critical Velocity before the material is carried away by seepage. The critical particle diameter to be calculated for each modelling will utilize the highest (most critical) velocity found in each material and modelling, as derived from the equation in the previous subsection. The velocity values are obtained from the seepage analysis using GeoStudio in the prior analysis and the manual seepage velocity calculations.
By using the highest velocity (most critical), the analysis results of the critical particle diameter are compared with the Standard Criteria for Construction Material of Embankment Dams Affandi (2014), which has been summarized for each zone in Table 5.
Table 5
|
Table 5 Table of Critical Particle Diameter for Each Material Zone |
|||
|
Material |
d |
Standard Kriteria Material |
|
|
Min (mm) |
Max (mm) |
(mm) |
|
|
Clay |
1.04.E-12 |
1.69.E-11 |
0.001 |
|
Fine Filter |
3.18.E-10 |
1.17.E-08 |
0.02 |
|
Coarse Filter |
4.52.E-12 |
1.53.E-07 |
0.02 |
|
Random Stone |
5.74.E-11 |
1.95.E-06 |
1 |
|
Stone Fill |
0.0003 |
10.8 |
10 |
|
Rip-Rap |
0.0003 |
10.8 |
10 |
From the results in the Table 5, it can be concluded that the largest particle diameter is 1.69×10⁻¹¹ mm, and the most critical is 1.04×10⁻¹² mm, found in the clay material with the Dead Storage condition modelling. Subsequently, this material is compared with the Standard Criteria for Material (2014), resulting in a relatively close match in coverage.
3.5. Safety Against Piping
The analysis of seepage indicating the occurrence of piping is determined based on the safety factor against piping El-Gawad (2020). The results of the analysis are presented in Table 6.
Table 6
|
Table 6 Safety
Factor Against Piping Values |
||||
|
Modelling |
Safety Factor |
Condition |
||
|
|
⪰ |
4 |
||
|
NWL |
4.51 |
⪰ |
4 |
Safe |
|
FWL |
4.89 |
⪰ |
4 |
Safe |
|
Dead Storage |
26.28 |
⪰ |
4 |
Safe |
|
Rapid Draw Down |
17.85 |
⪰ |
4 |
Safe |
From the testing of several
models in the Table
6, it can be concluded
that the safety values of the dam against the dangers of piping and boiling are
within the safe condition.
4. CONCLUSION
Based on the seepage analysis in the previous subsections, several conclusions answering the problem formulations in the introduction chapter can be obtained:
· The seepage pattern or depression lines in various models, including Normal Water Level (NWL), Flood Water Level (FWL), Rapid Drawdown, and Dead Storage occurring in the Bagong dam, show no pressured flow net passing through the clay core zone. The flow net passing through the clay core zone has a head parallel to the downstream.
· The seepage flow rate between GeoStudio and Manual methods resulted in comparable values. Seepage analysis using GeoStudio produced a value of 5.82 x 10-03 m3/s, while the manual seepage calculation using the Cassagrande method resulted in 5.98 x 10-03 m3/s. Thus, the manual seepage analysis yielded a flow rate that is not significantly different from using GeoStudio. The difference between the results from GeoStudio and manual is 2.672%, with a flow rate difference of 0.00016 m3/s.
· The highest critical velocity occurs in rip-rap and stone embankment materials. This is because these materials are the most porous, with a critical velocity as high as 4.04x10-01 m3/s in the NWL modelling.
· From the calculation of the critical particle diameter limit, it is known that for the most critical (smallest) material to be carried away, it is in clay with a critical diameter of 5.61x10⁻¹⁴ cm.
· Based on the analysis of the permitted seepage flow rate, the value of Q permit (< 1% of the average river flow) is 0.0680 m3/s. Meanwhile, the design seepage flow rate is 0.0058 m3/s. It can be concluded that the seepage flow rate is still within the safe conditions because the calculated flow rate through the dam body is 0.062 m3/s less than the permitted flow rate.
5. APPENDICES A
Standar Nasional Indonesia (SNI) is Indonesian National Standard. SNI is a set of technical standards developed and adopted by the national standardization agency in Indonesia, known as Badan Standardisasi Nasional (BSN). These standards are designed to ensure the quality, safety, and reliability of products and services in various industries. SNI covers a wide range of sectors, including manufacturing, agriculture, health, and services. The standards are developed through a process that involves industry experts, stakeholders, and relevant authorities to establish criteria that meet the country's regulatory requirements and international best practices.
SNI 8062. (2015), titled "Procedures for the Design of Embankment Type Dams." Jakarta: National Standardization Agency (Badan Standarisasi Nasional).
SNI 8064. (2016), titled "Static Slope Stability Analysis Method for Embankment Type Dams." Jakarta: National Standardization Agency (Badan Standarisasi Nasional).
CONFLICT OF INTERESTS
None.
ACKNOWLEDGMENTS
The successful completion of this research project has been made possible through the collaborative efforts and support of various individuals and institutions. We would like to express our deepest gratitude to those who have contributed significantly to the realization of this study.
First and foremost, we extend our sincere appreciation to the Indonesian Ministry of Public Works and Housing (PUPR) for their financial support and the opportunity to conduct this research at the Bagong Dam in Trenggalek Regency. The funding provided played a crucial role in facilitating the necessary resources, data acquisition, and fieldwork required for the comprehensive analysis.
REFERENCES
Affandi, D. (2014). Kriteria Material Konstruksi Untuk Bendungan Urugan (Studi Kasus Bendungan Sindangheula). Jurnal Teknik Hidraulik, 5(2), 165-180. https://doi.org/10.32679/jth.v5i2.308
Aga, A. G. (2021). Embankment Dam Seepage and Slope Stability Analysis: The Case of Arjo-dedessa Dam, Ethiopia. Journal of Civil, Construction and Environmental Engineering, 6(4), 104-109. https://doi.org/10.11648/j.jccee.20210604.11
Ahmed, A., McLouglin, S., & Johnston, H. (2015). 3D Analysis of Seepage Under Hydraulic Structure with Intermediate Filters. Journal of Hydraulic Engineering, 14(1), 06014019-1-0014019-6. https://doi.org/10.1061/(ASCE)hy.1943-7900.0000944
Alghazali, N. O. S., & Alnealy, H. K. T. (2015). Experimental Analysis of Seepage in Soil Beneath a Model of a Gravity Dam. American Journal of Civil Engineering, 3(3), 64-69. https://doi.org/10.11648/j.ajce.20150303.12
Alnealy, H. K. T., & Alghazali, N. O. S. (2015). Analysis of Seepage Under Hydraulic Structures Using Slide Program. American Journal of Civil Engineering, 3(4), 116-124. https://doi.org/10.11648/j.ajce.20150304.14
Azdan, M. D., & Samekto, C. R. (2008). Kritisnya Kondisi Bendungan di Indonesia. In Seminar Nasional Bendungan Besar Indonesia.
Beiranvand, B., & Komasi, M. (2021). An Investigation on Dam Settlement During and End of Construction Using Instrumentation Data and Numerical Analysis. SN Applied Sciences, 3, 306. https://doi.org/10.1007/s42452-021-04306-z
El-Gawad, A. A. (2020). Water Seepage Source at the Extension of Tourah Clay Quarry, Southeastern Cairo Based on Geological and Geoelectrical Resistivity Measurements. Earth Sciences, 9(3), 108-116. https://doi.org/10.11648/j.earth.20200903.13
Emeka, A. E., & Chukwuemeka, A. J. (2018). Modified Schaffernak's Solution for Seepage Through Earth Dam. Mathematical Modelling and Applications, 3(4), 44-50. https://doi.org/10.11648/j.mma.20180304.11
Fell, R., MacGregor, P., Stapledon, D., & Bell, G. (2005). Geotechnical Engineering of Dams (Ed. 1st). eBook Published 15 June 2005, Pub. Location London, Imprint CRC Press. https://doi.org/10.1201/NOE0415364409
Hardiyatmo, H. C. (2002). Mekanika Tanah II, Gadjah Mada University Press. Yogyakarta.
Kuntjoro, Sutapa, W., Damayanti, L. E., Imaaduddiin, M. H., & Tatas, (2022). Modeling the Control of River Bend Bed Erosion by Installing Impermeable Cribs. Journal of Engineering Science and Technology, 17(5), 3489-3511.
Lin Zhong (2021). DEM Modelling of Particle Movement During Seepage Failure. Science Journal of Chemistry, 9(3), 62-67. https://doi.org/10.11648/j.sjc.20210903.11
Min, W., Heqing, Z., & Dongdong, C. (2018). Research and Application on Seepage Detection and Repair of Anti-Seepage System for Earth-Rockfill Dam with Asphalt Concrete Core. American Journal of Water Science and Engineering, 4(4), 101-106. https://doi.org/10.11648/j.ajwse.20180404.13
PT. Mettana Engineering Consultant. (2018). Laporan Akhir (Utama) Sertifikasi Desain Bendungan Bagong Kabupaten Trenggalek. Bandung: PUPR.
Pd-T-14-2004-A. (2004). Analisis Stabilitas Bendungan Tipe Urugan Akibat Gempa. Bandung: Departemen Permukiman dan Prasarana Wilayah.
Bangunan, P. K. D. (2004). Analisis Stabilitas Bendungan Tipe Urugan Akibat Beban Gempa. Jakarta: Departemen Permukiman dan Prasarana Wilayah.
Pengairan, D. J. (1999). Panduan Perencanaan Bendungan Urugan Volume 3. Jakarta: Departemen Pekerjaan Umum.
SNI 8062. (2015). Tata Cara Desain Tubuh Bendungan Tipe Urugan. Jakarta: Badan Standarisasi Nasional.
SNI 8064. (2016). Metode Analisis Stabilitas Lereng Statik Bendungan Tipe Urugan. Jakarta: Badan Standarisasi Nasional.
Shmela, S., & Shakshem, N. (2013). Seepage phenomenon for Wadi Megenin dam. International Journal of Environmental Monitoring and Analysis, 1(5), 248-257. https://doi.org/10.11648/j.ijema.20130105.20
Suyono Sosrodarsono, K. T. (2002). Bendungan Type Urugan. Jakarta: PT. Pradnya Paramita.
 This work is licensed under a: Creative Commons Attribution 4.0 International License
© Granthaalayah 2014-2023. All Rights Reserved.