MODELING AND SIMULATION OF SOLAR MODULE PHOTOVOLTAIC WAAREE WSM 330 USED BY THE CENTRAL SOLAR 7MW OF MALBAZA (NIGER)
Assarid Issaka Abdoulkarim 1![]() , Adamou Mamane 2,
Noma Talibi Soumaïla 3, Madougou Saidou
3, Boureima Seibou
4
, Adamou Mamane 2,
Noma Talibi Soumaïla 3, Madougou Saidou
3, Boureima Seibou
4
1 Kandadji Dam Agency, Niamey, Niger
2 Faculty
of Science and Technology/André Salifou University (UAS), Zinder, Niger
3 Laboratory of Energetic, Electronics, Electrotechnics, Automatics and
Industrial Computing, Abdou Moumouni University (UAM), Niamey, Niger
4 Electrical Engineering Department, Mines, Industry and Geology School
(EMIG), Niger
|
|
|
ABSTRACT |
|
|
In order to
study the behavior of the solar photovoltaic 7MW Malbaza
depending on the irradiation and temperature, modeling of the various
components of the system is essential. It is in this context that we have
done modeling of a PV module comprising the solar field of the said plant. In
this article, we initially presented the basic mathematical model of the
photovoltaic cell, reported the equations models with two diodes and a diode,
and later considered the case of the model with a diode to perform modeling
PV of the central module. Secondly, we implemented the model developed in
MATLAB Simulink to study the current-voltage characteristics for different
irradiations considering the constant temperature and then for different
temperature keeping constant light. The results are similar to the
current-voltage characteristics provided by the manufacturer. This allowed us
to conclude that the model developed is reliable. Finally, we will study the
influence of radiation and temperature on the production of the module. |
|||
|
Received 17 November 2023 Accepted 18 December
2023 Published 02 January 2024 Corresponding Author Assarid Issaka Abdoulkarim, assarid_emig@ yahoo.fr DOI 10.29121/granthaalayah.v11.i12.2023.5379 Funding: This research
received no specific grant from any funding agency in the public, commercial,
or not-for-profit sectors. Copyright: © 2023 The
Author(s). This work is licensed under a Creative Commons
Attribution 4.0 International License. With the
license CC-BY, authors retain the copyright, allowing anyone to download,
reuse, re-print, modify, distribute, and/or copy their contribution. The work
must be properly attributed to its author.
|
|||
|
Keywords: Electricity Spot Market, Energy,
Photovoltaic, PV 7 MW, Modeling, Simulation, Matlab,
Malbaza |
|||
1. INTRODUCTION
In a context of energy shortage, Nigerien authorities have focused on improving the production and distribution of electric energy. The use of renewable energy is a viable alternative to meet the energy needs of the population. It is in this context that the construction project of a 7 MW solar photovoltaic power plant connected to the grid in Malbaza (Tahoua Region in Niger). The plant consists of a twenty two thousand one hundred seventy-three (21 273) type modules Waaree WSM 330. In order to perform an optimization of production, we will establish a modeling of this plant to study the influence of parameters weather on production. The model will be simulated on Matlab Simulink. We will initially make a literature review on models of PV cell, in a second time exposing the materials and methods used to develop the solar module and then present the results of the simulation on Matlab.
2. Mathematical model of the photovoltaic cell
A photovoltaic cell is described by its current-voltage characteristics (I = f (V)). This modeling is typically used to approximate the output of the cell (voltage, current) as a function of two inputs which are the temperature and the illumination received. Many mathematical models have been developed to represent the behavior of the photovoltaic cells; these models are generally nonlinear resulting from that of the semiconductor junctions which form the basis of their achievements. They derive said reference model or model n diodes Ayachi & Hamdoud (2012).
2.1. The Reference Model
The principle of the photovoltaic effect is identical to the operating principle of a diode, and is illuminated when the PN junction is observed the occurrence of a reverse current I at a forward voltage V. A photovoltaic cell in darkness behaves like a conventional diode and it obeys the law Shockley is as follows Ayachi & Hamdoud (2012).
 (1)
(1)
With
q: charge of the electron
K: Boltzmann constant
T: Temperature
N: The ideality factor (N = 2 for a silicon diode).
In the presence of illumination, this characteristic is modified so as to provide a maximum current which is equal to the short-circuit current (Isc) and maximum voltage which is equal to the open circuit voltage (Voc). The nonlinear part involves several phenomena that will divert part of the current picture generated. These phenomena may be represented by one or more diodes in parallel and optionally a resistor. This allows to achieve a reference model for the photovoltaic cell is:
Figure 1
|
Figure 1 Basic Model of the Photovoltaic Cell Petrone et al. (2017), Wasilla (n.d.) |
The first diode corresponds to a recombination "band to band"(Shockley model). It reflects the properties of the semiconductor of the cell and is characterized by a short circuit in forward bias. In the case of a small injection (cell concentrations without light), this recombination is limited by the minority carriers and the ideality factor of the diode is N1 = 1. In the case of a large injection (cells with high light concentration), this recombination is limited by the two types of carriers and N1 = 2 Petrone et al. (2017), Wasilla (n.d.).
The second diode corresponds to a recombination of two carriers in the depletion region due to the presence of defects (creating intermediate energy levels). Elleis characterized by an open circuit in forward bias. The diode N2 = 2 ideality factor if the faults are evenly distributed and matches an energy level located in the middle of the band gap (model-Noyce-Sah Shockley). If we deviate from these assumptions, we 1≤N2≤4.
In the case of large injection (cells with high light concentration), there also appears the Auger recombination: a majority carrier is combined with a minority by transferring the energy released at another majority carrier. This phenomenon gives rise to a third diode ideality N3 = 2 / 3.etc.
But generally the most used models are the two diodes and the model for a diode.
2.2. The two diodes model
Indeed, the two diodes model takes into account the power transmission mechanism of the charges within the cell Petrone et al. (2017).
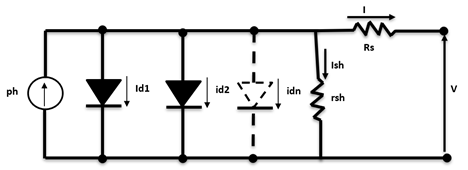
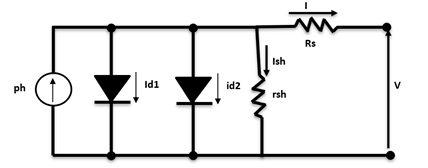
The cell a PN junction photovoltaic subjected to illumination, connected to a load can be schematized by a current generator Iph (the intensity of which depends on the solar irradiance) in parallel with two diodes and a resistance Rsh parallel delivering a current through a series resistance Rs as shown in Figure 2.
Figure 2
|
Figure 2 Model Two Diodes of the Photovoltaic Cell Petrone et al. (2017). |
In this model, the two diodes representing polarization phenomena of the PN junction. The diode d1 represents a short-circuit forward biased and diode D2 is open circuit in reverse bias).
Resistance Rs characterizes the resistivity of the material, that the electrodes and the semiconductor / metal contact. It represents the resistive losses and should ideally be as low as possible to limit its influence on the course of the cell. This can be achieved by optimizing the semiconductor / metal contact, and reducing the resistivity of the material used.
Resistance rsh: parallel resistance, called 'Shunt', comes from the recombination losses due mainly to the thickness, surface effects, as well as non-ideality of the junction. She translated in turn, the presence of a leakage current between the upper grid and the back contact. This value will be as high as possible Petrone et al. (2017), Wasilla (n.d.).
By applying Kirchhoff's laws, the charging current is obtained (I) by Ayachi & Hamdoud (2012), Nassim & Ouazar (2015), Belkhier & Ait (2017), Bilal (2012), Back & Hoffmeister (1991), Olivier Gergaud (2002), Houda & Badache (2008):
![]() (2)
(2)
the current Id1and id2two diodes are given by equations (3) and (4) respectively Ayachi & Hamdoud (2012), Nassim & Ouazar (2015), Belkhier & Ait (2017), Bilal (2012), Back & Hoffmeister (1991), Olivier Gergaud (2002), Houda & Badache (2008):
![]() (3)
(3)
 (4)
(4)
With
· n1 and n2 the respective ideality factors of diodes D1 and D2.
· V: the voltage across the PV cell.
· I_s1 etI_s2: The respective reverse saturation currents of the diodes D1 and D2.
· Vt = thermal voltage. It is given by:
![]() (5)
(5)
Or:
· K = 1.38 × 10⁻²³ J / K is the Boltzmann constant;
· q = 1.602 × 10⁻¹⁹ C the elementary charge of an electron;
· T: the nominal temperature of the cell.
The current flowing in the shunt resistor and defined by:
![]() (6)
(6)
By replacing the current Id1, Id2 and Ish by these expressions in equation (1), the characteristic I(V) And is described by Nassim & Ouazar (2015), Belkhier & Ait (2017), Bilal (2012), Back & Hoffmeister (1991), Olivier Gergaud (2002), Houda & Badache (2008), Khatib & Wilfried (2016), Petrone et al. (2017), Piazza & Vitale (2013):
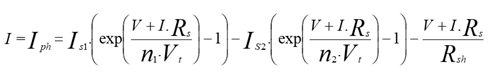 (7)
(7)
2.3. Model with a diode
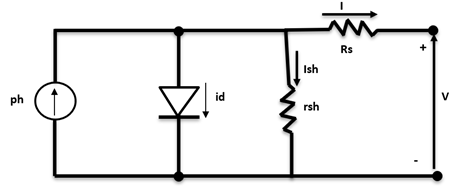
The model with a diode is obtained by neglecting the recombination of carriers in the depletion zone (IS2 = 0) Petrone et al. (2017). This leads to a "standard" model to a diode. This model, also called four-parameter model was proposed by Townsend and Beckmann. It will therefore have a dependent current source of illumination and a diode in parallel and a series resistance Rs and parallel (shunt) Rsh to consider dissipative phenomena at the cellular level.
Figure 3
|
Figure 3 Model for a Cell Diode PV Petrone et al. (2017). |
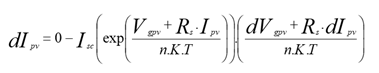
By applying Kirchhoff's laws determines the current I supplied by the cell by:
![]() (8)
(8)
With:
· Iph: The picture-current varying as a function of irradiating, it is determined with respect to data values at standard conditions Khatib & Wilfried (2016), Petrone et al. (2017), Piazza & Vitale (2013), Wasilla (n.d.), Louzazni & Aroudam (2014), Bensaci (2012), Abdelaziz & El Ghzizal (2015), Tati & Ben Lamoudi (2018), Belkhier & Ait (n.d.), Eddine & Slimane (2015), Chohraoui & Ratiba (2016):
 (9)
(9)
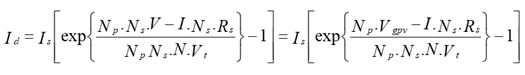
· Id: current through the diode gives theShockley law Khatib & Wilfried (2016), Petrone et al. (2017), Piazza & Vitale (2013), Wasilla (n.d.), Louzazni & Aroudam (2014), Bensaci (2012), Abdelaziz & El Ghzizal (2015), Tati & Ben Lamoudi (2018), Belkhier & Ait (n.d.), Eddine & Slimane (2015), Chohraoui & Ratiba (2016).
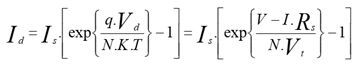 (10)
(10)
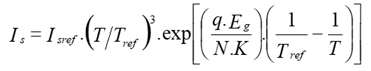
And Is the saturation current varies with temperature and is given by Khatib & Wilfried (2016), Petrone et al. (2017), Piazza & Vitale (2013), Wasilla (n.d.), Louzazni & Aroudam (2014), Bensaci (2012), Abdelaziz & El Ghzizal (2015), Tati & Ben Lamoudi (2018), Belkhier & Ait (n.d.), Eddine & Slimane (2015), Chohraoui & Ratiba (2016).
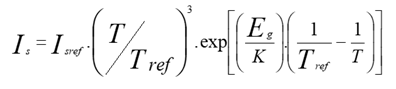 (11)
(11)
Where the saturation current at standard conditions (Is-ref) is given by Khatib & Wilfried (2016), Petrone et al. (2017), Piazza & Vitale (2013), Wasilla (n.d.), Louzazni & Aroudam (2014), Bensaci (2012), Abdelaziz & El Ghzizal (2015), Tati & Ben Lamoudi (2018), Belkhier & Ait (n.d.), Eddine & Slimane (2015), Chohraoui & Ratiba (2016)
 (12)
(12)
· Ish: The current through the parallel resistance given by:
 (13)
(13)
Or:
· G and: Irradiance actual and reference [W / m2].G_ref
· T and Tref: Actual temperature and reference [K].
· Isc: short-circuit current
· a: coefficient of photocurrent temperature (or short circuit current), it is often given by the manufacturer, it is generally positive but very weak.
· K = 1.38 × 10⁻²³ J / K is the Boltzmann constant;
· q = 1.602 × 10⁻¹⁹ C the elementary charge of an electron;
· T: the nominal temperature of the cell in Kelvin.
· N: the ideality factor
· V: the voltage at the cell terminals
· Vocref: the open circuit voltage at the reference temperature.
· Rs: series resistance
· Vt = thermal voltage given by equation (4).
· Eg: Energy "gap" of the cell. (Crystalline silicon Eg = 1.12 eV, amorphous Si Eg = 1.7 eV, copper indium diselenide Eg = 1.03 eV, cadmium telluride Eg = 1.5 eV).
· Tref: Actual temperature and reference [K].
By replacing the current Iph, Id and IRP by their expressions in equation (8), the characteristic I (V) is described as follows by:
![]()
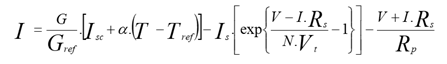 (14)
(14)
Several comparative studies have shown that the model gives a diode peak power values that the two diodes model. So, for the rest of our work, we will consider the model to a diode of the PV cell.
3. Materials and methods
3.1. materials
As material we used the software Matlab Simulink and characteristics of modules provided by the manufacturers.
Indeed, 7 MWc solar photovoltaic Malbaza consists of solar modules Waaree type WSM 330 whose characteristics are the following (standard conditions):
Table 1
|
Table 1 Characteristics of Waree Module WSM 330. |
|
|
Nominal Maximum Power (Pm) in watts |
330 |
|
Tolerance for power |
0 / + 5W |
|
Open circuit voltage (Voc)
in Volts |
45.60 |
|
short-circuit current (Iso) in Ampere |
9.65 |
|
Maximum operating voltage in volts |
36 |
|
Overcurrent operation (Imp) in Ampere |
9.17 |
|
Maximum system voltage Volts |
1000 |
|
Module Efficiency (%) |
17.01 |
|
Number of cells per module (serial) |
72 |
|
Temperature coefficient α for
the current (a) in% / ° C |
0.0118 |
|
Temperature coefficient β for
the voltage (b) in% / ° C |
-0.2627 |
|
Temperature Coefficient for the γ power
in% / ° C |
-0.3677 |
|
Number of Parallel Module |
1 |
3.2. Methods
We used the model to a diode of the photovoltaic cell to develop a mathematical model of the solar module WSM 330 Malbaza. This model is then implanted on Matlab simulation using the features the manufacturer.
3.2.1. Mathematical Model of a solar module solar power Malbaza
Because of its small thickness, a photovoltaic cell produces a very low electrical power of the order of 1 to 3W. Thus, to increase the power, are assembled these cells either in series or in parallel to form a photovoltaic module and achieve the desired power. A series combination of cells used to add tension, while the interconnection of cells in parallel makes it possible to add the output current of the generator.
The wiring diagram of the solar module may be represented by the following figure: Louzazni et al. (2014)
Figure 4
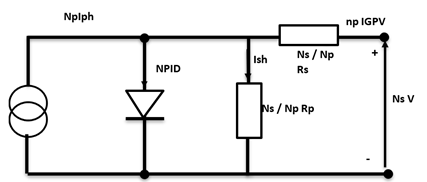
|
Figure 4 Equivalent Diagram of the Mathematical Model of the PV Module Louzazni et al. (2014). |
The current supplied by the PV module is given by Guingane et al. (2016), Louzazni et al. (2014):
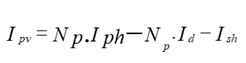 (15)
(15)
with:
· Iph: The photocurrent varies with the radiant and given by equation (9):
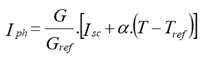 (16)
(16)
· Id: current through the diode gives the Law Shockley Guingane et al. (2016), Louzazni et al. (2014):
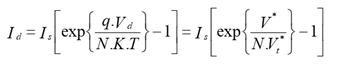 (17)
(17)
 (18)
(18)
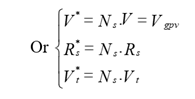
From where:
 (19)
(19)
And Is the saturation current given by equation (11):
· Ish: The current through the parallel resistance given by:
 (20)
(20)
Id and replacing Ish by their values in Equation (15) was obtained in the current of the solar module by:
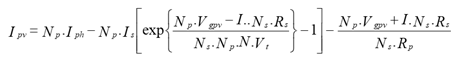 (21)
(21)
3.3. Implementation of Matlab Simulink model
3.3.1. Implantation of the current equation provided by the photovoltaic module
The photovoltaic current implementation scheme given by equation (15) on Maltab Simulink is represented by the following figure:
Figure 5

|
Figure 5 Photovoltaic Power Block Diagram Simulink |
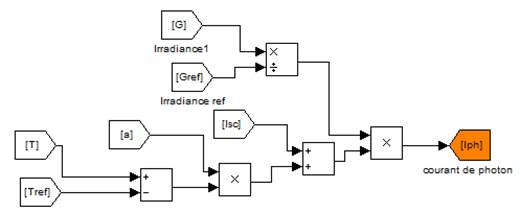
3.3.2. Implementation of the photon current equation ph
The layout diagram on Maltab Simulink, the photon current given by Equation (9) is represented by the following figure:
Figure 6
|
Figure 6 Photon Stream Block Diagram Simulink |
3.3.3. current location of the diode
The layout diagram on Maltab Simulink, the diode current given by Equation (19) is represented by the following figure:
Figure 7
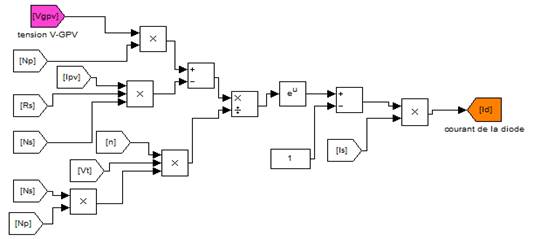
|
Figure 7 Photovoltaic Power Block Diagram Simulink |
3.3.4. Implantation of the thermal voltage Vt
The layout diagram on Maltab Simulink, thermal voltage given by equation (5) is represented by the following figure:
Figure 8

|
Figure 8 Block Diagram of the Thermal Voltage on Simulink |
3.3.5. Is implantation of the saturation current
The layout diagram on Maltab Simulink, the saturation current given by the equation (11) is represented by the following figure:
Figure 9
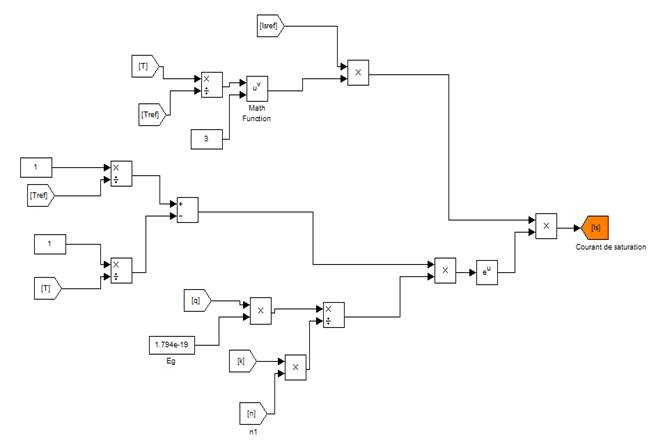
|
Figure 9 Photovoltaic Power Block Diagram Simulink |
3.3.6. Implantation of the saturation current at the reference temperature Is-ref
The layout diagram on Maltab Simulink, the saturation current at the reference temperature given by equation (12) is represented by the following figure:
Figure 10

|
Figure 10 Saturation Current of the Block Diagram at the Reference Temperature on Simulink |
3.3.7. shunt current implantation (Ish)
The layout diagram on Maltab Simulink, current shunt given by equation (20) is represented by the following figure:
Figure 11
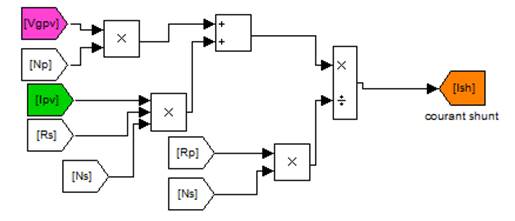
|
Figure 11 Schematic Block Current in the Shunt Resistance on Simulink |
3.3.8. Implantation series resistors (Rs) and parallel (Rp)
Series resistance can be calculated at the point 𝑉co:
 (22)
(22)
The series resistance influences largely on the slope of the characteristic curve (IV) in the vicinity of Vco. It can therefore be calculated by the following formula Khatib & Wilfried (2016), Piazza & Vitale (2013), Bensaci (2012):
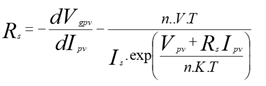 (23)
(23)
An approximate value was determined for the first time Petrone et al. (2017), Freddy (n.d.) and Petrone et al. (2017), Skoplaki et al. (2008). They applied for assessing PV cell parameters in Standard conditions. Their approach was later extended to extract the parameters of the cells for any environment.
The hypothesis is to consider Rh → ∞ to the series resistance. Thereby neglecting the current in the branch Rh simplifying the equation of the current.
A further simplification can be made for when the PV panel is in operating condition in a short circuit, the diode included in the model is reversed biased and current is considerably lower than the current photoinduced Iph. The following approximation is valid for environmental operating condition Petrone et al. (2017):
![]() (24)
(24)
The series resistance can then be calculated by Petrone et al. (2017):
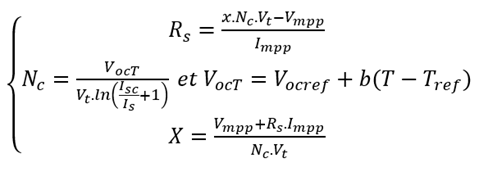 (25)
(25)
Or:
Vmpp and IMPP respectively represent the voltage and current at the point of maximum operation.
b: Temperature Coefficient voltage
implanting Rs, N_c, X and VocT in Simulink is represented by the following figures:
Figure 12
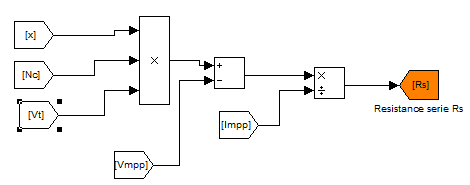
|
Figure 12 Series Resistance Rs Block Diagram Simulink |
Figure 13
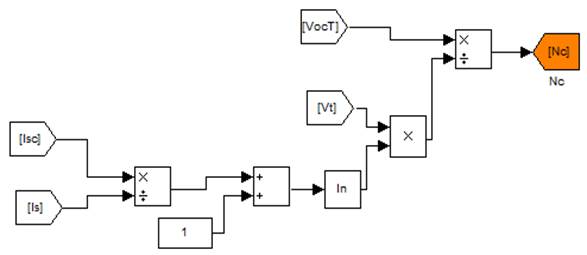
|
Figure 13 Ideality Factor of the Block Diagram of Nc Diode on Simulink |
Figure 14

|
Figure 14 Block Diagram of the Parameter X Simulink |
Figure 15

|
Figure 15 Block Diagram VocT Voltage on Simulink |
3.3.9. Implantation of the parallel resistance Rp
The parallel resistance Rp is given by Petrone et al. (2017), Tati & Ben Lamoudi (2018)
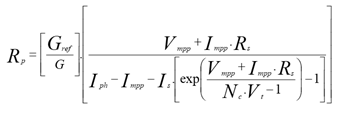 (25)
(25)
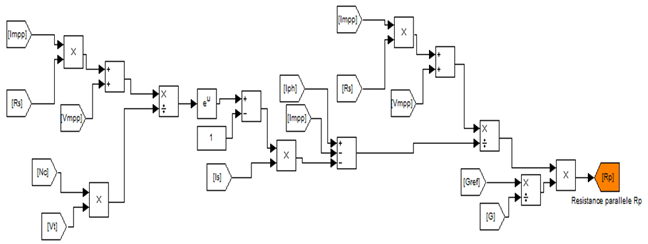
The diagram implantation in Matlab Simulink is given by the following figure:
Figure 16
|
Figure 16 The Parallel Resistor Block Diagram Simulink |
4. Results, Interpretation and comparison of the simulation
4.1. Study of the current-voltage characteristic depending on the irradiation variable and constant temperature
The influence of the illumination on the module at a constant temperature of 25 ° C is shown in Figure 16.
Figure 17

|
Figure 17 Characteristic Current Voltage at T = 25 ° c and G Module Variable Simulink |
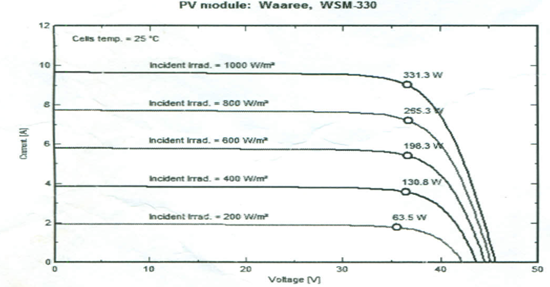
The characteristic data by the manufacturer is shown in Figure 18
Figure 18
|
Figure 18 Characteristic Current Voltage at T = 25 ° C and G Variable Given by the Manufacturer |
The simulation results show that the characteristic of the PV module is directly dependent on the illumination. Indeed, the variations of current versus voltage for different levels of illumination at a temperature kept constant 25 ° C show a significant change, whereas the voltage slightly changes with the illumination. On the other hand by making a comparison with the characteristic curve of the manufacturer, found almost the particular points (SAI, Voc, Im, Vm). Which is that the model is reliable and matches the pattern of a WSM330 module.
4.2. Study of the current-voltage characteristic temperature variable and constant irradiation (G = 1000W / m2)
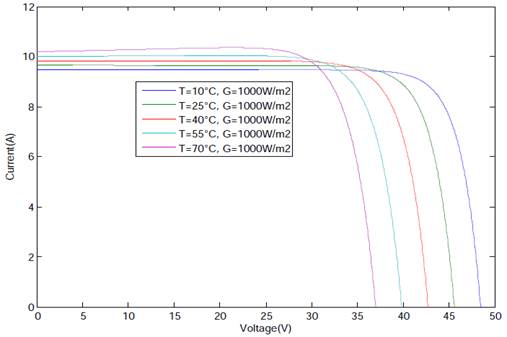
The influence of temperature on the module at a constant irradiation (G = 1000W / m2) is represented by Figure 19.
Figure 19
|
Figure 19 Characteristic Current Temperature Voltage Constant Variable and G of Simulink |
The characteristic given by the manufacturer is shown in Figure 20
Figure 20
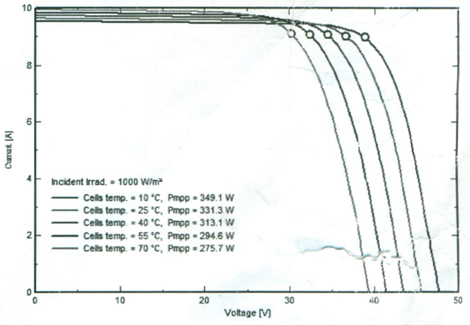
|
Figure 20 Voltage Current Curve (at Constant Temperature Variable and G) the Manufacturer. |
The simulation results show that the characteristics of the PV module is directly dependent on the temperature. Indeed, the variations of current versus voltage for different temperature levels maintained constant irradiance 1000 W / m², showed a slight change, while the voltage changes slightly with temperature. On the other hand by making a comparison with the characteristic curve of the manufacturer, found almost the particular points (SAI, Voc, Im, Vm). Which is that the model is reliable and matches the pattern of a WSM330 module.
4.3. Study of the Influence of irradiation on the photovoltaic module output
The influence of the irradiation on the output is shown in Figure 21:
Figure 21

|
Figure 21 The Influence of the Irradiation on the Production of Modules |
The simulation results show that more radiation increases more the operating point moves upward. So, the increase of irradiation greatly increases production.
4.4. The influence of temperature on PV production
The influence of the irradiation on the output is shown in Figure 22:
Figure 22

|
Figure 22 The Influence of Temperature on the Production of Modules |
The simulation results show that the higher the temperature the more the operating point moves down. So, the increase in temperature induces negative module production
5. Conclusion
We have presented in this work, a model of the PV module to explain its electrical operation depending on climatic factors. The simulation module based on mathematical equations showed that the characteristics are strongly influenced by temperature and irradiation. It is observed that the temperature at a slight effect on the current, but an increase in temperature causes an apparent decrease in the short-circuit voltage. Further comparisons made with the characteristic curves given by the manufacturer with those obtained by simulation shows the curves are similar. This proves the reliability of the model developed and can be considered the model of a PV module solar power Malbaza. We show that to increase radiation induced positively on production while the temperature rise induced negatively on production.
CONFLICT OF INTERESTS
None.
ACKNOWLEDGMENTS
None.
REFERENCES
Abdelaziz, S. M., & El Ghzizal, A. D. (2015, May). Modeling and Control of a Photovoltaic Panel in the PSIM Environment Article at International Congress of Industrial Engineering and Management Systems.
Ayachi, M., & Hamdoud, O. (2012, June). Comparative Study Between Different Photovoltaic Electric Models, End of Study Thesis. University LARBI BEN me HIDI OF Oum El Bouaghi.
Back, T., & Hoffmeister, F. (1991). "Global Optimization by Means Clustering of Evolutionary Algorithms" Divnogrorsk, FORMER USSR.
Belkhier, Y., & Ait, M. A. (2017). Modeling and Simulation on Photovoltaic System, End of Study Thesis for Obtaining the Magister, University A. MIRA-BEJAIA.
Belkhier, Y., & Ait, M. A. (n.d.). Modeling and Simulation on Photovoltaic System, Master's Thesis in Automatic, University of Bejaia.
Bensaci, W. (2012). Modeling and Simulation of a Photovoltaic System Adapted by an MPPT Control, Magstere Thesis, University kasdi merbah-Ouargla.
Bilal, K. (2012). "Smart Technology for Maximum Power Point Tracking of Photovoltaic System" Graduation Project, Lebanese University.
Chohraoui, H., & Ratiba, H. (2016, June). Modeling and Simulation of a Photovoltaic System Connects to the Network, Magister Thesis.
Eddine, T. N., & Slimane, G. (2015, September). Modeling and Simulation of Photovoltaic Systems, Master Degree.
Freddy, M. (n.d.). High School of Engineering and Management of Vaud Canton, Matlab for Engineers.
Guingane, T.T., Koalaga, Z., Simonguy, E., Zougmore, F., & Bonkoungou, D. (2016). Modeling and Simulation of a Solar Array using a Step-Up Converter (Boost) with the Software MATLAB / Simulink, Article published in International Journal of Technology, Innovation, Physics, Energy and Environment, University Clermont Auvergne.
Houda, M. N. E., & Badache, B. (2008, June). Injection Study of Photovoltaic Energy in an Electrical Network Through a 30KV Line Magisterium Brief.
Khatib, T., & Wilfried, E. (2016). Modeling of Photovoltaic Systems using Matlab.
Le-Huy, H. (1998, September). University Laval, Introduction to MATLAB and Simulink.
Louzazni, E. H., & Aroudam, Y. (2014). Modeling and Simulation of a Solar Energy Source to 3kW for Clean Energy Without Pollution, Article EDP Sciences.
Louzazni, M., & Aroudam, E. & Yatimi, H. (2014). Modeling and Simulation of a Solar Energy Source to 3kW for Clean Energy Without Pollution, Article Published by EDP in 2014. https://doi.org/10.1051/matecconf/20141103019.
Marion, B. (2002). A Method for Modeling the Current-Voltage Curve of a Pv Module for Outdoor Conditions. Progress in Photovoltaics: Research and Applications.
Nassim, S., & Ouazar, A. (2015). Identification Methods of Photovoltaic Panels, End of Study Thesis for Obtaining the Magister, University A.MIRA BEJAIA.
Olivier Gergaud (2002, December). Energy Modeling and Economic Optimization of a Wind and Photovoltaic Generation System Coupled to the Network and Associated with an Accumulator, PhD, Ecole Normale Supérieure de Cachan.
Petrone, G., Ramos-Paja, C. A., & Spagnuolo, G. (2017). Photovoltaic Sources Modeling. John Wiley & Sons.
Piazza, M. C. D., & Vitale, G. (2013). Photovoltaic Sources Modeling and Emulation Edition Stinger.
Skoplaki, E., Boudouvis, A., & Palyvos, J. (2008). A Simple Correlation for the Operating Temperature of Photovoltaic Modules of Arbitrary Mounting. Solar Energy Materials and Solar Cells, https://doi.org/10.1016/j.solmat.2008.05.016.
Tati, F., & Ben Lamoudi, O. (2018, June). Design and Realization of a Photovoltaic System Optimized by Fuzzy Logic, Magister Dissertation, University Kasdi Merbah Ouargla.
Wasilla, B. (n.d.). Modeling, Simulation and Applications of Physics, Memory for Obtaining Master in Physics, University Abu Bakr Belkaid - Tlemcen.
 This work is licensed under a: Creative Commons Attribution 4.0 International License
© Granthaalayah 2014-2024. All Rights Reserved.