
Optimal energy management in microgrids considering supply demand rate and battery discharge depth
Musa Terkes 1![]()
![]() ,
Alpaslan Demirci 2
,
Alpaslan Demirci 2![]()
![]()
1, 2 Department of Electrical Engineering,
Yildiz Technical University, İstanbul, Türkiye
|
|
|
ABSTRACT |
|
|
Integrating
solar energy with battery energy storage systems (BESS) is critical in
sustainable development plans and carbon neutrality goals. Can the energy
exchange between supply and demand offer hope via effective management of
BESS operations? How will the depth of discharge in microgrids affect
individual BESS prosumers? Motivated by such questions, this study determines
the minimum energy costs and optimal energy management considering the BESS
discharge depth for industrial prosumers with different PV power production
to electricity demand ratios. In addition, the impact of Epv/Eload and depth of discharge on individual PV-BESS
microgrid prosumers is evaluated annually from a technical, economic, and
environmental perspective. Moreover, considering the negative impact of the
self-consumption rate (SCR) on the low voltage distribution network
(overvoltage, power loss, etc.), unfavorable depth of discharge thresholds
and Epv /Eload are
determined. The optimization framework is built in Python Gurobi,
and Mixed Integer Linear Programming solves the complex problem. The results
show that a higher Epv /Eload
can reduce the cost of energy (COE) by up to 84.1% and increase the renewable
fraction (RF) and electricity sales revenues by up to 61% and up to 570.25
$/yr. It also emphasizes that for Prosumer 5, with the highest Epv /Eload (176.5%), each depth
of discharge is not feasible due to SCR. In contrast, a higher depth of
discharge can increase CO2 reduction by up to 4.45 tons/yr and thus provide additional revenues of up to 197.41
$/yr. Evaluating BESS operations in microgrid energy management will help
many stakeholders determine reliable investments and help in the planned
transition to clean energy. |
|||
|
Received 24 September 2023 Accepted 26 October 2023 Published 09 November 2023 Corresponding Author Alpaslan
Demirci, ademirci@yildiz.edu.tr DOI 10.29121/granthaalayah.v11.i10.2023.5336 Funding: This research
received no specific grant from any funding agency in the public, commercial,
or not-for-profit sectors. Copyright: © 2023 The
Author(s). This work is licensed under a Creative Commons
Attribution 4.0 International License. With the
license CC-BY, authors retain the copyright, allowing anyone to download,
reuse, re-print, modify, distribute, and/or copy their contribution. The work
must be properly attributed to its author.
|
|||
|
Keywords: Battery Energy Storage, Depth of
Discharge, Energy Management, Microgrid, Optimization |
|||
1. INTRODUCTION
A growing interest in clean energy alternatives due to global temperature concerns is helping countries meet their net-zero ambitions. Tax reductions for renewable technologies in electricity generation, batteries in energy storage solutions, and incentives for clean energy production make integration a priority International Energy Agengy. (2023) Battery energy storage systems (BESS) with superior performance compared to their peers can improve the energy balance of supply and demand to fill renewable energy generation outages and reduce over-penetration of renewable energy. Integrating renewable energy and BESS under the hybrid power system (HPS) provides many technical, economic, and environmental benefits. For instance, the levelized cost of energy (LCOE) can be reduced by up to 34.9% Zieba Falama et al. (2022), diesel consumption by up to 1.3% Jacobus et al. (2011), and CO2 by up to 53.5% Qi et al. (2022). Thus, grid dependency can be reduced by up to 3.62% Üçtuğ and Azapagic (2018), and load coverage ratio and self-consumption ratio (SCR) can be increased by up to 14.08% and 16.56% Liu et al. (2020). For HPSs with higher cost-benefit ratios, it is critical to determine energy management based on BESS operating parameters and aging characteristics and to properly characterize the relationship of battery degradation cost with different operating models for economic system operations Bordin et al. (2017). The most significant of the operating parameters is the depth of discharge (DOD). Determining the optimum performance of existing DOD-based conventional models is complicated due to linearization issues. The proposed optimization framework based on C-rate and DOD overcomes the related problem. It appropriately incorporates different control strategies of BESS into energy management Qiu et al. (2022). Managing the number of initial charges, DOD, and charge/discharge cycles to reduce BESS investment, replacement cost, and microgrid's operating cost positively impacts the microgrid lifetime. It increases daily financial savings by up to 21.6% Mostafa et al. (2020). It is also highlighted that 80% of DOD can minimize the cost of microgrid extension in long and short-term processing models and improve BESS lifetime Alsaidan et al. (2016). In microgrids, considering the cost of battery degradation with demand response programs changes the optimal DOD margin, favoring a DOD of 60% for temperatures above 10°C Zia et al. (2019). Moreover, reducing C-rate constraints reduces the system cost by lowering BESS purchase prices De La Torre et al. (2019). In addition to the capacity reduction in degradation characteristics, the inclusion of the replacement year in the microgrid sizing determines an optimal BESS capacity of 2,602 MWh and an optimal DOD of 80% over the 10-year planning horizon, reducing the total cost by up to 6.5% Amini et al. (2021). Besides the economic objective, in the transition to zero-energy communities, especially in residential buildings, choosing an optimal ESS capacity of 7.8 kWh and operating the DOD at 77% ensures optimal performance Tsioumas et al. (2021). For techno-economic operating plans based on loss of power supply probability and energy cost, choosing an optimum DOD of 70% is recommended Hlal et al. (2019). However, a 1% change in DOD could impact up to 6 million £ on grid-level BESS plans for wind-reduced energy. Accordingly, it is proposed to operate DOD at 90%, provided that BESS purchase prices are 125-150 £/kWh Rayit et al. (2021). Moreover, reducing the DOD by 60% increases the net present value by 5.83%, even though it decreases PV capacity by 31.25% and increases the LCOE by 5.51% Gomez-Gonzalez et al. (2020). A 1% change in DOD leads to a decrease in system efficiency, especially hydrogen production, but low DOD operation based on renewable energy is favourable for extending the BESS lifetime Tebibel et al. (2015). Increasing mechanical stress on the active masses and the growing size of sulfate crystals are the main reasons for shortening the BESS lifetime Alramlawi and Li (2020). Since deep discharge affects lifetimes and shallow discharge cannot meet renewable targets, building a real time battery operating cost model can reduce operating costs by 50% Sufyan et al. (2019). However, determining and implementing the optimal state of charge (SOC) for each day and the optimal DOD for each cycle can minimize microgrid operating costs and leave efficiency in the background Fallahifar and Kalantar (2023). Therefore, the trade-off between lifetime and optimal cycle depth should be addressed Dulout et al. (2017). Moreover, minimizing the charging and discharging power and energy charging cost, considering the consumption of residential loads, energy production, and time-of-use tariffs, allows the operation of the optimal DOD in the range of 10-85% and extends the economic BESS lifetime Al Essa (2020). Consequently, total discharge energy and internal resistance, Coulomb efficiency, lithium coating, and positive electrode active material conditions should be considered in addition to the optimization strategy until the end of the BESS lifetime to determine the optimum DOD Park et al. (2023).
The effects of DOD on microgrids and HPS, considering degradation characteristics and optimal DOD determination strategies, have been frequently evaluated in the literature. However, studies have yet to determine the optimal DOD of individual BESSs for feasible microgrid energy management considering the load balance of solar energy. This study proposes an optimization framework to minimize energy costs for industrial prosumers in the microgrid using individual BESSs. DOD's technical, economic, and environmental impacts on the optimization scheme are evaluated for prosumers with varying EPV/Eload ratios. Accordingly, the optimal DOD to improve the energy balance for each prosumer is determined. The study is organized as follows. Section 1 presents the literature review and originality. Section 2 explains the methodology, mathematical modeling, and assumptions. Section 3 compares and evaluates the optimization results. Finally, Section 4 presents conclusions, including recommendations for the future.
2. methodology and materıal
2.1. mıcrogrıd model and scenarıos
Five prosumers with different EPV/Eload ratios connected to the common distribution bus in the microgrid are considered in the microgrid model, as shown in Figure 1. The PV production data of the prosumers are obtained annually from renewables. ninja Renewables.ninja (2023), and the electricity purchase prices are obtained annually from the Energy Exchange Istanbul (EXIST) in Türkiye EPIAS (2023). PV capacities are assumed to be 1, 1, 8.75, 8.33, and 6.25 kW from Prosumer 1 to Prosumer 5, respectively. For PV-integrated prosumers using individual BESS, the ratio of PV energy production to load consumption is 11.6%, 23%, 50.3%, 95.2%, and 176.5%, respectively. In this way, the significance of simultaneous load consumption with PV can be evaluated technically, economically, and environmentally for each prosumer in the microgrid with the objective of minimum energy cost. On the other hand, from Prosumer 1 to Prosumer 5, the nominal BESS capacity is 6, 6, 52.5, 50, and 37.5 kWh, respectively. BESS is prohibited from purchasing electricity from the grid due to uneconomic and environmental concerns. BESS does not plan to sell electricity to the grid as the microgrid model aims to improve the supply-demand balance, fill valley periods in electricity production, and use it at load. Electricity purchases from the grid, PV power production, and BESS discharge are managed appropriately in the background based on hourly data on demand to minimize energy costs. The constraints and objective functions related to the energy balance and management in the microgrid are introduced in Section 2.4. The entire optimization process is performed annually in Python via Gurobi, while the optimization problem is solved using mixed integer linear programming (MILP). In addition to MILP, Gurobi includes various problem solvers, such as linear and quadratic programming Python (n.d.). Figure 1 shows microgrid model.
Figure 1

|
Figure 1
Microgrid Model |
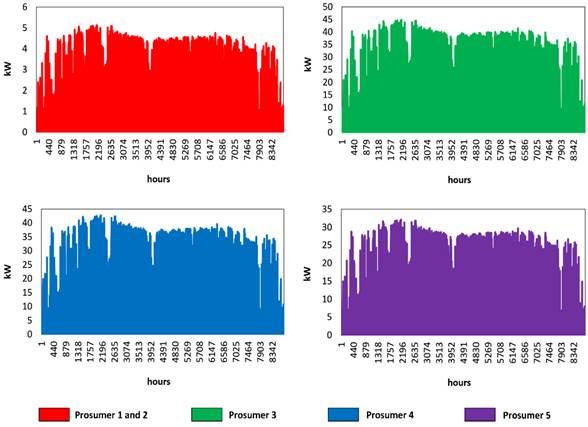
The optimization framework is conducted annually in Python Gurobi while evaluating the technical, economic, and environmental impacts of EPV/Eload and depth of discharge on microgrid prosumers. Moreover, the technical disadvantages of SCR on distribution busbars (overvoltage, power loss, etc.) are considered, and unsuitable SCR thresholds are determined. BESS' loss is considered only as a technical parameter, while SCR, self-supply ratio (SSR), the renewable fraction (RF), and energy exchange ratio (EXR) are decision criteria that concern both technical and environmental aspects. Net present cost (NPC), cost of energy (COE), for electricity costs, electricity sales revenue, and additional CO2 reduction income are economic performance measures, while CO2 is analyzed only for environmental concerns. Dynamic PV power production and TOU data were used, but capital, replacement, and O&M costs were not considered. The main scenarios of this study, where the relevant feasibility outcomes are assessed for each prosumer profile, are shown in Table 1. PV production data was taken the renewables. ninja open data web source and is shown in Figure 2.
Table 1
|
Table
1 Scenarios
of the Microgrid |
||||||
|
Scenario |
EPV/Eload (%) |
Demand |
DODmax (%) |
Minimize the cost of energy |
Feasibility Analysis |
Sub-scenario |
|
A |
11.6 |
Prosumer 1 |
20, 30, … ,80, 90 |
✓ |
✓ |
A.1, A.2, … , A.7, A.8 |
|
B |
23 |
Prosumer 2 |
B.1, B.2, … , B.7, B.8 |
|||
|
C |
50.3 |
Prosumer 3 |
C.1, C.2, … , C.7, C.8 |
|||
|
D |
95.2 |
Prosumer 4 |
D.1, D.2, … , D.7, D.8 |
|||
|
E |
176.5 |
Prosumer 5 |
E.1, E.2, … , E.7, E.8 |
|||
Figure 2
|
Figure 2 PV Energy Production Curves for Prosumers |
The study area is selected as Istanbul Fatih considering the geographical coordinates 41°51"N, 28°57'13 "E. Annual electricity purchase prices from EPIAS are presented in Figure 3 (a), while Figure 3 (b) shows the demand profiles for the prosumers on any possible day. Since the impact of maximum DOD on microgrid energy costs and feasibility is analyzed considering EPV/Eload in the minimum energy cost objective, DOD effects can be easily assessed by keeping the price of electricity sold to the grid lower. Higher electricity selling prices cause the excess PV energy produced for the minimum energy cost objective to be sold to the grid instead of charging the BESS. Accordingly, grid energy sales are minimized by assuming that the price of electricity sold to the grid will be $0.017 $/kWh. Since the energy costs related to the energy balance are examined, and PV, BESS in-vestment, replacement, and O&M costs are not included in the optimization, the NPC for energy cost is calculated.
Figure 3

|
Figure 3 (a) Electricity Purchase Prices, (b) Daily Demand Profiles for Prosumers |
2.2. ENERGY BALANCE AND CONSTRAINTS
Energy balance and constraints in microgrid planning are considered for the load, PV, BESS, and grid side. Considering the load side first, for each prosumer k, the sum of the power purchased from the grid for the load and the power transferred from PV and BESS to the load at time step t gives the demand profile for each prosumer as in Equation (1).
![]() (1)
(1)
Second, on the PV side, for each prosumer k at time step t, the power transferred from the PV to the load, the power that the PV charges the BESS, and the power sold from the PV to the grid are summed to get the total PV power production as in Equation (2).
![]() (2)
(2)
Third, on the BESS side, the charging power of the BESS needs to be calculated as in Equation (3) by summing the power that the grid and PV charge the BESS at time step t for each prosumer k. Similarly, the BESS discharge power is calculated as in Equation (4) by summing the power sold from the BESS to the grid and the power transferred to the load. However, this study prohibits BESS charging and discharging from the grid.
![]() (3)
(3)
![]() (4)
(4)
Moreover, it is necessary to set limits on the BESS charging and discharging power for each prosumer k over an operating horizon of one year. As evaluated in Equation (5), the BESS capacities selected for each prosumer limit the BESS charging and discharging power at the maximum limit. Here, binary logic (0 or 1) ensures that BESS charging and discharging operations are not performed simultaneously.
 (5)
(5)
At the beginning of the annual analysis of the optimization process, the SOC initially assumes that the BESS is full. Accordingly, for each prosumer k, the BESS initially operates at total capacity within the optimization framework. On the other hand, at each time step, the SOC balance is operated as in Equation (6), considering the BESS charging and discharging power and charging and discharging efficiency.
![]() (6)
(6)
The coefficient m was introduced to Gurobi in Python to study the DOD effects depending on the SOC range, which is also the scope of the study. Considering a factor of 0.1 in Equation (7) for the relevant parameter, multiplying the nominal BESS capacity by 0.1 allows SOCmin to be set at 10% and DODmax to be operated at 90%. Similarly, considering a multiplier of 0.9, SOCmin and DODmax are set at 90% and 10%, respectively. SOCmax is set to 100%, not exceeding the nominal BESS capacity.
 (7)
(7)
Finally, on the grid side, the power purchased from the grid is determined as in Equation (8) by summing the power purchased from the grid for the load and the BESS at time step t for each prosumer k. Similarly, in Equation (9), the power sold to the grid is calculated by summing the power sold to the grid from PV and BESS.
![]() (8)
(8)
![]() (9)
(9)
The maximum limits for the power purchased from and sold to the grid are determined as in Equation (10). This study sets very high maximum power limits (no limits) for the power purchased from the grid or sold to the grid. In contrast, the electricity purchased from the grid and sold to the grid is managed asynchronously using binary logic (0 or 1) within an appropriate plan.
 (10)
(10)
As a result, for each prosumer k at time step t, multiplying the power purchased from the grid by the realtime grid electricity purchase price determines the electricity purchase cost, and multiplying the power sold to the grid by the electricity sale price determines the electricity sale revenues. Subtracting revenues from costs, the energy cost for each prosumer k at time step t is calculated in Equation (11).
![]() (11)
(11)
2.3. OBJECTIVE AND DECISION CRITERIA
The optimization framework that evaluates the effects of DODmax on the energy cost and the feasibility results of each industrial prosumer in the microgrid determined by EPV/Eload needs to be terminated at the minimum energy cost objective. Accordingly, the energy costs obtained by optimal managing the energy balance at time step t for each prosumer k should be cumulatively summed as in Equation (12).
![]() (12)
(12)
NPC and COE are the primary considerations for economic decision criteria, while revenue from CO2 reduction is secondary. Given the average nominal discount rate of the Central Bank of Turkey last year (23.3%) and the inflation rate (14%) Head Office (2023), the real discount rate is calculated based on the famous Fisher equation as in Equation (13). Extending the energy cost results obtained for each k prosumer in the one-year optimization framework to a 20-year project horizon requires a long operational period. Accordingly, each year is considered a constant when extending the annual optimization results to the project horizon (20 years). The annual energy costs are used in the NPC calculation in Equation (14), considering the real discount rate for the project horizon. The ratio of annual energy cost to load consumption is calculated in Equation (15) to represent the COE for each prosumer k. Traditionally determined by the energy production cost ratio, this expression considers load consumption in the denominator as electricity demand is fully met Demirci et al. (2022), Demirci et al. (2023), Ozturk et al. (2021), Ozturk & Demirci (2023).
![]() (13)
(13)
![]() (14)
(14)
![]() (15)
(15)
The environmental criteria associated with the technical criteria are RF, SCR, SSR, and EXR. CO2 is the primary decision criterion for environmental concerns. For each prosumer k, the RF is calculated as in Equation (16) by subtracting the electricity demand at time step t from the power purchased from the grid for the load and proportioning it to the electricity demand. Summing the electric power transferred from PV and BESS to the load and multiplying it by the emission factor of the electricity to be purchased from the grid mix allows the CO2 reduction to be calculated as in Equation (17). Here, the Climate Transparency Report estimates the carbon emission from the grid mix for Turkey as 426.1 g/kWh. Although yet to be implemented in Türkiye, a carbon tax of 20 $/ton, considered a first step, is regarded as a decision criterion that can provide additional revenue. Accordingly, annual CO2 reduction revenues are calculated as in Equation (18) Terkes et al. (2022).
![]() (16)
(16)
![]() (17)
(17)
![]() (18)
(18)
For each prosumer k, the ratio of the electric power transferred from PV to load to the total produced PV electric power at time step t is considered as SCR. It is calculated as in Equation (19). Conversely, the fraction of the electric power transferred from PV to load in the total electricity demand is known as the SSR and is determined in Equation (20). In the Only-Grid, the electric power that each prosumer k will purchase from the grid at time step t is expected to be decreased by PV and BESS, reducing grid dependency. Accordingly, EXR is calculated as in Equation (21) by subtracting the electric power transferred from PV and BESS to the load from the total electricity demand and dividing by the total electricity demand Terkes et al. (2023), Terkes et al. (2023).
![]() (16)
(16)
![]() (17)
(17)
![]() (18)
(18)
In other words, it is a sustainable plan for the PV to charge the BESS and then discharge it to meet the electricity demand, depending on the occupancy rate of the BESS. However, due to losses, there may be a difference in the electrical power transferred from PV to BESS and from BESS to load. Therefore, possible losses from the BESS should be considered within the BESS, and the BESS percentage loss should be calculated. The BESS loss efficiency calculated in Equation (22) is evaluated also, although it is not as important as the other decision criteria.
![]() (19)
(19)
3. OPTIMIZATION RESULTS
The effect of EPV/Eload on microgrid renewable potential (RF and SCR) and environmental performance is first evaluated in Figure 4 considering DODmax for Prosumer 1, 2, 3, 4, and 5, where the ratio of PV power production to electricity demand increases.
Figure 4

|
Figure 4 The Effect of EPV/Eload on Microgrid Renewable Potential and Environmental Performance Considering DODmax |
The effects of DODmax on all optimization results obtained for each prosumer in the minimum energy cost objective are discussed in the next step. Figure 5 analyzes the impact of increasing EPV/Eload on microgrid economic performance. In BESS operations where the depth of discharge is high, the possible increase in EPV/Eload is caused by the PV power production exceeding the electricity demand, and the BESS charging is used to store the excess energy. Since the BESS discharge prevents the sale of electricity to the grid, the stored energy is used to meet the electricity demand before the grid. Accordingly, the power purchased from the grid (grid dependency) can be reduced by up to 58.54%, while carbon emissions are prevented by up to 6.35 tons/yr. Rewarding reduced CO2 with a 20 $/ton carbon tax, which still needs to be applied in Türkiye, would provide additional revenues of 127 $/yr and 2539.8 $ if the project horizon is 20 years. Even if environmental concerns are reduced, the loss of BESS is up to 922.46 kWh/yr due to frequent charging and discharging of BESS. The only negative impact of the increase in EPV/Eload on microgrid outputs is the BESS loss. The main reason for the improved environmental performance is the preference for BESS energy over grid energy, increasing RF by up to 61%.
Figure 5

|
Figure 5 The Effect Of EPV/Eload
on Microgrid SSR and Economic Performance Considering Dodmax |
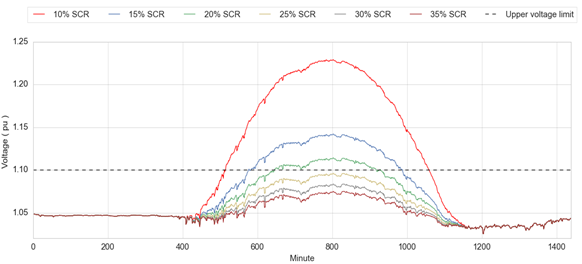
Figure 6
|
Figure 6 Voltage Fluctuations at Critical Node 886 Based on SCR |
The SCR, which is the ratio of the energy transferred from PV to load to the total PV energy production, decreases up to 50% due to the gradually decreasing demand level despite the increasing PV energy production. The SSR, which measures how efficiently PV energy is used in electricity demand, increases up to 30.4% at higher EPV/Eload. Since PV power production is more minor and electricity demand is higher than PV power production at lower EPV/Eload, it is natural that the percentage of energy transferred from PV to load to total electricity demand (i.e., the SSR) increases for higher EPV/Eload. However, higher EPV/Eload reduces the SCR below 30%. In Ahmed and Demirci (2022), which examines the technical drawbacks of increasing SCR for low-voltage distribution networks, it is emphasized that SCR below 26% will cause overvoltage problems. Moreover, it is stated that ratios above 55% will cause an increase in power losses. It is also said that up to 70% SCR can reduce the maximum voltage peaks by up to 18%. Besides, SCR-induced voltage problems (overvoltage) at the critical busbar in the IEEE 906 low voltage distribution network are shown in Figure 6, (Ahmed and Demirci (2022)).
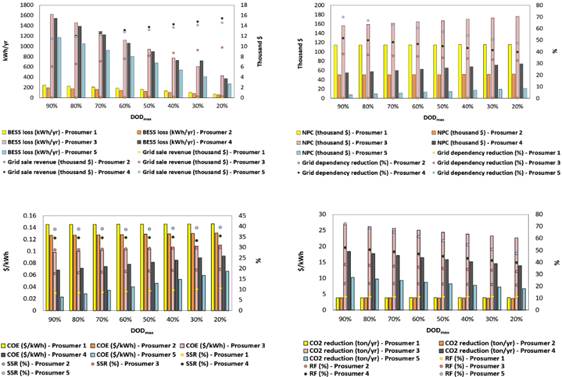
Figure 7
|
Figure 7 The Effect of DODmax
on Microgrid Renewable Potential and Economic Performance Considering EPV/Eload |
Generally stated, SCR below 30% will increase the technical disadvantages at the distribution busbar. Due to the EPV/Eload of 176.5% for Prosumer 5, SCR is below 30% regardless of DODmax and offers no viable performance for many stakeholders (utility, prosumer, government, and investor). On the other hand, COE is reduced by up to 84.1% and NPC by up to 93.5% (107 k$) due to the improvement in renewable potential and reduced grid dependency via increased BESS utilization. In addition, the higher EPV/Eload increase the sale of excess PV energy production to the grid and BESS charging, providing additional revenue of up to 570.25 $/yr. Assuming a project horizon of 20 years, increased electricity sales revenues of up to 11.41 thousand dollars significantly raise investor interest. The higher EPV/Eload for lower DODmax operation than higher DODmax increases the BESS loss by 203.7 kWh/yr while reducing the electricity purchased from the grid by up to 35.6% (6479.6 kWh/yr). In addition, CO2 is reduced by up to 2.76 tons/yr, while the additional carbon reduction revenue increases to 55.22 $/yr (1104.4 $ for the project horizon). Moreover, RF raised up to 36%, SCR decreased up to 69.2%, and electricity sales revenues increased up to 725.65 $/yr (14513 $ for the project horizon). In economic terms, COE decreases up to 54.77% and NPC up to 81.5% (94.1 k$), while SSR increases up to 29%. As a result, increasing DODmax for a higher EPV/Eload improves BESS loss by 718.76 kWh/yr, additional carbon revenues by 3.6 tons/yr (1435 $ for the project horizon), COE by 29.3%, NPC by 12%, SSR by 1.4% and RF by 25%. It also reduces grid dependency by 22.9% (8421.6 kWh/yr), SCR by 19.3%, and electricity sales revenues by 155.4 $/yr (3107.9 $ for the project horizon).
On the other hand, for prosumers with a higher EPV/Eload, the impact of increasing DODmax on each prosumer in terms of renewable potential and economic performance regarding the minimum energy cost objective in the microgrid is evaluated in Figure 7. In general, the effects of DODmax are higher for Prosumers 3 and 4 with higher nominal BESS capacity and lower for Prosumers 1 and 2 with lower capacity installations. Increased depth of discharge enables more efficient utilization of the energy stored by PV in the BESS to meet the electricity demand when needed (lack of irradiation, absence of sun). If PV power production exceeds the low electricity demand and the BESS is fully occupied, electricity sales revenues and economic prospects are estimated to increase. The increased role and participation of the BESS in the energy balance due to deep discharge will inevitably lead to increased losses and reduced electricity from the grid.
In this context, the optimization results prove that increasing the DODmax can increase the BESS loss up to 1193.83 kWh/yr (for Prosumer 3) and reduce the grid dependency up to 10439.3 kWh/yr (for Prosumer 4). However, if we consider the reduction of electricity purchased from the grid in % instead of kWh/yr, the most significant impact of DODmax is seen in Prosumer 5, with 22.64%. From an environmental perspective, CO2 is reduced by up to 4.45 tons/yr, while additional carbon revenues increase up to 1779.4 $ for Prosumer 4 over the 20-year project horizon. RF increases up to 24.7% for Prosumer 5 due to increased BESS utilization. SCR and SSR decreased up to 19.8% and 2.3% due to the lack of efficient PV utilization at lower EPV/Eload. On the other hand, from a financial perspective, increasing the DODmax can reduce the COE up to 65.1% for Prosumer 5. In contrast, the NPC can be reduced up to 19.61 thousand $ (for Prosumer 3) considering the NPC of electricity costs. However, if the reduction in NPC is analyzed in percentage terms, the most significant impact belongs to Prosumer 5, and a reduction in the COE is observed. Another critical point is that for Prosumer 1, which has a lower EPV/Eload, the dependency on the grid and, therefore, carbon emissions increase, and the RF decreases, unlike the other prosumers, due to the lack of efficient energy balance management. Finally, considering the increase/decrease trade-off for each prosumer, the impact of the rise in DODmax on the maximum feasibility results is evaluated in Figure 8. In Figure 8, the effect of increasing DODmax on the prosumer optimization output is assessed as negative with red coloring. On the contrary, positive effects are highlighted with green color.
Figure 8

|
Figure 8 Increasing and Decreasing Effect of DODmax for Prosumers on Microgrid Optimization Results. |
4. CONCLUSION
This study determines the optimal energy management for industrial prosumers using individual PV-BESS in the microgrid by minimizing the energy cost with different PV power production/electricity demand ratios. The results show that an increase in EPV/Eload would reduce CO2 and COE by up to 6.35 tons/yr and COE by up to 84.1% and increase RF, SSR, and electricity sales revenues by up to 61%, 30.4%, and 570.25 $/yr. For Prosumer 5, with an EPV/Eload of 176.5%, the SCR is below 30% regardless of the depth of discharge and is not feasible, while the SCR drops to 30.4%. In contrast, a possible increase in the depth of discharge reduces grid-purchased electricity, COE, and NPC by up to 22.65% and 65.13% while increasing RF, electricity sales, and additional CO2 reduction revenues by up to 24.7%, 197.41 $/yr and 4.45 tons/yr. Prosumers 3 and 4 with higher nominal BESS capacity are more affected by depth of discharge. In contrast, for Prosumer 1, with a lower EPV/Eload and capacity installation, increasing the depth of discharge raises carbon emissions and grid dependency. Considering the impact of depth of discharge on feasibility outcomes for stakeholders, even in a small-scale microgrid, allows for reliable investment plans. The outputs of this study can be extended in the future with a multi-objective objective for multi-bar and large-scale households, considering capital, replacement, O&M costs, and BESS degradation and focusing on optimal sizing and microgrid planning. Moreover, different technologies for energy storage can be compared, hybrid energy storage systems can be studied, and in-depth sensitivity analysis on microgrid operation and economics can be performed.
CONFLICT OF INTERESTS
None.
ACKNOWLEDGMENTS
Analyzes and comments made in this document belong to the authors. Any institution, company, etc., does not support the article.
REFERENCES
Ahmed, E. E. E., & Demirci, A. (2022). Assessment of Overvoltage and Power Losses in Low Voltage Distribution Networks with High Photovoltaics Penetration Based on Prosumers’ Self-Consumption. 4th International Congress on Human-Computer Interaction, Optimization and Robotic Applications (HORA), Proceedings, 1, 1–4. https://doi.org/10.1109/HORA55278.2022.9800001.
Al Essa, M. J. M. (2020). Power Management of Grid-Integrated
Energy Storage Batteries with Intermittent Renewables. Journal of Energy
Storage, 31(August), 101762. https://doi.org/10.1016/j.est.2020.101762.
Alramlawi, M., & Li, P. (2020). Design Optimization of a Residential PV-Battery Microgrid with a Detailed Battery Lifetime Estimation Model. IEEE Transactions on Industry Applications, 56(2), 2020–2030. https://doi.org/10.1109/TIA.2020.2965894.
Alsaidan, I., Khodaei, A., & Gao, W. (2016). Determination
of Optimal Size and Depth of Discharge for Battery Energy Storage in Standalone
Microgrids. 48th North American Power Symposium (NAPS), Proceedings, 1–6. https://doi.org/10.1109/NAPS.2016.7747845.
Amini, M., Khorsandi, A., Vahidi, B., Hosseinian, S. H., &
Malakmahmoudi, A. (2021). Optimal Sizing of Battery Energy Storage in a Microgrid
Considering Capacity Degradation and Replacement Year. Electric Power Systems
Research, 195(February), 107170. https://doi.org/10.1016/j.epsr.2021.107170.
Bordin, C., Anuta, H. O., Crossland, A., Gutierrez, I. L., Dent, C. J.,
& Vigo, D. (2017). A Linear Programming Approach for Battery
Degradation Analysis and Optimization in Offgrid Power Systems with Solar
Energy Integration. Renewable Energy, 101, 417–430. https://doi.org/10.1016/j.renene.2016.08.066.
De La Torre, S., González-González, J. M., Aguado, J. A., &
Martín, S. (2019). Optimal Battery Sizing Considering Degradation for Renewable
Energy Integration. IET Renewable Power Generation, 13(4), 572–577. https://doi.org/10.1049/iet-rpg.2018.5489.
Demirci, A., Akar, O., & Ozturk, Z. (2022). Technical-Environmental-Economic
Evaluation of Biomass-Based Hybrid Power System with Energy Storage for Rural
Electrification. Renewable Energy, 195, 1202–1217. https://doi.org/10.1016/j.renene.2022.06.097.
Demirci, A., Öztürk, Z., & Tercan, S. M. (2023).
Decision-Making Between Hybrid Renewable Energy Configurations and Grid
Extension in Rural Areas for Different Climate Zones. Energy, 262(August 2022),
125402. https://doi.org/10.1016/j.energy.2022.125402.
Climate Transparency Report (n.d.): Comparing G20 Climate Action.
Dulout, J., Jammes, B., Alonso, C., Anvari-Moghaddam, A., Luna, A., & Guerrero, J. M. (2017). Optimal Sizing of a Lithium Battery Energy Storage System for Grid-Connected Photovoltaic Systems. 2nd International Conference on Direct Current Microgrids (ICDCM), 1, 582–587. https://doi.org/10.1109/ICDCM.2017.8001106.
Exist Transparency Platform (2023). Market Clearing Price 2023.
Fallahifar, R., & Kalantar, M. (2023). Optimal Planning of
Lithium ion Battery Energy Storage for Microgrid Applications: Considering Capacity
Degradation. Journal of Energy Storage, 57(December 2022), 106103. https://doi.org/10.1016/j.est.2022.106103.
Gomez-Gonzalez, M., Hernandez, J. C., Vera, D., & Jurado, F. (2020).
Optimal Sizing and Power Schedule in PV Household-Prosumers for Improving PV Self-Consumption
and Providing Frequency Containment Reserve. Energy, 191, 116554. https://doi.org/10.1016/j.energy.2019.116554.
Head Office (2023). Inflation and Interest Report in Turkey 2023.
Hlal, M. I., Ramachandaramurthy, V. K., Sarhan, A., Pouryekta, A., &
Subramaniam, U. (2019). Optimum Battery Depth of Discharge for Off-Grid
Solar PV/Battery System. Journal of Energy Storage, 26(June), 100999. https://doi.org/10.1016/j.est.2019.100999.
International Energy Agengy. (2023). World Energy Investment 2023.
Jacobus, H., Lin, B., Jimmy, D. H., Ansumana, R., Malanoski, A. P.,
& Stenger, D. (2011). Evaluating the Impact of Adding Energy Storage
on the Performance of a Hybrid Power System. Energy Conversion and Management,
52(7), 2604–2610. https://doi.org/10.1016/j.enconman.2011.01.015.
Liu, J., Wang, M., Peng, J., Chen, X., Cao, S., & Yang, H. (2020).
Techno-Economic Design Optimization of Hybrid Renewable Energy Applications for
High-Rise Residential Buildings. Energy Conversion and Management, 213(March),
112868. https://doi.org/10.1016/j.enconman.2020.112868.
Mostafa, M. H., Aleem, S. H. E. A., Ali, S. G.,
Abdelaziz, A. Y., Ribeiro, P. F., & Ali, Z. M. (2020). Robust Energy
Management and Economic Analysis of Microgrids Considering Different Battery
Characteristics. IEEE Access, 8, 54751–54775.
https://doi.org/10.1109/ACCESS.2020.2981697.
Ozturk, Z., & Demirci, A. (2023). Optimization of
Renewable Energy Hybrid Power Systems Under Different Penetration and Grid
Tariffs. Journal of Polytechnic. https://doi.org/10.2339/politeknik.1246418.
Ozturk, Z., Demirci, A., Tosun, S., & Ozturk, A. (2021).
Technic and Economic Effects of Changes in the Location of Industrial
Facilities in Industrializing Regions on Power Systems. 13th International
Conference on Electrical and Electronics Engineering (ELECO), 11–17. https://doi.org/10.23919/ELECO54474.2021.9677827.
Park, S. J., Song, Y. W., Kang, B. S., Kim, W. J., Choi, Y. J., Kim, C.,
& Hong, Y. S. (2023). Depth of Discharge Characteristics and Control
Strategy to Optimize Electric Vehicle Battery Life. Journal of Energy Storage,
59(December 2022), 106477. https://doi.org/10.1016/j.est.2022.106477.
Python (n.d.). Gurobi Optimization Module (10.0).
Qi, X., Wang, J., Królczyk, G., Gardoni, P., & Li, Z. (2022).
Sustainability analysis of a hybrid renewable power system with battery storage
for islands application. Journal of Energy Storage, 50(March). https://doi.org/10.1016/j.est.2022.104682.
Qiu, Z., Zhang, W., Lu, S., Li, C., Wang, J., Meng, K., & Dong, Z.
(2022). Charging-rate-based Battery Energy Storage System in Wind Farm
and Battery Storage Cooperation Bidding Problem. CSEE Journal of Power and
Energy Systems, 8(3), 659–668. https://doi.org/10.17775/CSEEJPES.2021.00230.
Rayit, N. S., Chowdhury, J. I., & Balta-Ozkan, N. (2021).
Techno-Economic Optimisation of Battery Storage for Grid-Level Energy Services
Using Curtailed Energy from Wind. Journal of Energy Storage, 39(April), 102641.
https://doi.org/10.1016/j.est.2021.102641.
Renewables. ninja (n.d.). Solar PV Databese for the Relevant Location.
Sufyan, M., Rahim, N. A., Tan, C. K., Muhammad, M. A., & Raihan, S.
R. S. (2019). Optimal Sizing and Energy Scheduling of Isolated Microgrid
Considering the Battery Lifetime Degradation. PLoS ONE, 14(2), 1–28. https://doi.org/10.1371/journal.pone.0211642.
Tebibel, H., Labed, S., Khellaf, A., Ziogou, C., Papadopoulou, S.,
& Voutetakis, S. (2015). Impact of the Battery Depth of Discharge on
the Performance of Photovoltaic Hydrogen Production Unit with Energy Management
Strategy. International Conference on Renewable Energy Research and
Applications (ICRERA), 1074–1078. https://doi.org/10.1109/ICRERA.2015.7418575.
Terkes, M., Demirci, A., & Gokalp, E. (2023).
An Evaluation of Optimal Sized Second-Life Electric Vehicle Batteries Improving
Technical, Economic, and Environmental Effects of Hybrid Power Systems. Energy
Conversion and Management, 291(June), 117272. https://doi.org/10.1016/j.enconman.2023.117272.
Terkes, M., Öztürk, Z., Demirci, A., & Tercan, S. M.
(2023). Optimal Sizing and Feasibility Analysis of Second-Life Battery
Energy Storage Systems for Community Microgrids Considering Carbon Reduction.
Journal of Cleaner Production, 421(August). https://doi.org/10.1016/j.jclepro.2023.138507.
Terkes, M., Tercan, S. M., Demirci, A., & Gokalp, E.
(2022). An Evaluation of Renewable Fraction Using Energy Storage for
Electric Vehicle Charging Station. 4th International Congress on Human-Computer
Interaction, Optimization and Robotic Applications (HORA), Proceedings. https://doi.org/10.1109/HORA55278.2022.9800091.
Tsioumas, E., Jabbour, N., Koseoglou, M., Papagiannis, D., &
Mademlis, C. (2021). Enhanced Sizing Methodology for the Renewable
Energy Sources and the Battery Storage System in a Nearly Zero Energy Building.
IEEE Transactions on Power Electronics, 36(9), 10142–10156. https://doi.org/10.1109/TPEL.2021.3058395.
Üçtuğ, F. G., & Azapagic, A. (2018). Environmental Impacts
of Small-Scale Hybrid Energy Systems: Coupling Solar Photovoltaics and Lithium-Ion
Batteries. Science of the Total Environment, 643, 1579–1589. https://doi.org/10.1016/j.scitotenv.2018.06.290.
Zia, M. F., Elbouchikhi, E., & Benbouzid, M. (2019). Optimal Operational
Planning of Scalable DC Microgrid with Demand Response, Islanding, and Battery
Degradation Cost Considerations. Applied Energy, 237(December 2018), 695–707. https://doi.org/10.1016/j.apenergy.2019.01.040.
Zieba Falama, R., Dawoua Kaoutoing, M., Kwefeu Mbakop, F., Dumbrava, V.,
Makloufi, S., Djongyang, N., Salah, C. Ben, & Doka, S. Y. (2022). A Comparative
Study Based on a Techno-Environmental-Economic Analysis of Some Hybrid Grid-Connected
Systems Operating Under Electricity Blackouts: A Case Study in Cameroon. Energy
Conversion and Management, 251(October 2021), 114935. https://doi.org/10.1016/j.enconman.2021.114935.
 This work is licensed under a: Creative Commons Attribution 4.0 International License
© Granthaalayah 2014-2023. All Rights Reserved.

