INVESTMENT TECH: THE RISE OF DISCOUNT BROKERS IN INDIADr.
Rachna Jawa 1 1 Associate Professor, Shri Ram College of Commerce, University of Delhi, New Delhi, India2, 3 Student, Shri Ram College of Commerce, University of Delhi, New Delhi, India |
|
|||||||||||||||||||||||
|
|
||||||||||||||||||||||||
|
Received 19 February 2022 Accepted 27 March 2022 Published 14 April 2022 Corresponding Author Dr. Rachna Jawa, drrachnajawa@srcc.du.ac.in DOI 10.29121/granthaalayah.v10.i3.2022.4544 Funding: This research
received no specific grant from any funding agency in the public, commercial,
or not-for-profit sectors. Copyright: © 2022 The
Author(s). This is an open access article distributed under the terms of the
Creative Commons Attribution License, which permits unrestricted use, distribution,
and reproduction in any medium, provided the original author and source are
credited.
|
ABSTRACT |
|
||||||||||||||||||||||
|
This paper analyzes the emergence of discount retail
investment platforms in India which have disrupted the Fintech landscape of
the country, especially for the traditional brokerages, by presenting a technologically
cost-efficient solution to the general public. Through this expository paper,
the aim is to highlight the rising prominence of discount brokerages and
their role in revolutionizing the Indian stock market. This analytical study
endeavors to decipher the key reasons for the shift of retail investors to
discount brokers recently and uses time-series data from 2013-14 to 2020-21
to gauge the strength of the relationship between mobile and internet-based
trading and the broking leaders, like Zerodha. |
|
|||||||||||||||||||||||
|
Keywords: Online Trading, Brokerage, Fintech, Retail Investments 1. INTRODUCTION
"The individual investor should act consistently as an investor
and not as a speculator." — Ben Graham Since the establishment of the National
Stock Exchange (NSE) in 1992, there have been huge strides in technology and
NSE led the charge on the Internet-based trading system in 2000, followed by
other exchanges like the Bombay Stock Exchange (BSE) which launched
exchange-based online trading in 2001. This meant ease of use, enhanced
control, and lower transaction costs for the customers.
|
|
|||||||||||||||||||||||
The steady increase of the stock market turnover ratio[1] to 74.95 indicates the increasing level of activity in the capital market over the years.
With the inception of the new system, brokers raced to provide a trading platform that could facilitate marginal fees in transactions. Every top broker launched a mobile application for their customers, providing access to trading at their fingertips. The technology-savvy millennials were attracted to this subset of Fintech, aptly named Investment-Tech, which reached $2.8 billion in 2018, growing at a CAGR of 47% from 2008 Deloitte (2019).
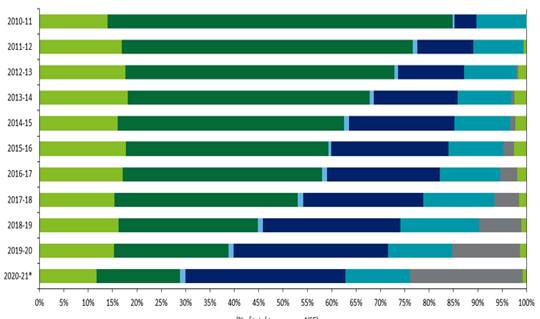
According to the SEBI, mobile as a medium of trading in the direct equity segment as a share of NSE’s total turnover) has increased from 0.01% to 23.11% in 2020-21 within ten years. Individuals participating in retail investments have several fintech platforms at their disposal to leverage worldwide financial systems and markets from home. Users can benefit from trading strategy applications that offer them an opportunity to learn the tools of the trade and capitalize on global opportunities. They are part of a wave of fintech apps that aim to make banking and other financial transactions more user-friendly.
|
|
|
Chart 1 Mode of
Trading in the Equity Delivery Segment |
1.1. INCREASING PARTICIPATION OF RETAIL INVESTORS IN THE STOCK MARKET
Retail participation in the stock market has been rising for a few years due to a variety of reasons. The declining saving avenues amidst the low-interest rate regime has led to greater interest by individuals in investing. The significant increase in global liquidity has also led to an increase in retail investments in the stock market. Moreover, the coronavirus pandemic, which has resulted in people spending more time in their homes has also been another reason for individuals’ tilt towards the stock market trading leading to increased investment in stocks and mutual funds.
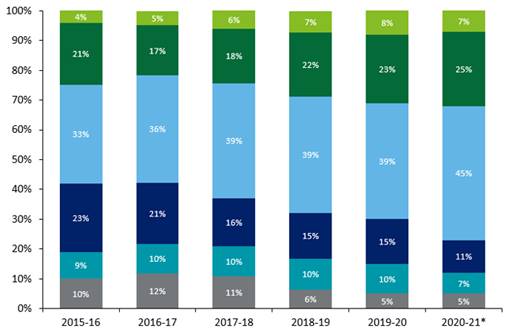
Client-wise participation in the capital market at NSE
suggests that the share of retail investment has risen to 45 % in May 2021 from
39 % in March 2020, while that of domestic institutional investors (DIIs) and
foreign institutional investors (FIIs) has declined to 7% (from 10% in March 2020)
and 10% (from 15% in March 2020), respectively during this period.
|
|
|
Chart 2 Share of Client Participation
in Capital Market at NSE (%) Source: NSE Note: PRO: Proprietary Traders, FII: Foreign Institutional Investor, DII:
Domestic Institutional Investors |
1.2. ROLE OF BROKERS IN THE STOCK MARKET
In order to invest in the stock market, one needs access to a broker/brokerage platform[2]. Stockbrokers are people/organisations who are licensed to trade in shares. They have direct access to the share market and can act as agents in share transactions. For this type of service, they charge brokerage fees. Stockbrokers also offer additional services such as portfolio management or advice. The type of broker depends on the investor’s confidence in trading shares.
Brokers are of two types: full-service brokers and discount brokers.
A full-service broker provides us with advice on which stocks to trade. They often operate as financial planners and help with other aspects of the investment portfolios. Since they offer advice, a full-service broker usually charges between 2 and 2.5 % fees, depending on the size of the transaction.
Discount brokers execute trades, but usually do not provide any advisory services. Discount brokers generally operate via the telephone, internet, or both. They give limited facilities for reduced overall charges by supplying a simplified trading platform, often technologically driven, so that their clients can easily participate in the stock market via user-friendly mobile apps and web tools provided. As a result, brokerage charges are lower than their traditional incumbents.
2. BROKERAGE FEES AND STRUCTURE
A stockbroker’s earnings depend on three
factors: trading volume, number of active clients, and brokerage fees. The
higher the volume, the higher will be the brokerage generated for the brokers.
A similar kind of relation applies to the other two factors. They are also
characterized by ease-of-use and an assortment of helpful features, such as
news feeds and charts, for investor education and research.
A brokerage fee is charged by a broker to
execute transactions or provide specialized services. Brokers charge them for
services such as purchases, sales, consultations, negotiations, and delivery.
At a full-service broker, one pays a premium for research, education, and
advice.
The charges and fees of trading platforms
vary significantly between discount brokers and full-service brokers as depicted
in the table-
|
Table 2 Charges and charges and Fees |
||
|
Charges (Equity Delivery) |
Discount Brokers (Zerodha/Groww/Upstox) |
Traditional Brokerages (ICICI Securities) |
|
Brokerage
Fees |
Zero
Brokerage |
0.55% |
|
SIT/CTT |
0.1% on buy
and sell |
0.1% on buy
and sell |
|
Transaction
charges |
0.00345%
(NSE/BSE) |
0.0031%(NSE)
0.0028%(BSE) |
|
GST |
18% on
(Brokerage+Transaction chage+SEBI fee |
18%% on
(Brokerage+Transaction Change+SEBI fee) |
|
SEBI
Charges |
? 10/crore. |
? 5/crore |
|
Stamp
Charges |
0.015% |
0.015% |
2.1. RISING PROMINENCE OF DISCOUNT BROKERS
Over the years, discount brokers have emerged as the
prominent type of brokers in the stock market. Online discount brokerage apps
have been termed as disruptors in the financial industry. Moreover, the top 5
discount brokers had a 25-30% market share in the overall equity and commodity ET
Markets (2019, ETMoney
(2020)
|
|
|
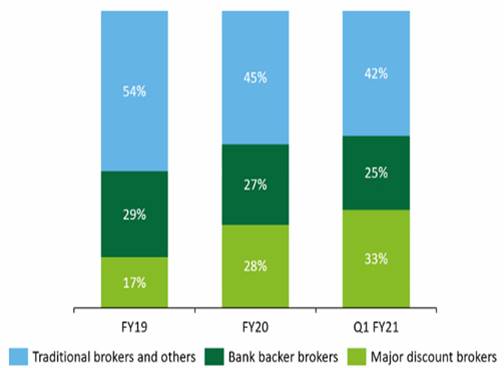
Chart 3 Increasing
Share of Discount Brokers Source:
Spark Capital |
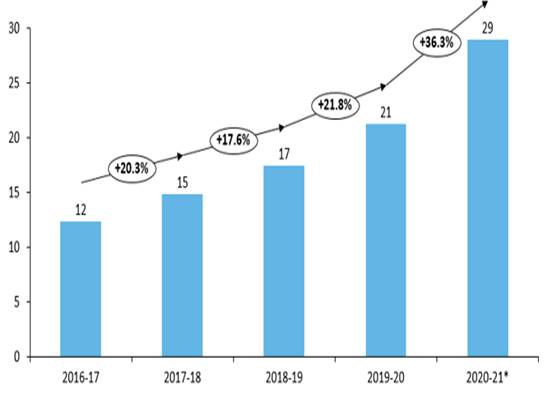
As per a report by
ICICI Securities on the Brokerage Industry of India, discount brokers like
Zerodha, Upstox, 5Paisa and Angel broking have been major beneficiaries,
especially in 2020 in terms of incremental client acquisition.
Zerodha Broking, one of the first discount brokerage platforms went live for retail trading in 2010. Breaking barriers that traders and investors face in terms of cost, support and technology, the market share for Zerodha has increased to over 13% in 2019-20. Similarly, the client size of Angel Broking has increased by 312% from 2013-14 to 2019-20 while traditional industry leaders like ICICI Securities and HDFC Securities have grown at a slower pace, losing market share to the Investment-tech firms.
Early mover advantage in this segment benefited discount brokers. Zerodha introduced a new pricing structure in the Indian market by introducing a deeply discounted flat fee-per-trade model. Digitalization with proprietary technology, improved user experience and R&D-oriented nature of business has attracted more clients especially New-to-Market customers. This has led many traditional brokerages like Share khan, Kotak Securities, ICICI Securities etc to come up with their own discount plans.
|
Table 3 Growth of market players (2013-20) |
|||||||||
|
Active Clints in (000) |
2013-14 |
2014-15 |
2015-16 |
2016-17 |
2017-18 |
2018-19 |
2019-20 |
Average YOY Growth |
Net Growth |
|
Zerodha |
18 |
30 |
62 |
166 |
541 |
909 |
1414 |
107.0% |
7757.6% |
|
ICICI
Securities |
501 |
595 |
560 |
618 |
798 |
844 |
1076 |
13.6% |
114.8% |
|
HDFC
Securities |
279 |
348 |
408 |
483 |
602 |
672 |
720 |
17.1% |
158.1% |
|
Angle
Broking |
140 |
160 |
171 |
230 |
364 |
413 |
576 |
26.6% |
311.7% |
|
Kotak
Securities |
223 |
268 |
247 |
274 |
369 |
438 |
572 |
17.0% |
156.4% |
|
Sharekhan |
275 |
343 |
336 |
366 |
535 |
510 |
550 |
12.2% |
99.9% |
|
Motilal
Oswal |
123 |
153 |
166 |
207 |
308 |
319 |
377 |
20.5% |
206.6% |
|
AXIS Securities |
77 |
120 |
184 |
259 |
405 |
419 |
270 |
23.3% |
251.2% |
|
SBI CAP
Securities |
68 |
114 |
126 |
169 |
214 |
209 |
250 |
24.20% |
267.5% |
|
NSE |
4288 |
5092 |
5170 |
5951 |
8290 |
8782 |
10796 |
16.6% |
151.8% |
|
Source: NSE Note: Average Year-on-Year Growth Rate and
Net Growth Rate include churn rate |
|||||||||
2.2. REASONS FOR SHIFT TO ONLINE DISCOUNT BROKERS
Digitally enabled discount brokers can adapt to technological advancements quicker because of higher agility, flexibility, and decisiveness, like with Robo-advisory, block-chain, cloud computing etc, to make their processes more cost-effective and time-efficient.
There are a variety of reasons which have aided the discount brokers ranging from the ease of trading service to regulations by the government.
2.2.1. LOWER FEES
Aimed at self-directed investors, working with a discount brokerage service can provide cheap access to instruments, ultimately leading to greater profits for the client over time. Their offer of minimal or no brokerage charges drives more retail participation to their platforms. Even small charges are reported to reduce stock market participation for less wealthy households Vissing-Jørgensen (2002).
Taking this example to prove the significance of investment fees to an investor in terms of the amount lost, an investor puts ₹500 a month into a brokerage account each year for 30 years, depositing a total of ₹180,000 over that time and earning an average annual 7% return.
|
Table 4 Investment Fees and its Implications |
|||
|
Case |
Total annual investment fees |
Account value after 30 years |
Amount Lost to fees |
|
Case1 |
0% |
?588,032.77 |
?0 |
|
Case2 |
0.25% |
?561,5151.53 |
?26,517.24 |
|
Case3 |
0.50% |
?536,320.22 |
?51,712.44 |
|
Case4 |
1.00% |
?489,628.12 |
?98,404.65 |
|
Case5 |
1.50% |
?447,454.73 |
?140,578.04 |
|
Case6 |
2.00% |
?409,348.84 |
?178,683.93 |
The last column in the chart shows how much would be lost to fees over 30 years. An investor who paid 2% in fees each year would give up more than ₹178,000 over 30 years, almost as much as the ₹180,000 deposited in the account during that time.
Working
on a ‘low margin and high volume’ model, firms like Zerodha do not
charge brokerage for equity delivery transactions and a minimal fee for other
transactions, driving more users to their platform which further makes the
trading volume high. While it already offers highly competitive fees, it
also offers flat discounts to low and high-value transactions. By charging a negligible amount to
the dealers for transactions, the exchanging volume is generally high, leading
to a greater number of customers and hence. The collection of fees from a large
number of clients leads to a sizable revenue.
Moreover,
the high-profit revenues are supported by fewer operational expenses which are
very low compared with top brokers, creating a ‘low operating leverage’.
Zerodha was operating on fixed operating costs of Rs 1.2bn and total operating
costs of Rs 2.0bn (FY18). This is considerably lower than that of ICICI
Securities, which was operating at a total cost of Rs 9.4bn in FY18.
Furthermore, ICICI Securities had 3700+ employees compared to Groww which had
400+ employees. Legacy companies run as
full-time brokerage houses providing research and advisory services in addition
to broking revenues. Thus, the operating costs in the full-service brokerages
are much higher, skewing their cost metrics. On the other hand, the online
structure and interface enable discount brokerage platforms to maintain low
operational costs. Zerodha reduced its IT costs by 50%, which is the primary
fixed cost allocated to fintech start-ups, by using Amazon Web Services to
build their cloud infrastructure. It no longer has to overprovision because it
can align its processing power with trading activity, decreasing time and
expense on IT capability management and post-trade processing.
2.2.2. FINTECH ADOPTION AND INNOVATION VACUUM
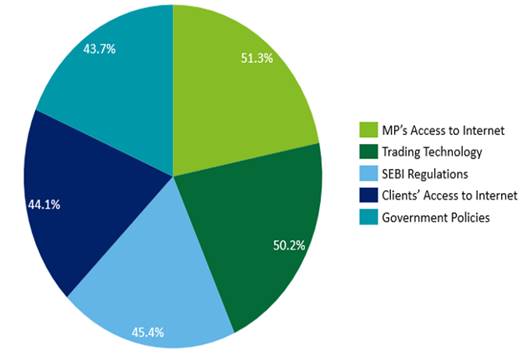
Technology has been the primary reason for improving business for market participants[3], with web access (51%) and improved trading technology (50%) leading the top reasons for the improvement of their businesses in the past five years. Both of these are reasons which can provide better margins and expansion possibilities across geographical boundaries. Among the top 5 identified from a Market Participants’ Survey conducted in SIS 2015, SEBI Regulations and Government Policies are external market factors, under no control of the organisation. All the internal factors are dependent on the digital capability and adoption of the brokers, who state clients’ access to the Internet, can improve their business significantly. Only about 18% of rural Indians have access to the internet, compared to nearly 65% in urban India. According to Bain PRICE research, rural and urban consumers within the same income segment conveyed nearly the same degree of comfort trying out new technologies. Thus, it is the authors’ opinion that there is tremendous opportunity due to the significant appetite of those in rural India to try out new technologies. 5 PAISA has already stated that a large number of its customers are from tier 2 and tier 3 cities.
|
|
|
Chart 4 Reasons
for Improvement in the Market Participants’ Business N = 1,016 (Market Participants’ Survey, SIS 2015) |
Retail brokers introduce technological solutions to keep with the consumer demand, enhance customer experience and optimise costs. But despite the presence of online platforms before discount broking platforms were launched in India, an innovation vacuum existed among the brokers. With the onset of discount broking platforms in India, various technological facilities were introduced, and rapid innovation was seen in these platforms with respect to digitalisation. The digital journeys of ICICI Bank and Zerodha have been tracked from when they first launched their electronic and online trading platforms, respectively.
|
Table 5 Key change of ICICI Bank and Zerodha across the years |
||
|
Year |
ICICI Bank |
Zerodha |
|
2000-2009 |
Launched
ICICi Direct-Electronic Tranding Platform in 2000 and online mutual fund
platform in 2001 |
|
|
2010-2011 |
Launched
online national Pension System facilities, SIP in equity and F&O @ FingerTips |
Launched
Indias first discount stockbroking platform and went live on retail trading |
|
2013 |
Launched
inflation-indexed national savings securities-cumulative, e-volting facility,
investment advisory services and flexi cash facilities on ICICI direct |
Built a
tech product to enable people to buy and sell stcok on a more suer friendly
platform |
|
2015 |
Launched
Insta account facility track and Act robo advisory platform and bullet trade
facility on ICICIDirect |
Launched
Kite-online tranding platform revolutinzing the tradeing ecosystem in India |
|
2017 |
Introduced
One-Click Investment for investment in mutual fund on ICICIDirect |
Launchrd
Coin-Mutual Fund Investing Platform |
Discount brokers continue to invest in new platforms−Zerodha on boarded small case (index creating and thematic investing platform), Sensibull (simplified option strategy trading platform) and Streak (algo trading without coding, back testing platform). Rising dependency on the internet and digital-enabled platforms is supported by increased Fintech funding which has seen a major boom for discount brokers. As stated by a Deloitte Research Report, increasing investments by brokerage firms are indicated by the level of overall funding in Investment-tech which reached a record high of $2.8 billion in 2018, growing at a compound annual growth rate of 47% from 2008. The surge in large late-stage deals for this subset of Fintech, specifically targeting retail investors, has boosted the funding. These companies are developing cost-friendly solutions for potential and existing retail investors through community and crowd sourced advice and investing platforms
Due to the interface and technology, investors in the age bracket of 25-35 have become inclined to discount brokerage firms, according to Nitin Kamath. 75% of Zerodha’s clients are aged less than 35 years, positioning the platform for first-time traders while around 67% of net client additions were first-time investors as of 2019. Similar patterns can be observed in other online discount brokers. The average age of investors trading through Upstox is 29.5 years. 5 PAISA too have a younger customer profile, according to company reports.
2.2.3. PARTICIPATION IN INVESTMENT DECISION
When it is time to trust someone to make an investment decision, more than 40% of investors depend on themselves. As discount brokers like Zerodha are execution-only platforms without necessary financial-advisory products, this becomes the ideal option for investors. This is a visible self-confidence bias indication, a much-documented phenomenon observed in behavioural finance where the individual investor makes glaring mistakes in investments resulting in a loss of wealth due to over-trading, over-confidence, and behavioural biases like name recognition.
|
Table 6 Trust Vis-à-vis Investment Decision-Making |
|
|
Self |
42.5% |
|
Broker |
20.1% |
|
Friend/Family |
16.2% |
|
Fund
Manager |
21.2% |
|
N=5,365(all urban investors, SIS 2015) |
|
3. FINANCIAL EDUCATION AND REGULATORY MEASURES
According to the NABARD SIS data, while 25% of the
highly educated (15+ years of education) invest in the securities markets, less
than 1% of those with 1 to 7 years of education do so. This percentage
increases to 6% and 15% for 8-10 years and 11-15 years of education,
respectively.
Only 24% of the Indian adult population is financially literate Klapper et al. (2015). This situation worsens if we consider only the rural population. According to the NABARD All India Rural Financial Inclusion Survey 2016-17, only 2.5% of rural households invested in any financial asset while only 9.4% of individuals from rural areas and over 13.2% from semi-urban areas reported having been exposed to any session on financial education or training. Nearly 95% of relevant investors found that investor education programs helped them make the right decisions concerning their investment choices SEBI (2020).
The Government of India, RBI and SEBI are actively
promoting financial inclusion with schemes like Jan Dhan Yojana, Aadhaar
enrollment and licensing of Payment Banks /Small Finance Banks, to name just a
few. Investment-Tech companies across the nation are taking the advantage of
these initiatives for expanding financial inclusion in the following areas by
leveraging technology.
Government-led efforts like Digital India are aimed at providing access to many civic and governance-related services to rural consumers electronically. This helps widen the presence of the internet and promotes the growth of brokers and the stock market with increased participation. This coupled with financial literacy programs and access to banking facilities address critical barriers facing rural India and lack of financial inclusion in the country.
In 2014, the Indian government launched Pradhan Mantri Jan Dhan Yojna (PMJDY) under the National Mission for Financial Inclusion, which envisages universal access to banking facilities for every Indian citizen. There is still, however, a huge need to improve banking infrastructure (e.g., ATMs and bank branches) required to help new consumers through the banking process.79.9% of the population aged 15+ reported having an account at a financial institution and 32.3% of internet users aged 16-64 use banking and financial services via mobile each month. RBI has allowed regional rural banks with a net worth of at least $15.28 million to launch internet banking facilities.
Along with government initiatives, firms are taking an active approach as well. Zerodha Varsity is the market leader’s tactic to educate and prepare their users for such scenarios and potential losses through an extensive and in-depth collection of financial resources. Upstox Learning Centre and Grow’s Blog pursue similar strategies which provide fundamental lessons to help investors grow out of their speculator outlook. This is seen as an alternative to financial guidance, by giving control to the users, thereby enhancing trust between people and discount brokers simultaneously.
4. PANDEMIC
90% of Indian consumers have witnessed a change in personal spending behaviour since the onset of the pandemic, according to the ‘Consumer Spending Sentiment Index Report’ by InterMiles. The Covid-19 induced lockdown has been a boom for discount brokerage firms as their market shares have risen substantially. The discount brokerage firms have also offered cash rewards to people bringing in new clients to the platform.
Investors opened 3.4 million new Demat accounts in the September quarter FY21 (SEBI). Meanwhile, the number of Demat accounts, which contain retail investor holdings in securities in electronic format, increased 27% last year to stand at 49.8 million at the end of 2020.
|
|
|
Chart 5 Investor Demat Accounts (in million) Source: CDSL Annual
Presentation |
4.1. LITERATURE REVIEW
This paper pertains to the various strands of the discount stock brokerage industry and innovation in the investment ecosystem. Since the discount brokers are differentiated from full-service brokers basis the absence of additional services relating to financial and market advice, investors on such a platform have no guidance from the broker while making trading decisions.
Grable (2000) extended the investigative query initiated by Carducci and Wong (1998) regarding risk-taking, by examining demographic, socioeconomic and attitudinal characteristics as determinants of financial risk tolerance using descriptive discriminant analysis. It ascertained a significant relationship between multiple underlying socio-demographic factors (like education, income, age, and marital status) and financial risk tolerance. It was concluded that higher levels of financial knowledge and attained education correspond with higher levels of risk tolerance. The SIS data complemented Grable’s argument by establishing a direct linear relationship between risk appetite and education in India, as equities (riskier instruments) were the more preferred investment instrument choice among investors with more years of education. Additionally, it also proved that the investor distribution in urban India is skewed towards the higher educated groups.
The findings further revealed that the negligible amount of securities markets investors among rural households, despite possessing income and savings rates that allow them to invest in market-related instruments, exhibits a singular lack of awareness and dearth of outreach. The All-India Debt and Investment Survey (2013) also concluded that although savings rates have significantly increased, the investment in securities markets still remains extremely muted amongst the rural population.
The available literature in the form of various articles and reports have explored Investment-Tech but the authors of this paper find a gap in the research compiled with context to the Indian trading players and participants and have thus, endeavoured to create a research repository for the same.
5. RESEARCH METHODOLOGY
Assumptions:
· The clients are not the total customer associated with the brokerage but are the active customers who have traded on the specific platform.
· The active clients are the number of clients who traded in the last month of the last financial year or in the previous month of the relevant financial year.
· The clients are not exclusive to the platform, as some participants in the secondary market participate via multiple accounts and/or multiple platforms as well.
This paper uses the time-series data from 2013-14 to 2020-21 of Mobile and Internet-based trading as a share of total turnover on NSE. To build up the research in the subsequent time-series data regression analysis, the dependent variable is Mobile and Internet-based trading as a percentage of total turnover on NSE. The independent variables are the market shares of clients of three different kinds of brokerages (as a percentage of the total number of clients on NSE) during the analysis period.
|
Table 7 Regression Analysis |
|||
|
Variable |
Type of Brokerage |
Data Source |
Expected
sing of coefficient |
|
Mobile and
Internet Based Tranding (Dependent variable) |
- |
National
Stock Exchange |
- |
|
Zerodha
(Indeoendent variable) |
Disount
Broker |
National
Stock Exchange |
Positive |
|
ICICI
Securities (independent variable) |
Full-Service
Broker |
National
Stock Exchange |
Negative |
|
Angle
Broking (independent variable) |
Full-Service
Broker with Discount Brokerage Rates |
National
Stock Exchange |
Positive |
Firstly, in order to examine the extent of the change in Mobile and Internet Based Trading as a percentage of total turnover on NSE, a statistical tool to scrutinize how strongly each independent variable is related to the dependent variable is calculated. Independent variables have been taken as:
1) Zerodha
2) ICICI Securities
3) Angel Broking
A positive correlation indicates the extent to which the pair of variables increase or decrease in parallel while a negative correlation indicates the extent to which one variable increases as the other decreases.
Secondly, to further analyse the relationship between the explained or dependent variable (Y) and the independent or explanatory variables (x)-Ordinary Least Squares ^1 regression is undertaken.
The general expression of the model can be written as:
Y=![]() (sample regression function)
(sample regression function)
Where:
Y is the dependent variable
X is the independent variable
e is the residual term
The sample
regression functions obtained in the paper are as follows:
Mobile and
Internet-based trading=![]()
Mobile and
Internet-based trading=![]()
Mobile and
Internet-based trading=![]()
In the above regression model the following parameters are analysed:
· The goodness of fit of a regression line is measured by the coefficient of determination, r which measures the percentage of the total variation in Y explained by the regression model.
· In order to check that whether the independent variable is significant or not i.e., the independent variable has an effect on the dependent variable or not, the following hypothesis is made:
Null Hypothesis: H₀: Independent variable is insignificant
Alternative Hypothesis: H₁: Independent variable is significant
If the |t-ratio| is greater than t-critical, then the null hypothesis is rejected and hence the independent variable is significant. In order to check whether the regression equation is relevant or not, F statistic is calculated, and the following hypothesis is made:
Null Hypothesis, H₀: Model is irrelevant
Alternative Hypothesis, H₁: Model is relevant
Then we calculate-

If the F calculated is greater than F-critical, then the null hypothesis is rejected and hence model is relevant.
|
Table 8 Summary of result for period 2013-14 to 2020-21 |
||||
|
Dependent Variable (Y) |
Independent Variable (X) |
Correlation |
Regression Equation |
r^2 |
|
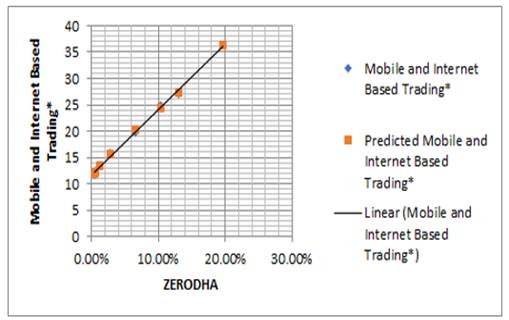
mobile and
Internet-Based Trading |
Zerodha |
0.9982233 |
Y=11.775+123.512X+e |
0.996449697 |
|
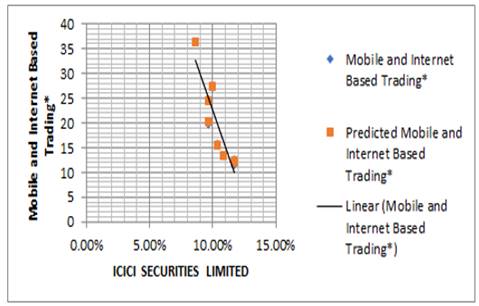
Mobile and
internet--Based Tranding |
ICICI Secrities |
-0.90677 |
Y=95.966-735.535X+e |
0.822232331 |
|
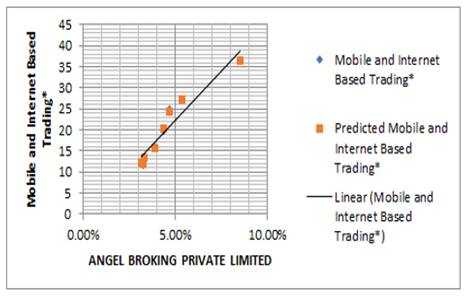
Mobile and
Intemet-Based Trading |
Angle
Broking |
0.9899397 |
Y=1.1985+468.560X+e |
0.921484263 |
The results shown in the table explains that the strongest uphill (positive) linear relationship exists between Mobile and Internet-based trading and the number of clients of Zerodha Also, all the independent variables have a significant impact on the dependent variable and all the regression equations are relevant but, r^2 is highest between Mobile and Internet-based trading and Zerodha which implies approximately 99% of total variations in Mobile and Internet-based trading are explained by the variation in the number of clients of Zerodha.
Based on the above results it would be safe to conclude that the change in the number of clients of Zerodha has a significant impact on the Mobile and Internet-based trading penetration in India.
APPENDIX
|
Table 9 Regression of Mobile and Internet-Based Trading on Zerodha |
||||
|
Coefficients |
Standard Error |
t stat |
Significance |
|
|
Intercept |
11.77568 |
0.284768 |
41.35177 |
Yes |
|
Zerodha |
123.5129 |
3.009828 |
41.03653 |
Yes |
|
Regression
Statistics |
||||
|
R square |
F |
Relevant |
||
|
0.99645 |
1683.997 |
Yes |
||
|
Table 10 Regression of Mobile and internet-based trending on ICICI securities |
||||
|
Coefficients |
Standard Error |
t stat |
Significance |
|
|
Intercept |
95.96673 |
14.44938 |
6.641583 |
Yes |
|
ICICI
Securities |
-735.535 |
139.623 |
-5.26801 |
Yyes |
|
Regression Statistics |
||||
|
R sqare |
F |
Relevant |
||
|
0.822232 |
27.75192 |
Yes |
||
|
Table 11 Regression of mobile and internet-based trending angel broking |
||||
|
Coefficient |
Standard Error |
t stat |
Significance |
|
|
Intercept |
-1.19853 |
2.713898 |
-0.44163 |
Yes |
|
Angle
Broking |
468.5606 |
55.83731 |
8.391532 |
Yes |
|
Regression
Statistics |
||||
|
R-square |
F |
Relevant |
||
|
0.921484 |
70.4178 |
Yes |
||
|
Table 12 Number of clients of key market players (2013-2021) |
||||
|
FY |
Angel Broking Private Limited |
ICICI Secuetites Limited |
Zerodha |
NSE |
|
2013-14 |
140174 |
500733 |
17523 |
4288171 |
|
2014-15 |
1160354 |
594714 |
30379 |
5091737 |
|
2015-16 |
170808 |
560438 |
61970 |
5169963 |
|
2016-17 |
230194 |
618359 |
165586 |
5951301 |
|
2017-18 |
363663 |
798355 |
540905 |
8289801 |
|
2018-19 |
412809 |
843975 |
9099008 |
8782207 |
|
2019-20 |
576414 |
1075956 |
1414376 |
10795660 |
|
2020-21 |
1564667 |
1580233 |
3602074 |
18356146 |
|
Table 13 Data for Regression Analysis |
||||
|
FY |
Angel Broking Limited |
ICICI Securities Limited |
Zerodha |
Mobile and Internet-Based Tranding (as% of toal turnover of NSE) |
|
2013-14 |
3.27% |
11.68% |
0.41% |
11.66% |
|
2014-15 |
3.15% |
11.68% |
0.60% |
12.58% |
|
2015-16 |
3.30% |
10.84% |
1.20% |
13.48% |
|
2016-17 |
3.87% |
10.39% |
2.78% |
15.90% |
|
2017-18 |
4.39% |
9.63% |
6.52% |
19.67% |
|
2018-19 |
4.70% |
9.61% |
10.35% |
24.84% |
|
2019-20 |
5.34% |
9.97% |
13.10% |
27.11% |
|
2020-21 |
8.52% |
8.61% |
19.62% |
36.38% |
|
Table 14 Marker share of top brokerage in india (as a share of toal active clients on NSE) |
|||||||
|
Market Share |
2013-14 |
2014-15 |
2015-16 |
2016-17 |
2017-18 |
2018-19 |
2019-20 |
|
Zerodha |
0.40% |
0.60% |
1.20% |
2.80% |
6.50% |
10.40% |
13.10% |
|
ICICI
Securities |
11.70% |
11.70% |
10.80% |
10.40% |
9.60% |
9.60% |
10.00% |
|
HDFC
Securities |
6.50% |
6.80% |
7.90% |
8.10% |
7.30% |
7.70% |
6.70% |
|
Angel
Broking |
3.30% |
3.10% |
3.30% |
3.90% |
4.40% |
4.70% |
5.30% |
|
Kotak
Securities |
5.20% |
5.30% |
4.80% |
4.60% |
4.50% |
5.00% |
5.30% |
|
Sharekhan |
6.40% |
6.70% |
6.50% |
6.10% |
6.50% |
5.80% |
5.10% |
|
Mmotilal
Oswal |
2.90% |
3.00% |
3.20% |
3.50% |
3.70% |
3.60% |
3.50% |
|
AXIS
Securities |
1.80% |
2.40% |
3.60% |
4.40% |
4.90% |
4.80% |
2.50% |
|
SBI CAP
Securities |
1.60% |
2.20% |
2.40% |
2.80% |
2.60% |
2.40% |
2.30% |
REFERENCES
AWS Amazon Services. (2021). Helping Zerodha handle the volatility of financial markets. https://aws.amazon.com/solutions/case-studies/zerodha/
Abreu, M., & Mendes, V. (2010). Financial Literacy and Portfolio Diversification. In Quantitative Finance (Vol. 10(5), pp. 515-528). https://doi.org/10.1080/14697680902878105
Barber, B. B., & Odean, T. (2000). Trading Is Hazardous to Your Wealth : The Common Stock Investment Performance of Individual Investors. Journal of Finance, 5(2), 773-806. https://doi.org/10.1111/0022-1082.00226
CNBC. (2020), Here's how Robinhood is raking in record cash on customer trades - despite making it free. Here's how Robinhood is raking in record cash on customer trades - despite making it free, (August 2020) 1. https://www.cnbc.com/2020/08/13/how-robinhood-makes-money-on-customer-trades-despite-making-it-free.html
CNBCTV18. (2020), Data story : 'Robinhoods' drive share trading boom in India during lockdown. (August 19) https://www.cnbctv18.com/market/india-stock-trading-boom-zerodha-robinhood-6682451.htm
Carducci, B. J., & Wong, A. S. (1998). Type A and risk taking in everyday money matters (Vol. 12). Journal of Business and Psychology. https://link.springer.com/article/10.1023/A:1025031614989
Center for Information Systems Research, MIT Sloan Management. (2013), Companies with Better Digital Business Models Have Higher Financial Performance. Research Réunion préparatoire, XIII(July) (7). https://cisr.mit.edu/publication/2013_0701_DBM-Performance_WeillWoerner
Chandrasekhar, C. P., Malik, S., & Akriti. (2016). The elusive retail investor: How deep can (and should) India's stock markets be? SEBI Development Research Group Study. https://www.sebi.gov.in/sebi_data/DRG_Study/elusiveretailinvestor.pdf
Deccan Chronicle. (2020), Trade the millennial way with India's top broking Apps. (February 26)https://www.deccanchronicle.com/technology/in-other-news/260220/trade-the-millennial-way-with-indias-top-broking-apps.html
Deloitte. (2019). Driving innovation in investment management. https://www2.deloitte.com/us/en/pages/financial-services/articles/fintech-startups-focusing-on-invest-tech.html
ET Markets. (2019), Zerodha is now biggest broking firm in India. Economic Times. (January 10) https://economictimes.indiatimes.com/markets/stocks/news/rise-of-discount-broking-zerodha-is-now-biggest-broker-in-india/articleshow/67470490.cms
ETMoney. (2020). Indian Investment Report - 2020. ETMoney. https://www.etmoney.com/blog/india-investment-report-2020-a-look-at-how-india-invests/
Grable, J. E. (2000). Financial Risk Tolerance and Additional Factors that Affect Risk Taking in Everyday Money Matters (Vol. 14). Journal of Business and Psychology. https://link.springer.com/article/10.1023/A:1022994314982
HDFC Securities. (2019), Broking Industry. HDFC Securities Institutional Research. (March 19)https://www.hdfcsec.com/hsl.docs/Broking%20-%20Update%20-%20Mar19%20-%20HDFC%20sec-201903191711243793044.pdf
Hon, E. (2019), Decoding Robo Advisory for Indian Investors. Money Control. (October 7)https://www.moneycontrol.com/news/business/personal-finance/decoding-robo-advisory-for-indian-investors-4503991.html
IBEF. (2021), Banking Industry Report. (March) https://www.ibef.org/download/Banking-March-2021.pdf
ICICIDirect. (2021). Indian Brokerage Industry. ICICI Direct Research. https://www.icicidirect.com/mailimages/IDirect_BrokerageIndustry_March21.pdf
Kandpal, V., & Mehrotra, R. (2019), Financial Inclusion : The Role of Fintech and Digital Financial Services in India. Indian Journal of Economics & Business, (March 13)19(1), 85-93. https://ssrn.com/abstract=3485038
Kemp, S. (2021). Digital in India. DataReportal. https://datareportal.com/reports/digital-2021-india
Klapper, L., Lusardi, A., & Oudheusden, P. V. (2015). Financial Literacy Around the World : Insights from S&P Global Financial Literacy Survey. Standard & Poor's Ratings Services. https://gflec.org/wp-content/uploads/2015/11/3313-Finlit_Report_FINAL-5.11.16.pdf?x22667
MPRA. (2020). Impact Assessment of Pradhan Mantri Jan-Dhan Yojana in Augmenting Financial Inclusion in India - A District-Level Analysis. https://mpra.ub.uni-muenchen.de/105064/1/MPRA_paper_105064.pdf
Nair, S. (2020), 'Dumb money' is winning in the Indian stock market but it may run out of beginner's luck. CNBC. (July 31) https://www.cnbctv18.com/market/dumb-money-is-winning-in-the-indian-stock-market-but-it-may-run-out-of-beginners-luck-6510141.htm
NABARD (2017) National Bank for Agriculture and Rural Development. NABARD All India Rural Financial Inclusion Survey 2016-17. https://www.nabard.org/
National Stock Exchange of India Limited. (2017). History & Milestones. NSE. https://www1.nseindia.com/global/content/about_us/history_milestones.htm
SEBI. (2020). HANDBOOK OF STATISTICS 2020. https://www.sebi.gov.in/reports-and-statistics/publications/may-2021/handbook-of-statistics-2020_50238.html
Securities and Exchange Board of India. (2015). SEBI Investor Survey 2015. Securities and Exchange Board of India. https://www.sebi.gov.in/sebi_data/attachdocs/1491452612271.pdf
Vissing-Jørgensen, A. (2002). imited asset market participation and the elasticity of intertemporal substitution. Journal of Political Economy. 825-853 https://doi.org/10.1086/340782
World Economic Forum & Accenture. (2016), Digital Transformation of Industries. World Economic Forum White Paper. (January) https://reports.weforum.org/digital-transformation/wp-content/blogs.dir/94/mp/files/pages/files/digital-enterprise-narrative-final-january-2016.pdf
World Economic Forum & Bain & Company. (2018). Future of Consumption in Fast-Growth Consumer Markets : India. Insight Report. http://www3.weforum.org/docs/WEF_Future_of_Consumption_Fast-Growth_Consumers_markets_India_report_2018.pdf
Zerodha Broking Ltd. (2021). List of all charges and taxes. https://zerodha.com/charges#tab-equities
[1] Turnover ratio=Annualized value of
domestic shares traded/Market Capitalization. The value is annualized by
multiplying the monthly average by 12
[2] A trading platform is software used for
trading: opening, closing, and managing market positions through a financial
intermediary, such as an online broker.
[3] Market participants (financial
intermediaries): brokers, sub-brokers, depository participants and authorized
persons across the country
 This work is licensed under a: Creative Commons Attribution 4.0 International License
© Granthaalayah 2014-2022. All Rights Reserved.