THE EFFECT OF CUSTOMER LOYALTY ON FAST FOOD RESTAURANTS IN BATAMGolan Hasan 1 1, 2 Faculty of Economic, University International Batam, Batam City, Indonesia. |
|
||
|
|
|||
|
Received 16 December 2021 Accepted 6 January 2022 Published 31 January 2022 Corresponding Author Kiki
Nadila, kikinadilaa@gmail.com DOI 10.29121/granthaalayah.v10.i1.2022.4481 Funding:
This
research received no specific grant from any funding agency in the public,
commercial, or not-for-profit sectors. Copyright:
© 2022
The Author(s). This is an open access article distributed under the terms of
the Creative Commons Attribution License, which permits unrestricted use, distribution,
and reproduction in any medium, provided the original author and source are
credited.
|
ABSTRACT |
|
|
|
This study aims to analyze the influence of
Service, Price, Quality and Brand Image by mediating Trust on Customer
Loyalty. In accordance with the requirements, it is known that the visiting
population is 1.1 million people, so based on Krejcie and Morgan's tables,
the number of samples that must be needed is 384 respondents. The data used
in this study were 384 respondents. The results obtained from the Partial
Least Square (PLS) approach for data analysis say that the Service variable
has a significant effect on Trust, as well as the Price, Quality, and Brand
Image variables which also have a significant effect on Trust. and then it
also has a significant effect on the perceived value variable on Customer
Loyalty, as well as the Quality variable with Brand Image which also has a
significant effect on Customer Loyalty. |
|
||
|
Keywords: Service,
Price, Quality, Brand Image, Trust, Costumer Loyalty 1. INTRODUCTION In 2014, fast food chains in Indonesia, there were
KFC (Kentucy Fried Chicken) and McDonald’s followed by Es Teler 77, A &
W, and others. It can be seen here, consumers, especially young people in
developing markets, prefer a lifestyle that is supported by convenient and
practical technology, which makes young people nowadays very often go to fast
food restaurants. This finding was found in Indonesia as one of the largest
markets for the food service industry in ASEAN with a trend in the use of
delivery service applications and the Indonesian Ministry of Communication
and Information said that the generation or young people in Indonesia are
consumers and, in this way, can show opportunities for the development of
e-commerce in Indonesia. Indonesia, from the many fast-food restaurants that
enter Indonesia, it is certain that a competition has formed among all fast-food
restaurants in Indonesia. Namin (2017). As can be seen,
especially in Batam, Indonesia. There have been a lot of fast-food
restaurants that have entered Batam which are familiar to residents in Batam.
Such as, KFC (Kentucy Fried Chicken), McDonald’s, A&W, Richesse, and
Burger King. With so many fast-food restaurants in Batam, there are also
various types of services that can be provided to their customers, as
explained above, that these fast-food restaurants provide drivethru services,
delivery services, and so on. etc., this is done as one of the strategies
used to be able to compete with its competitors, so as to provide comfort and
satisfaction to its customers. At this time one of the fast-food restaurants
that is well known by every community in the city of Batam is the KFC
restaurant, this fast-food restaurant is one of the fast |
|
||
food restaurants in Batam which has the most outlets in Riau Islands Province and also in Batam City. Slack et al. (2021)
Talking about customer loyalty, how does this fast-food restaurant in Batam maintain or create customer loyalty to its customers. In this case, of course, there are factors that influence the existence of customer loyalty. One of them is in terms of service provided by fast food restaurants to their customers, which can provide satisfaction and comfort that can make customers loyal to the restaurant and the products and services provided. However, there are also several other factors that can affect customer loyalty to fast food restaurants in Batam, namely in terms of the price offered, the quality of goods and services that can be provided to customers and also the brand image of the fast-food restaurants that make customers have a sense of trust in the products and services of the fast-food restaurant. With this trust, the emergence of what is called customer loyalty. So, with this customer loyalty, the fast-food restaurants in Batam city can maintain the stability of the restaurant business process and can generate large profits. Due to this customer loyalty, customers who already believe and are loyal to the products and services at the fast-food restaurant will continue to subscribe to the restaurant and not to other fast-food restaurants. Therefore, customer loyalty is one of the most important things in maintaining stability or improvement that can be generated by fast food restaurants in Batam. Limakrisna and Ali (2016)
2. LITERATURE REVIEW
2.1. Service on Trust
Kundu (2018) stated that the effect of Service on Trust has a result that states it has a significant effect. This statement is also supported by Christoph et al. (2014). which also has research results showing that Service has a significant effect on Trust. Research conducted by Halim et al. (2014) The statement states that Service can make consumers feel that they are gain more Trust.
H1: Service has a significant positive effect on Trust
2.2. Quality with Trust
Zhou (2012) stated that the effect of Quality on Trust has
a result that states it has a significant effect. This statement is also
supported by Kura (2011) with the results of
his that Quality has a significant effect on Trust. The research conducted Zhou (2011), states that Quality
has a significant effect on the consumers Trust.
H2: Quality has a significant positive effect on Trust
2.3. Price with Trust
Suhaily and Darmoyo (2017) stated that the
influence of Price on Trust has results which state that it has a significant
effect. This statement is also supported by Kim et al. (2011), who also have
research results showing that Price has a significant effect on Trust. The
research conducted by Setiawan et al. (2020) , states that consumer Price
creates a Trust by consumers.
H3: Price has a significant positive effect on Trust
2.4. Brand Image with Trust
Halim et al. (2014) said that the relationship between Brand Image
and Trust had a result which stated that it had a significant effect. This
statement is also supported by Lien et al. (2015) which also has
research results showing that the Brand Image of a product has a significant
effect on the Trust received by consumers. The research conducted by Alif Fianto et al. (2014) states that the right Brand
Image can make consumers feel that they get more Trust.
H4: Brand Image has a significant positive effect on
Trust
2.5. Trust to CUSTOMER Loyalty
Anwar et al. (2015) states that the Trust by
consumers has a significant effect on consumers' Costumer Loyalty. This
statement is also supported by Liu et al. (2011) who also have research
results showing that Trust has a significant effect on Costumer Loyalty. The
research conducted by Chinomona
and Sandada (2013) states that the Trust
received by consumers will be a factor that influences their Costumer Loyalty.
H5: Trust has a significant positive effect on Customer
Loyalty
2.6. Service with CUSTOMER Loyalty
Woisetschläger et al. (2011) stated that the Service perceived by consumers had an effect on Costumer Loyalty. This statement is also supported by Zena and Hadisumarto (2013) which also has research results showing that Service has a significant effect on Costumer Loyalty. The research conducted by Lee (2013) states that Service is one of the factors that influence customer Loyalty.
H6: Service has a significant positive effect on Customer Loyalty
2.7. Brand Image with CUSTOMER Loyalty
Sirapracha and Tocquer (2012) stated that the influence of Brand Image on Customer Loyalty has a result which states that it has a significant effect. This statement is also supported by Anwar et al.(2015) which also has research results showing that Brand Image has a significant effect on Customer Loyalty. The research conducted by Ogba and Tan (2009) states that Brand Image is one of the factors that significantly influences Customer Loyalty
H7: Brand Image has a significant positive effect on Customer Loyalty
|
|
|
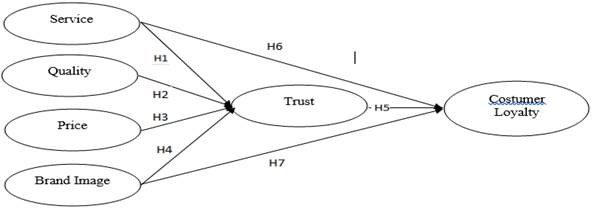
Figure 1 Effect
of Service, Quality, Price, Brand Image, and Trust on Customer Loyalty |
3. RESEARCH METHODS
This research methodology uses sample data collection techniques carried out through surveys by utilizing digital in the form of questionnaires distributed online to get responses from respondents who are residents of Batam City, totalling 1.1 million people, which is then based on Krejcie and Morgan tables, samples or respondents which must be accepted as many as 384 respondents. Then the data generated from 384 respondents was processed through the PLS approach for data analysis. The objects taken in the survey are fast food restaurants with the brands KFC, McDonald’s, A&W, Richesee Factory, and Burger King. In an effective data collection process, namely through the distribution of questionnaires to respondents to find out the response of the target respondents to find out data about fast food restaurants chosen by the people of Batam City.
4. RESULT AND DISCUSSION
The demographic data below are obtained from the results of distributing online questionnaires to 384 respondents from the Batam City community through the distribution of online links.
|
Table 1
Characteristic of Respondent |
||
|
Variable |
Amount |
Percent |
|
Gender |
||
|
Male |
256 |
66,7 |
|
Female |
128 |
33,3 |
|
Age |
||
|
17-25 Years |
346 |
90 |
|
26-35 Years |
38 |
10 |
|
Education |
||
|
High School |
369 |
96,2 |
|
bachlor's degree |
13 |
3,4 |
|
Master's degree |
1 |
0,2 |
|
Doctor's degree |
1 |
0.2 |
|
Income per Month |
||
|
Below Rp.
4.000.000 |
25 |
6,5 |
|
Rp. 4.000.000 -
Rp. 6.000.000 |
330 |
85,9 |
|
Rp. 6.500.000 -
Rp. 8.500.000 |
25 |
6,5 |
|
Above Rp. 8.500.000 |
4 |
1,1 |
|
Favourite Fast
Food Restaurant Brand |
||
|
KFC |
160 |
41,6 |
|
MC' Donald's |
158 |
41,2 |
|
A&W |
30 |
7,8 |
|
Burger King |
26 |
6,8 |
|
Richesee Factory |
10 |
2,6 |
|
Source: Primary Data Processed (2022) |
||
based on the results of the data collected, the conclusions from the
results of the table above are as follows:
1)
The
result of the majority of Male respondent were 256 respondent (66.7%).
2)
The
result of the majority of respondent age 17 – 25 Years were 346 respondent
(90%).
3)
The
result of the majority of high school education respondent were 369 respondent
(96.2%).
4)
The
result of the majority of respondent who earn Rp. 4.000.000 – Rp. 6.000.000 per
month were 330 respondent (85.9%).
5)
The
result of the majority of KFC that was respondent favourite Fast Food
Restaurant Brand were 160 respondent (41.6%).
the number of questions distributed through questionnaires is data
obtained from previous research, all variables have 4 questions Sumi and Kabir (2018), Because there are 6 variables, a total of 24 questions are formed Jalilvand
et al. (2011).
5. CMB TEST (COMMON METHOD BIASES)
From the analysis of the SPSS 24.0 program, the result of the variance value is 46% which means the result is less than 50%, it means that there is no common method bias in this research.
6. VALIDITY AND RELIABILITY TEST
in testing the data in this study using the PLS system which can test the validity and reliability data which can be determined from the outer loading value of each indicator whose value exceeds 0.6. then validity can also be determined through the value of Average Variance Extracted (AVE) which must show the value of each variable that exceeds 0.5. then the results will be declared significant if the results of the processed data show a t-statistic value more than 1.96 or a P-value below 0.05.
|
Table 2 Summary
of Validity Test Result |
|||
|
Variable |
Indicator |
Loadings |
AVE |
|
Brand Image |
B|1 |
0.912 |
0.717 |
|
B|2 |
0.747 |
||
|
B|3 |
0.927 |
||
|
B|4 |
0.786 |
||
|
Customer Loyalty |
CL1 |
0.721 |
0.724 |
|
CL2 |
0.944 |
||
|
CL3 |
0.773 |
||
|
CL4 |
0.941 |
||
|
Price |
P1 |
0.912 |
0.619 |
|
P2 |
0.805 |
||
|
P3 |
0.934 |
||
|
P4 |
0.350 |
||
|
Quality |
Q1 |
0.715 |
0.520 |
|
Q2 |
0.848 |
||
|
Q3 |
0.884 |
||
|
Q4 |
0.262 |
||
|
Service |
S1 |
0.126 |
0.516 |
|
S2 |
0.829 |
||
|
S3 |
0.845 |
||
|
S4 |
0.814 |
||
|
Trust |
T1 |
0.113 |
0.545 |
|
T2 |
0.833 |
||
|
T3 |
0.843 |
||
|
T4 |
0.873 |
||
|
Source: Primary Data Processed (2022) |
|||
In the Cronbach's Alpha
test if the test results show a value above 0.05 then the data can be declared
reliable and if Composite Reliability shows results that have a value that
exceeds 0.7, then the data table can be declared reliable.
|
Table 3 Reliability Test Result |
||
|
Variable |
Composite Reliability |
Cronbach's Alpha |
|
Brand Image |
0.909 |
0.865 |
|
Customer Loyalty |
0.912 |
0.870 |
|
Price |
0.855 |
0.767 |
|
Quality |
0.793 |
0.648 |
|
Service |
0.778 |
0.625 |
|
Trust |
0.796 |
0.658 |
|
Source: Primary
Data Processed (2022) |
||
based
on the results above, shows the results of reliability and can it is said that
all questions have a composite reliability above 0.7 so that declared reliable.
7. INNER MODEL TEST (STRUCTURAL MODEL)
7.1. Path Coefficient Test
A relationship can be said to be significant with a significance level of 5%, if it has P-values below 0.05 or T-statistics more than 1.96. This test uses the path coefficient test and specific indirect effects.
|
Table 4 Summary
of Path Coefficients Test Result |
|||
|
Variable |
T-Statistic |
P-Value |
Explanation |
|
Brand Image->
Customer Loyalty |
2.469 |
0.014 |
Significant |
|
Brand Image->
Trust |
2.767 |
0.006 |
Significant |
|
Price-> Trust |
3.836 |
0.000 |
Significant |
|
Quality->
Trust |
3.744 |
0.000 |
Significant |
|
Service-> Customer
Loyalty |
2.740 |
0.009 |
Significant |
|
Service->
Trust |
3.760 |
0.000 |
Significant |
|
Trust-> Customer
Loyalty |
2.602 |
0.010 |
Significant |
|
Source: Primary Data Processed (2022) |
|||
Hypothesis 1
H1 : Service Affects
Trust
The direct influence test result in the table above show the Service variable The Trust has a significant effect as seen from the tstatistics value of 3.760 and with a P-Value of 0.000. Kundu (2018) and Lien et al. (2015).
Hypothesis 2
H2 : Quality Affects
Trust
The direct influence test result in the table above show the Quality variable The Trust has a significant effect as seen from the tstatistics value of 3.744 and with a P-Value of 0.000. Zhou (2012) and Zhou (2011).
Hypothesis 3
H3 : Price Affects Trust
The direct influence test result in the table above show the Price variable The Trust has a significant effect as seen from the tstatistics value of 3.836 and with a P-Value of 0.000. Kim et al. (2011) and Setiawan et al. (2020).
Hypothesis 4
H4 : Brand Image Affects
Trust
The direct influence test result in the table above show the Brand Image variable The Trust has a significant effect as seen from the tstatistics value of 2.767 and with a P-Value of 0.006. Alif Fianto et al. (2014) and Halim et al. (2014).
Hypothesis 5
H5 : Trust Affects Customer
Loyalty
The direct influence test result t in the table above show the Trust variable The Costumer Loyalty has a significant effect as seen from the tstatistics value of 2.602 and with a P-Value of 0.010. Liu et al. (2011) and Anwar et al. (2015).
Hypothesis 6
H6 : Service Affects Customer Loyalty
The direct influence test result in the table above show the Service variable The Costumer Loyalty has a significant effect as seen from the tstatistics value of 2.740 and with a P-Value of 0.009. Woisetschläger et al. (2011) and Zena and Hadisumarto (2013).
Hypothesis 7
H7 : Brand Image Affects
Customer Loyalty
The direct influence test result in the table above show the Brand Image variable The Costumer Loyalty has a significant effect as seen from the tstatistics value of 2.469 and with a P-Value of 0.014. Ogba and Tan (2009) and Sirapracha and Tocquer (2012).
|
Table 5 Indirect Effect Test Result |
|
|
|
|
Variable |
T- statistic |
P- Value |
Explanation |
|
Brand Image-> customer Loyalty |
2.469 |
0.014 |
Significant |
|
Price -> customer Loyalty |
3.086 |
0.002 |
Significant |
|
Quality-> customer Loyalty |
2.753 |
0.006 |
Significant |
|
Service-> customer Loyalty |
2.620 |
0.009 |
Significant |
|
Source: Primary Data
Processed (2022) |
|||
the Brand Image variable has an indirect effect on Customer Loyalty showing a t-statistic value of 2.469 and a p-value of 0.014, so it can be stated that it has significant effect, as well as the Price variable that has an indirect effect on Customer Loyalty which shows the results of the t-statistic value of 3.086 and also the p-value of 0.002 which can be stated to have significant effect. However, the Quality variable that indirectly affects Customer Loyalty shows the results of a t-statistic value of 2.753 and a p-value of 0.006 which can be stated that the two variables have a significant effect, as well as the Service variable which has an indirect effect on Customer Loyalty which shows the results of the T-statistic value of 2.620 and the p-value of 0.009 which can be stated that the two variables have a significant effect..
8. R SQUARE TEST
This test has the aim of testing the relationship between independent variable, mediating variable and dependent variable. Seen in the table 6 results from each variable.
|
Table 6 R Aquare Adjusted |
|
|
Variable |
R Square Adjusted |
|
Customer Loyalty |
0.938 |
|
Trust |
0.981 |
|
Source: Primary Data
Processed (2022) |
|
9. QUALITY INDEX TEST
At the GoF testing stage where it can be done through the GoF calculation formula, namely by taking the average value of AVE which is then multiplied by the average r value of R-square, = 0.607 x 0.959 resulting in 0.582113 (> 0.36), so it is stated that this research model belongs to the large result group Hair et al. (2020).
10. CONCLUSIONS
The purpose of this study was to determine the understanding of Customer Loyalty towards a fast-food restaurant in Batam. The conclusion in this study states that Service has a significant effect on Trust, Quality has a significant effect on Trust, Price has a significant effect on Trust, Brand Image has a significant effect on Trust, then Trust also has a significant effect on Customer Loyalty, Service also has a significant effect on Customer Loyalty and so on. Brand Image which also has a significant effect on Customer Loyalty. it can be concluded that service can affect customer trust, as well as quality, price and brand image which also affects trust which then trust affects a customer's loyalty to a fast-food restaurant. The limitation of this study is that it only uses a limited object, and also hopes that further observations can consider invalid questions not to be used in further research but can add certain question variables in order to strengthen a variable. it is also suggested that further research can add a sample of fast-food restaurant brands to be studied and can also add the Perceived value variable as an intervening variable which then affects the dependent variable of Customer Loyalty.
REFERENCES
Alif Fianto, A. Y., Hadiwidjojo, D., Aisjah, S., & Solimun, S. (2014). The Influence of Brand Image on Purchase Behaviour Through Brand Trust. Business Management and Strategy, 5(2), 58. Retrieved from https://doi.org/10.5296/bms.v5i2.6003
Anwar, A., Gulzar, A., Sohail, F. Bin, & Akram, S. N. (2015). Impact of Brand Image, Trust and Affect on Consumer Brand Extension Attitude : the Mediating Role of Brand Loyalty. International Journal of Economics and Management Sciences, 1(5), 73-79. Retrieved from https://www.researchgate.net/profile/Amir-Gulzar/publication/285483638_Impact_of_brand_image_trust_and_affect_on_consumer_brand_extension_attitude_The_mediating_role_of_brand_loyalty/links/5a8c6346458515a4068ada0e/Impact-of-brand-image-trust-and-affect-on-consumer-brand-extension-attitude-The-mediating-role-of-brand-loyalty.pdf
Chinomona, R., & Sandada, M. (2013). Customer satisfaction, trust and loyalty as predictors of customer intention to re-purchase South African retailing industry. Mediterranean Journal of Social Sciences, 4(14), 437-446. Retrieved from https://doi.org/10.5901/mjss.2013.v4n14p437
Christoph F. Breidbach, R. B., & Hollebeek, L. (2014). Managing Service Quality Article. Managing Service Quality, 24(6), 592-611. Retrieved from https://doi.org/10.1108/MSQ-08-2013-0158
Hair, J. F., Howard, M. C., & Nitzl, C. (2020). Assessing measurement model quality in PLS-SEM using confirmatory composite analysis. Journal of Business Research, 109(November 2019), 101-110. Retrieved from https://doi.org/10.1016/j.jbusres.2019.11.069
Halim, P., Swasto, B., Hamid, D., & Firdaus, M. R. (2014). The Influence of Product Quality, Brand Image, and Quality of Service to Customer Trust and Implication on Customer Loyalty. European Journal of Business and Management, 6(29), 159-166. Retrieved from http://citeseerx.ist.psu.edu/viewdoc/download?doi=10.1.1.679.191&rep=rep1&type=pdf
Jalilvand, M. R., Samiei, N., & Mahdavinia, S. H. (2011). The Effect of Brand Equity Components on Purchase Intention : International Business and Management, 2(2), 149-158. Retrieved from http://flr-journal.org/index.php/ibm/article/view/j.ibm.1923842820110202.016
Kim, M. J., Chung, N., & Lee, C. K. (2011). The effect of perceived trust on electronic commerce : Shopping online for tourism products and services in South Korea. Tourism Management, 32(2), 256-265. Retrieved from https://doi.org/10.1016/j.tourman.2010.01.011
Kundu, S. (2018). Impact of trust on the relationship of e-service quality and customer satisfaction. EuroMed Journal of Business, 34(1), 1-5.
Kura, B. (2011). Eid:Determinants of E-Commerce Customer Satisfaction, Trust, and Loyalty in Saudi Arabia. Journal of Electronic Commerce Research, 12(1), 78-93. Retrieved from https://d1wqtxts1xzle7.cloudfront.net/52218718/12_1_p05-with-cover-page-v2.pdf?Expires=1644909293&Signature=FzgDfkpa6VeKP3JljBoFRy8KKHwX2A-XeMzEP9OW3NHkKpVydL8rd3s0ITzw6hat~s3mWtxgmmu5O7ROB2AAiSajHmoHZ6DzEaJw3X8uBnDM-yWWvJSrRTZ0UyR54gRwA0cGiRUfQ-pUUvfLIUl4MDeT-TDTC~j1V0qBbRt9BKAOoP9fW5s5eZdDogfrfMvTpSGVMnZB2ijo1EFpWGP92A9U4trELfMpsfEnmjfUae4FvdvIZW4qY93pbchh3jDZhuqqlTztCvBZcgb-8kkq8nLOlDpnciyO9btIM4bDOm5aPg-5jzbatxSN~isd4NeDZkuGy5Nw~yzCgQoq87bqqA__&Key-Pair-Id=APKAJLOHF5GGSLRBV4ZA
Lee, H. S. (2013). Major moderators influencing the relationships of service quality, customer satisfaction and customer loyalty. Asian Social Science, 9(2), 1-11. Retrieved from https://doi.org/10.5539/ass.v9n2p1
Lien, C. H., Wen, M. J., Huang, L. C., & Wu, K. L. (2015). Online hotel booking: The effects of brand image, price, trust and value on purchase intentions. Asia Pacific Management Review, 20(4), 210-218. Retrieved from https://doi.org/10.1016/j.apmrv.2015.03.005
Limakrisna, N., & Ali, H. (2016). Model of Customer Satisfaction : Empirical Study At Fast Food Restaurants in Bandung. International Journal of Business and Commerce, 5(06), 132-146. Retrieved from https://www.ijbcnet.com/5-6/IJBC-16-5615.pdf
Liu, C. T., Guo, Y. M., & Lee, C. H. (2011). The effects of relationship quality and switching barriers on customer loyalty. International Journal of Information Management, 31(1), 71-79. Retrieved from https://doi.org/10.1016/j.ijinfomgt.2010.05.008
Namin, A. (2017). Revisiting customers' perception of service quality in fast food restaurants. Journal of Retailing and Consumer Services, 34(June 2016), 70-81. Retrieved from https://doi.org/10.1016/j.jretconser.2016.09.008
Ogba, I., & Tan, Z. (2009). Exploring the impact of brand image on customer loyalty and commitment in China. Journal of Technology Management in China, 4(2), 132-144. Retrieved from https://doi.org/10.1108/17468770910964993
Setiawan, E. B., Wati, S., Wardana, A., & Ikhsan, R. B. (2020). Building trust through customer satisfaction in the airline industry in Indonesia: Service quality and price fairness contribution. Management Science Letters, 10(5), 1095-1102. Retrieved from https://doi.org/10.5267/j.msl.2019.10.033
Sirapracha, J., & Tocquer, G. (2012). Customer Experience, Brand Image and Customer Loyalty in Telecommunication Services. International Conference on Economics Business and Marketing Management, 29, 112-117. Retrieved from http://ipedr.com/vol29/21-CEBMM2012-Q00042.pdf
Slack, N. J., Singh, G., Ali, J., Lata, R., Mudaliar, K., & Swamy, Y. (2021). Influence of fast-food restaurant service quality and its dimensions on customer perceived value, satisfaction and behavioural intentions. British Food Journal, 123(4), 1324-1344. Retrieved from https://doi.org/10.1108/BFJ-09-2020-0771
Suhaily, L., & Darmoyo, S. (2017). Effect of product quality, perceived price and brand image on purchase decision mediated by customer trust (study on japanese brand electronic product). Jurnal Manajemen, 21(2), 179-194. Retrieved from https://doi.org/10.24912/jm.v21i2.230
Sumi, R. S., & Kabir, G. (2018). Factors affecting the buying intention of organic tea consumers of Bangladesh. Journal of Open Innovation : Technology, Market, and Complexity, 4(3). Retrieved from https://doi.org/10.3390/joitmc4030024
Woisetschläger, D. M., Lentz, P., & Evanschitzky, H. (2011). How habits, social ties, and economic switching barriers affect customer loyalty in contractual service settings. Journal of Business Research, 64(8), 800-808. Retrieved from https://doi.org/10.1016/j.jbusres.2010.10.007
Zena, P. A., & Hadisumarto, A. D. (2013). The Study of Relationship among Experiential Marketing, Service Quality, Customer Satisfaction, and Customer Loyalty. ASEAN Marketing Journal, 4(1), 37-46. Retrieved from https://doi.org/10.21002/amj.v4i1.2030
Zhou, T. (2011). An empirical examination of initial trust in mobile banking. Internet Research, 21(5), 527-540. Retrieved from https://doi.org/10.1108/10662241111176353
Zhou, T. (2012). Understanding users' initial trust in mobile banking: An elaboration likelihood perspective. Computers in Human Behavior, 28(4), 1518-1525. Retrieved from https://doi.org/10.1016/j.chb.2012.03.021
 This work is licensed under a: Creative Commons Attribution 4.0 International License
© Granthaalayah 2014-2022. All Rights Reserved.