
|
|
|
|
TOMATO LEAF DISEASE PREDICTION USING TRANSFER LEARNING
Niharika Saxena 1![]() , Dr. Neha Sharma 2
, Dr. Neha Sharma 2
1 M.E. Scholar, Electronics and Communication, Ujjain Engineering College, India
2 Professor, Electronics and Communication, Ujjain Engineering
College, India
|
|
|
ABSTRACT |
|
|
In India's
agricultural lands, tomatoes are the most widely planted vegetable crop. In
spite it can grow in warmer climates, certain climatic conditions and other
factors may contribute to the growth of the tomato plant. In addition to
these natural and man-made disasters, crop disease is a serious problem in
agricultural production leading to economic losses. Therefore, early
detection of disease can provide better results than current diagnostic
algorithms. As a consequence, in-depth computer-based learning methods may be
used to diagnose diseases early. This study carefully examines the disease
classification and diagnostic techniques used to diagnose tomato leaf
disease. The advantages and disadvantages of the methods provided are also
discussed in this study. Eventually, using hybrid deep- learning
architecture, this study provides a way to diagnose diseases early to
diagnose tomato leaf disease. |
|||
|
Received 20 April 2022 Accepted 25 May 2022 Published 21 June 2022 Corresponding Author Niharika
Saxena, DOI 10.29121/ijetmr.v9.i6.2022.1177 Funding: This research
received no specific grant from any funding agency in the public, commercial,
or not-for-profit sectors. Copyright: © 2022 The
Author(s). This work is licensed under a Creative Commons
Attribution 4.0 International License. With the
license CC-BY, authors retain the copyright, allowing anyone to download,
reuse, re-print, modify, distribute, and/or copy their contribution. The work
must be properly attributed to its author.
|
|||
|
Keywords: Artificial
Intelligence, Convolutional Neural Network (CNN), Deep Learning, Leaf
Disease, Crop Disease, Tomato Leaf |
|||

1. INTRODUCTION
Precision farming is the next step in the evolution of agriculture. Precision agriculture may boost agricultural output by combining science and technology. Precision farming also entails reducing pesticides and illnesses by accurately calculating the number of pesticides needed. Precision farming has improved several agriculture sectors as it transitions from conventional ways to new approaches. Precision farming's sole goal is to collect real-time data to increase agricultural yield and crop quality. Agriculture is much more than just a means of feeding the world's growing population. Plant diseases have also had a major impact on agricultural and forestry businesses. As a consequence, early detection and diagnosis of plant diseases are essential for immediate action Arjun (2013), Ferguson et al. (2007)
Different methods can be used to identify plant diseases. Certain illnesses, on the other hand, are difficult to detect early on. As a result, they will have to wait a little longer to learn what is going on. Advanced analysis, often performed with powerful microscopes, is required under these conditions. Furthermore, diseases disrupt the plant's entire life cycle, slowing its growth. Unfortunately, a slew of tomato diseases is decimating the crop's leaves. The main goal of this proposed study is to find a solution to the tomato leaf diagnostic problem using the simplest method possible while requiring fewer computer resources to achieve results compared to different high-quality techniques. Furthermore, automatic feature extraction is used to aid in the classification of input photos into sickness classifications. As a result, the proposed system achieved an average accuracy of 94-95 percent, demonstrating the neural network approach's viability even in difficult scenarios Hakkim et al. (2016)
Sensors and remote sensing, mapping, and surveying, high precision positioning systems, variable rates, the global navigation satellite system, automated steering systems mapping, computer-based applications, and other technologies are all used in precision agriculture. Precision agricultural concepts based on infrared variation analysis and treatment, on the other hand, are cutting-edge technologies. In other cases, the signals can only be detected in areas of the electromagnetic spectrum that are not visible. The goal of this study is to create a simple method that will help farmers identify tomato plant problems without having to consult an expert. We first obtain a picture from the Kaggle dataset, from which we extract characteristics. Then, to remove the attributes, we employ picture conversion and scaling. Finally, to diagnose diseases, the transfer learning inception v3 model will be used Chen et al. (1997), Adamchuk et al. (2004)
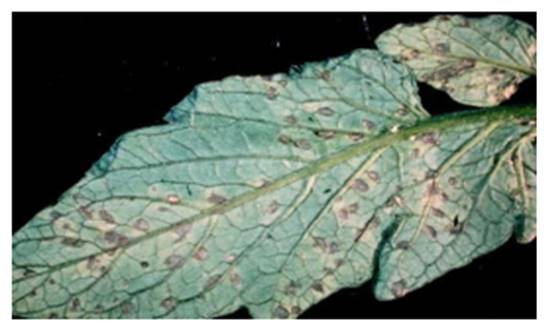
Figure 1
|
Figure 1 ILL
Tomato Leaf |
1.1. Image Processing in Precision Agriculture
Precision agriculture uses deep learning techniques, and its approach to crop protection effectively boosts crop development. Image analysis can be used to detect the sick leaf as well as to measure and locate the damaged area's border to properly identify the item. This study develops an improved deep learning system for determining the state of a tomato crop based on a photo of its leaves. We all know that the human brain recognizes images far faster than a computer.
However, the era has changed with the introduction of Machine Learning. A deep convolution neural network, a model capable of outperforming humans in a variety of domains, can ensure high performance on image recognition tasks.By certifying their work against Image Net, researchers have achieved advances in the field of visual recognition Njoroge et al. (2002)
2. SYMPTOMS OF TOMATO LEAF DISEASE
Analyzing different segmentation and feature extraction algorithms that may be used to diagnose plant illnesses using images of their leaves in their literature survey. Physically detecting plant illnesses is extremely tough due to time, understanding of plant diseases, and labor Khirade and Patil (2015)
Traditional procedures were ineffective and incorrect. As a result of several studies, image processing has been included for reliable disease diagnosis utilizing plant leaves. Look for different spots and patterns on plant leaves to detect the disease. The assumption of digital image processing for more accurate results represented a significant advancement. However, after consulting with a number of reputable IEEE, international conferences, and international journal publications in this field, it was discovered that none of them cure the plant ailment Patil et al. (2017)
Presented a practical application of digital image processing in agriculture for identifying and categorizing Brown Spots and frog eyes. They employ digital image processing to extract the form feature vector, which is then used to classify diseases using a K-NN classifier Shrivastava and Hooda (2014)
As a result of the illness, the plant's color, shape, and function may change. We'll go through the signs and symptoms of these illnesses, as well as what to check for if your plant's development appears to be slow. The appropriate classification and diagnosis of leaf diseases are crucial for reducing agricultural losses. Different plant leaves transmit different diseases and exhibit different symptoms.
2.1. Leaf Spot on Septoria
One of the most prevalent tomato plant leaf diseases is the Septoria leaf spot. A tiny, round patch with a greyish-white center and black borders is the first sign of this fungus' presence. In the center, tiny black specks may appear. When exposed to hot, humid conditions for an extended period, the leaves of sensitive tomato plants turn yellow, wither, and fall off.
2.2. Early Blight (Alternaria)
Alternaria is a parasite that causes tomato leaf spots and an early curse. Brown or dark regions with dim edges appear on the lower leaves, almost like an objective. The closure of the natural product stem is extremely sensitive, resulting in large, deep black spots with concentrated rings. A fungus causes this tomato plant disease, which appears after the plants have produced fruit.
2.3. Blight in the Late Stages
Phytophthora infestans appear in ideal, wet conditions following the growth season. Frost damage appears as uneven green-black splotches on plants. Fruits with large, irregularly shaped black areas are easily destroyed. This fungus, which causes tomato plant disease, also affects and has the potential to spread to potatoes. The identical precautions should be taken as with the septoria leaf spot.
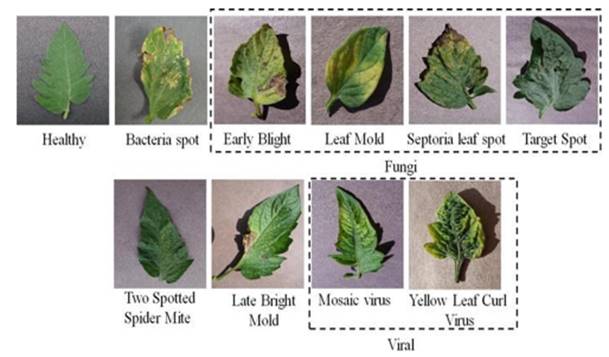
Figure 2
|
Figure 2
Tomato Healthy and Types of Disease |
3. RELATED WORKS
The results suggest that our approach may improve the accuracy of the tomato leaf data acquisition. The proposed name, based on the network leaf diagnostic model, comes from RDN which is inspiring in image processing activities. To adjust the architectural model, we have developed a separation model, which has gained greater accuracy than the advanced models.
We will try to study the Tomato website transfer for model equality on other plants because this model is suitable for a tomato data set. Improve integration skills. In the future, we hope to use this work in the workplace to make a small contribution to the development of agricultural development Zhou et al. (2021)
3.1. Transfer Learning
Transferring learning is the practice of reusing a previously learned model to do a different job; is widely used in deep learning because it allows deep neural networks to be trained with a small amount of data. It is very useful in data science because most real problems do not have many data points marked to train these complex models. Let’s take a look at the transfer reading, how
it works, why it is legal, and when it should be used. A few resources for trained to transfer learning models are included.
The general idea of learning by transferring the use of information obtained from multi-data projects is noted in situations where newly created data is available. Because naming data is expensive, it is important to use an existing database whenever possible. The main purpose of a typical machine learning model is to summarize abstract information based on designs taken from preparation data. You use transfer learning to begin this guessing encounter by using techniques you learned for a different goal. In fact, instead of starting the process of picking up a transition sheet (which is usually presented randomly), you start with designs designed to respond to another task to be done.
Learning success is both good and bad. Understanding these pitfalls is essential to successful AI applications. The transfer of information is only possible if 'necessary.' It is difficult to determine the best methods in this case, so you will need to try harder Cheng and Malhi (2017), Cheng et al. (2018)
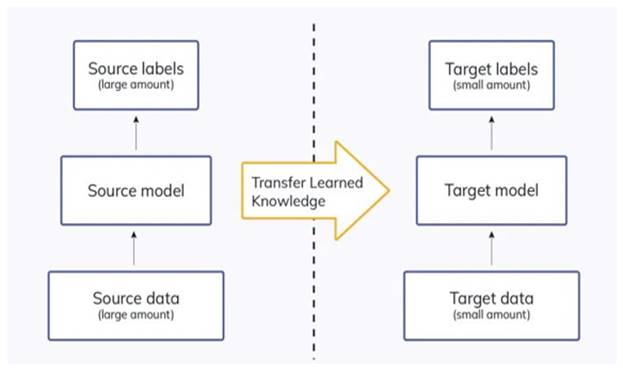
Figure 3
|
Figure 3
Model of Transfer Learning |
3.1.1. Basic Applications of Transfer Learning
Pre-trained models studied at ImageNet can be used for classification problems based on real- world images; this is accomplished by training the model in 1000 classes, which is one of the most widely used transfer learning techniques. For example, suppose you are creating software that predicts the type of flower that will bloom. You can use a pre-trained model to do so. Similarly, fragmentation of text requires an understanding of word presentations in a particular vector area but reading vector space from scratch is difficult and time-consuming. To improve, you can use pre-trained word embedding like GloVe. Transfer Learning Models are commonly used.
We will now look at some of the most widely used and widely used transfer learning models. Most of the models we will talk about later are used to classify images.
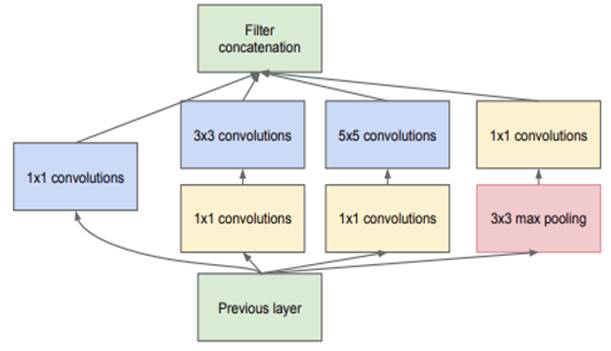
Szegedy proposed Inception microarchitecture in their 2014 Depth of Convolution work. All structures with size reduction appear as follows:
Figure 4
|
Figure 4.
Inception Model |
|
This module serves as a multi-level feature output by combining levels of convolution 11, 33, and 55. The structure of this model includes 1x1 Before being sent to the next layer of the network.
· The outcome of these filters is stacked close to the size of the channel. Convolution with 128 filters for measurement and reduction and line activation.
· Fully connected layer with 1024 units and optimized line functionality
· Seventy-seven percent drop-out rate.
· Loss of SoftMax as a separator in the linear layer This structure, formerly known as Google
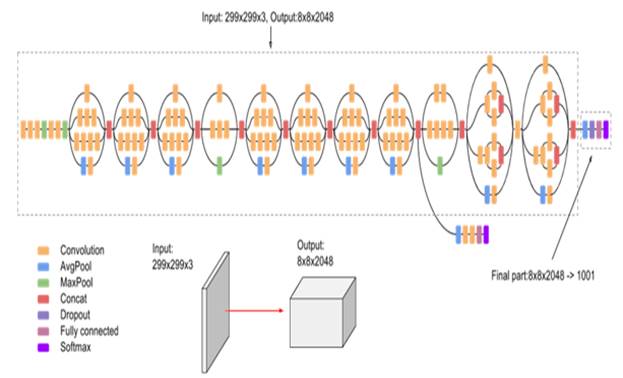
Net is now known as the start, and N refers to the version. Image Classifier Inception v3 for Large Categories:
Inception-v3, a 48-layer deep convolutional neural network, was trained using more than a million images from the ImageNet collection. The organization has also planned ahead of time to divide images into 1000 different objects, such as consoles, mice, pencils, and other analysts. As a result, the company has amassed a diverse collection of photographs from various films. The model collects common features in the included images in the first stage and classifies them using those features in the second section.
Inception v3 has been shown to achieve better than 78.1 percent accuracy and roughly 93.9 percent accuracy in the top 5 results on the ImageNet dataset. The model represents the result of several concepts explored over time by several scholars Pan and Yang (2009), Lazar and Rodolphe (n.d.)
Figure 5
|
Figure 5
Architecture of V3 Model |
Figure 6
|
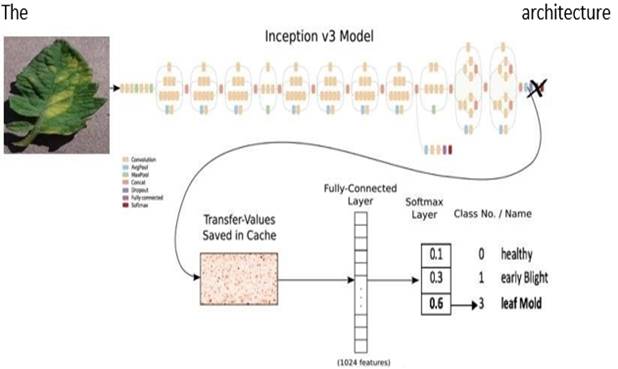
Figure 6 IlL
Leaf Detection Through Inception V3 |
3.2. Machine Learning
Machine learning is a subset of artificial intelligence. The system learns and improves without requiring any coding. Instead, it focuses on creating a computer programme that will allow the data collected to be used for self-study.
3.3. Deep Learning
Deep learning is a subset of machine learning that leads to discovering patterns with a large amount of data. Object detection in images, for example, is achieved by three or more layers of artificial sensory networks, each of which produces a large number of materials.
3.4. Neural Network
Develop a retrospective distribution system based on Neural Network feeds to diagnose and classify grapevine disease. For the diagnosis, the author used images of an intricate grape leaf on the back. Anisotropic diffusion is used to remove image noise before splitting using k-means clustering. Lastly, neural networks are used to view results. The results were tested on matrices of downy mildew and powdery mildew, as well as the author's claims of para-positive litigation and 100% false positives where only the color element was used Sannakki et al. (2013)
The computer model functions in the same way that neurons in the human brain do. Each neuron receives input, activates it, and transmits the findings to the next neuron.
3.5. Deep Convolution Neural Network
Convolutional Neural Network (CNN) is used to identify plant leaves. PCA removes and upgrades properties before uploading them to CNN. As a paradigm for processing information, the neural network was stimulated by the biological sensory system. It comprises of a large number of neurons, which are highly integrated components that produce a series of functions with real value. For example, when input is given, premature neurons are activated, and a weighted connection from previously functioning neurons activates other neurons. Depending on how neurons are employed and coupled, large causal chains and links between computational stages may be required.
Deep neural networks (DNNs) are neural networks with a large number of hidden layers. As a result of its growth, Deep Learning has made significant progress in image classification. Deep learning algorithms aim to learn the feature hierarchy automatically. At different degrees of deliberation, this self-learned component permits the framework to dissect complex contributions to yield planning capacities straightforwardly from getting to information without depending on human-made highlights Jadhav (2019), Mhatre and Lanka (2021)
3.6. How does CNN work?
Convolution, Neural Network layers include Convolution, ReLU Layer, pooling, Connected Fully, Flatten, and Normalization. The images will be compared episode by episode using CNN. An object is called a feature or filter. CNN uses a weight matrix to extract certain features from an embedded image without losing information about the image location organization. CNN adheres to the following layers:
3.6.1. Convolution Layer:
Aligns the element with the image before duplicating the pixel for each image with the element pixel. After completing the duplication of the related matrix, CNN adds and subtracts the result by the total number of pixels, creates a map, and places the filter value there. The element is then moved to all other locations in the image, and the output of the matrix is obtained. Next, the process is repeated in other filters. As a result, this layer redesigns the image filter everywhere you can think of. Lee et al. (2018)
3.6.2. RELU Layer:
ReLU is an acronym for the Rectified Linear Unit. All negative numbers in the filter images will be replaced with zero. The function activates a node only when the input is zero and the output is
zero. However, as the information grows, the alternative is line communication. As a result, increasing the amount of training improves the neural network.
3.6.3. Pooling Layer:
This layer reduces image size by extracting the maximum value from the filtered image and converting it to a matrix. It also helps to keep the overfit in place.
3.6.4. All Fully Connected Layer:
This is the end layer of CNN, and where the complete separation takes place. First, all of the filtered and compressed images are combined into a single list.
4. EXPERIMENT
4.1. Data Description
The database was created using a leaf image of a tomato plant, including healthy and uncluttered images of various stages Cotton Disease Dataset (2020b)
We use the Kaggle database as the basis for the evaluation of leaf health activity. The database is divided into two parts:
21,416 total photographs in the database, 18345 Test Total & Total Photographs for training. Data is divided into 80/20 scale, i.e., 80% training and 20% test samples used to train the deep neural network. The database allows machine learning researchers with new ideas to go directly to an important technical area without collecting or producing new data sets, allowing for direct comparisons and efficiency of previous work. The data collection is done using Leaf image, which includes healthy and unhealthy people of various classes. The data set is divided into two categories: One large group is used to train the deep neural network, and another sample is used to validate the model. Finally, a set known as the test set is used. All models and training are done by Kera with TensorFlow as an in-depth library using high GPUs like T4 and P100 and TPUs. Adam optimizer was used in all buildings, and the function of the loss was the function of the cross-entropy phase. We also used ReLU unlocking functions on all layers, except the compact storage layer.
4.2. Method of Evaluation
In this paper, we have built DCNN from scratch:
· Divide the database into two parts, namely, the training data set (1951 leaf IMG) and verification data (400 leaves img).
· Our DCNN model consists of a single input layer, multiple conv2D layers, 2 compact layers, and a single output layer with a few stop layers.
· In the training and certification database, the DCNN model is trained.
· After training, true-correct, false, accurate, false, the test set was recorded sequentially.
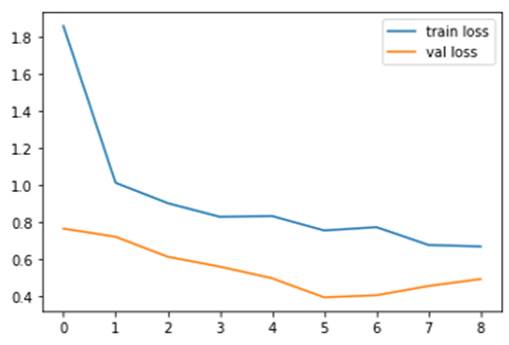
Figure 7
|
Figure 7 Training
vs CNN Model Verification Loss |
Figure 8
|
Figure 8
Training vs Loss of Verification DCNN Model |
4.3. Methodology
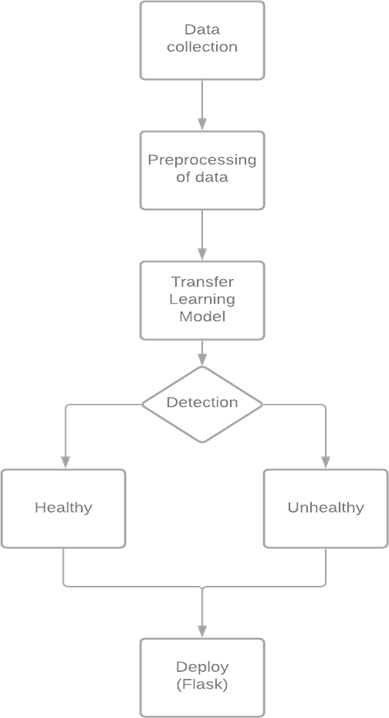
Figure 9
|
Figure 9 Proposed
Methodology |
4.4. Result Analysis and Discussion
Our job was to train the deep convolutional neural network (CNN) to identify and classify leaf images. We used the Lead Disease Dataset from Kaggle, which we selected in two categories [Sick Leaf, New Leaf], a data set that contains images of leaves in the form of frames from these two categories. The leaf of each category comes in different leaf images with different ideas.
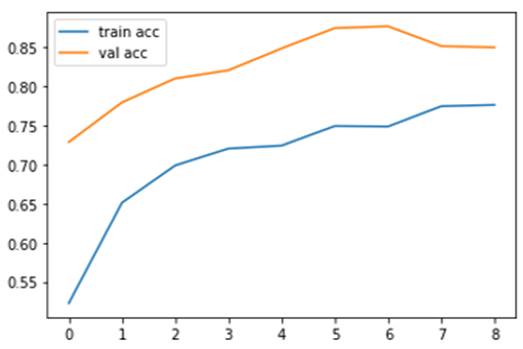
DL techniques continue to show great potential in increasing sensitivity and accuracy sensitivity, especially in temporary data. DCNN, on the other hand, can download features automatically, saving time and effort. Findings are reported once the model has been tested in the test database. The overall accuracy of the model is 81%.
When we build a model for the first time, the model tries to balance all the data which is why it has very low accuracy, so we re-create all the weighted data in your model so that the model can work redistribute the error and call the model period. continuously working with data and trying to increase accuracy and reduce data loss. The accuracy of our in-depth learning model clearly shows that as we extend the modeling period, there is increased accuracy.
The accuracy of our in-depth learning model clearly shows that the longer the modeling period, the greater the accuracy. The effect of model loss clearly shows that if we extend the model period, the loss decreases Lee et al. (2018), Hana et al. (2017)
5. CONCLUSIONS
We create segregation with our system by inserting our model into a flask that looks at the sick and infected leaves. The project has a few stops in getting leaves. So far, we have succeeded in eradicating the affected leaf disease. In the future, we will eliminate disease whether it is infested with microorganisms, fungi, or infectious substances, and determine the response of the farmer within the field. The project is aimed at identifying the affected leaf. This is achieved through the Convolutional Neural Network Algorithm. If the leaf is affected by the disease, then the information is shared by the system itself. This helps the grower to get healthy leaves in the field. This study aims to use a v3 learning implementation model that has previously been trained on a significant amount of data to diagnose tomato leaf disease automatically.
CONFLICT OF INTERESTS
None.
ACKNOWLEDGMENTS
None.
REFERENCES
Aarthi, R. & Harini, S. (2018). A Survey of Deep Convolutional Neural Network Applications in Image Processing. International Journal of Pure and Applied Mathematics, 118(7), 185-190.
Adamchuk, V. I. Hummel, J. W. Morgan, M. T. Upadhyaya, S. K. (2004). On-the-go soil sensors for precision agriculture. Computers and Electronics in Agriculture. 44, 71-91. https://doi.org/10.1016/j.compag.2004.03.002
Arjun, K. M. (2013). Indian agriculture status, importance, and role in the Indian economy. International Journal of Agriculture and Food Science Technology, 4(4), 343-346.
Chen, F. Kissel, D. E. Clark, R. West, L. T. Rickman, D. Laval, J. Adkin, W. (1997). Determining surface soil clay concentration at a field scale for precision agriculture, University of Georgia, Huntsville.
Cheng, P. M. & Malhi, H. S. (2017). Transfer learning with convolutional neural networks for classification of abdominal ultrasound images. Journal of digital imaging, Springer, 30(2), 234-243. https://doi.org/10.1007/s10278-016-9929-2
Cheng, P. Shaha, M. &Pawar, M. (2018). Transfer Learning for Image Classification. In Second International Conference on Electronics, Communication, and Aerospace Technology (ICECA), IEEE, 656-660. https://doi.org/10.1109/ICECA.2018.8474802
Cotton Disease Dataset. (2020b).
Devikar, P. (2016). Transfer Learning for Image Classification of various dog breeds, International Journal of Advanced Research in Computer Engineering and Technology (IJARCET), 5(12), 2707-2715.
Ferguson, R. Dobermann, A. and Schepers, J. (2007). Precision agriculture : site- specific nitrogen management for irrigated corn. University of Nebraska Lincoln Extension. Bulletin. 1-7.
Hakkim, V. M. A. Joseph, E. A. Gokul, A. J. A. Mufeedha, K. (2016). Precision Farming: The Future of Indian Agriculture. https://doi.org/10.7324/JABB.2016.40609
Hana, D. Liu, Q. & Fan, W. (2017). A New Image Classification Method Using CNN transfer learning and Web Data Augmentation, Expert Systems with Applications, Elsevier, 95, 43-56. https://doi.org/10.1016/j.eswa.2017.11.028
Jadhav, S. B. (2019). Convolutional neural networks for leaf image-based plant disease classification. IAES International Journal of Artificial Intelligence, 8(4), 328. https://doi.org/10.11591/ijai.v8.i4.pp328-341
Khirade, S. D. and Patil, A. B. (2015). Plant Disease Detection Using Image Processing. ICCUBEA International Conference on Computing, Communication, Control, and Automation is a biennial international conference on computing, communication, control, and automation, 768-771. https://doi.org/10.1109/ICCUBEA.2015.153
Larsen-Freeman, D. (2013). Transfer of Learning Transformed. Language Learning, 63, 107-129. https://doi.org/10.1111/j.1467-9922.2012.00740.x
Lazar, V. and Rodolphe, J. (n.d.). Fela Winkelmolen, and Cédric Archambeau. A Simple Transferlearning Extension of Hyperband. NeurIPS Workshop on Meta-Learning.
Lee, S. J. Chen, T. Yu, L. & Lai, C. H. (2018). Image classification based on the boost convolutional neural network. IEEE Access, 6, 12755-12768. https://doi.org/10.1109/ACCESS.2018.2796722
Mhatre, R. & Lanka, V. (2021). Cotton Leaves Disease Detection and Cure Using Deep Learning.
Njoroge, J. B. Ninomiya, K. Kondo, N. (2002). Automated fruit grading system using image processing, In Proceedings of the 41st SICE Annual Conference. 1346-1351.
Pan, S. J. and Yang, Q. (2009). A survey on transfer learning. IEEE Transactions on knowledge and data engineering, 22(10), 1345-1359. https://doi.org/10.1109/TKDE.2009.191
Patil, B. Panchal, H. Yadav, M. S. Singh, M. A. & Patil, M. D. (2017). Plant Monitoring using image processing, Raspberry Pi & IoT. International Research Journal of Engineering and Technology (IRJET), 4(10).
Sannakki, S. S. et al. (2013). Using neural networks to diagnose and classify grape leaf diseases. Fourth International Conference on Computing, Communications, and Networking Technologies (ICCCNT), 1-5.
Shrivastava, S. & Hooda, D. S. (2014). Automatic brown spot and frog eye detection from the image captured in the field. American Journal of Intelligent Systems, 4(4), 131-134.
Zagoruyko, S. and Komodakis, N. (2017). Paying more attention to attention : Improving the performance of convolutional neural networks via attention transfer. In International Conference on Learning Representations.
Zhou, C. Zhou, S. Xing, J. and Song, J. (2021). Tomato Leaf Disease Identification by Restructured Deep Residual Dense Network. IEEE Access, 9, 28822-28831. https://doi.org/10.1109/ACCESS.2021.3058947
|
|
 This work is licensed under a: Creative Commons Attribution 4.0 International License
© IJETMR 2014-2022. All Rights Reserved.