
|
|
|
|
CAPITAL ADEQUACY RATIO TESTING IN THE PERFORMANCE OF REGIONAL DEVELOPMENT BANKS (BPD) IN EASTERN INDONESIAMaximus Leonardo Taolin 1 1, 2, 3 Faculty of Economic and Business, University of Timor, Indonesia |
|
||
|
|
|||
|
Received 16 December 2021 Accepted 29 January 2022 Published 18 February 2022 Corresponding Author Maximus
Leonardo Taolin, maxtaolin@yahoo.com DOI 10.29121/ijetmr.v9.i2.2022.1106 Funding:
This
research received no specific grant from any funding agency in the public,
commercial, or not-for-profit sectors. Copyright:
© 2022
The Author(s). This is an open access article distributed under the terms of
the Creative Commons Attribution License, which permits unrestricted use, distribution,
and reproduction in any medium, provided the original author and source are
credited.
|
ABSTRACT |
|
|
|
This
study aims to examine the empirical models of BOPO, NPL, LDR and ROE mediated
by CAR, using PLS linear regression with the inner model of the warp3
algorithm, which tries to identify the relationship between latent variables
that follow the S curve. The results show the path coefficients and p-values
for each direct effect between variables that influence positive. The
relationship the BOPO and ROE shows a significant at 0.002, the relationship
the NPL and ROE shows a coefficient value, 0.182 which is significant at
0.046*, the LDR relationship to ROE shows a coefficient value, 0.048 which is
not significant at 0.276. The relationship BOPO and CAR shows a coefficient,
0.277 which is significant at 0.001***, the relationship between NPL and CAR
shows a coefficient, 0.289 which is significant at 0.009***, the relationship
between LDR and CAR variables shows a coefficient, 0.135 which is not
significant at 0.232. Meanwhile, the relationship between the CAR and ROE
shows a coefficient of 0.237, which is significant at 0.015**. The
results of the mediating effect of the indirect effect coefficient
BOPO→CAR→ROE is 0.066 with a p-value of 0.038 (p<5%) *.
explained that CAR is able to mediate the effect of BOPO on ROE. |
|
||
|
Keywords: 9 BPD (Indonesian Regional Development Banks), BOPO (Operational
Efficiency Ratio) NPL, LDR, ROE, and CAR 1. INTRODUCTION The COVID-19 pandemic
has caused the economy to become sluggish. The situation in the banking
sector affects all parties without exception. The banking sector is closely
related to the macroeconomic system, government monetary policy, fiscal
policy, government system, legal, political, social, and so on. Which if you
don't implement a control strategy, you will also be swept away in a crisis
of confidence as a result of the Covid 19 Pandemic. The Covid-19 pandemic
has caused banks to also experience a contraction in their financial
performance. Banking performance is highly dependent on its market share in
groups of business actors Sudana (2015). If this
pandemic continues for a long time, it will be very worrying for the economic
condition of the area where the Bank is located, making the eastern region
its niche market. In terms of Performance
and Banking Conditions when compared to the situation during the 1997-1998
Monetary Crisis and the pandemic. According to economic experts, Indonesian
banking conditions in the midst of the pandemic are still considered stable and
healthy when compared to the |
|
||


economic
crisis that occurred in 1997-1998. This comparison is very clear when comparing
the ratio of non-performing loans (NPL) for each period. Research Director of
the Center of Reform on Economics (Core) Indonesia Piter Abdullah said, in the
midst of the pandemic, the ratio of non-performing loans or non-performing
loans (NPL) of the Indonesian banking industry was still below 5 percent. which
reaches 50 percent.
This comparison can be proven by the
BPD (Indonesian regional development banks) financial performance report, until
December 2020, where the BPD experienced an increase, even when the national
banking sector experienced a decline, but on the other hand BPD (Indonesian
regional development banks) experienced a 5.15% growth in credit distribution,
while the national banking sector fell by 2.41%. (Report of the chairman of
Asbanda) In fact, when some banks provided financial reports that were in
difficult conditions, a number of BPDs even posted positive financial reports.
In the January 2020 period,
Indonesia's capital adequacy ratio (CAR) was 22.83%. This figure decreased in
the same period in 2019 which was 23.4%. Furthermore, in March 2020, the CAR
position was 21.67%. continued as of June 2020 the position of the Capital
Adequacy Ratio (CAR) was at the level of 22.59%. In this position, it seems
that bank capital in the country is still very strong where the capital
adequacy ratio (CAR) continues to increase during the Covid-19 pandemic. Based
on the circular letter of Bank Indonesia No.13/24/DPNP/2011, the Bank's Capital
Adequacy Ratio (CAR) is 8%, which means that if the bank has a CAR of more than
8%, the bank is in the good and safe category because it has a high level of
capital adequacy. good. So that in the context of the state of the country that
is being engulfed by the COVID-19 pandemic, Indonesia's banking capital
adequacy is still quite strong. Likewise, the position of the Capital Adequacy
Ratio (CAR) at Indonesian regional development banks (BPD) in 2019 was on
average 21.7%.
Based on the background, the problem
of this research is to test and analyze financial performance using
bank-specific financial ratios. The ratios used include capital adequacy ratio
(CAR), fixed assets to capital, non-performing productive assets, non-performing
loans (NPL), return on equity (ROE), net interest margin (NIM), operating
expenses to operating income (BOPO).), loan to deposit ratio (LDR)
2. MATERIAL DAN METODE
This study uses panel data of banking
companies operating in the Eastern region of Indonesia
from 2017 to 2020. There are 9 sample companies for 4 years of observation, so
the total is 32 times the performance sample. The data is sourced from the OJK
data center, www.idx.co.id which is secondary. The data archives in this study
are stored in documents including Financial Statements, Annual reports before the Covid period, and the Bank's
performance in the period I-IV 2017-2020.
Inferential statistical data analysis
includes correlation analysis between research variables, measuring and testing
the suitability of the overall model (Goodness
of Fit), evaluating variance (adjusted
R Squared), testing predictive relevance (Stone-Geiser), Testing effect size, testing influence between
variables / significance (P value) and
mediation test. Since all the variables in this study are manifest
variables, there is no need to test the validity or reliability of the data.
|
Table 1 Data Correlation Between Variables |
|||||
|
Korelasi |
ROE |
CAR |
BOPO |
NPL |
LDR |
|
ROE |
1 |
||||
|
CAR |
0.314 |
1 |
|||
|
BOPO |
0.227 |
0.169 |
1 |
||
|
NPL |
0.09 |
0.253 |
0.165 |
1 |
|
|
LDR |
-0.397 |
-0.155 |
-0.178 |
-0.135 |
1 |
|
P. value |
|||||
|
ROE |
1 |
||||
|
CAR |
<0.001 |
1 |
|||
|
BOPO |
0.009 |
0.052 |
1 |
||
|
NPL |
0.005 |
0.003 |
0.057 |
1 |
|
|
LDR |
<0.001 |
0.075 |
0.04 |
0.022 |
1 |
In the Table 1, it can be seen that BOPO is positively correlated with
CAR, with a correlation coefficient of 0.169 and significant is 0.052. then
positively correlated ROE with a correlation coefficient value of 0.314 and
significant at <0.001. BOPO is also positively correlated with NPL and LDR
but not significant. The CAR variable is positively correlated with the ROE
variable. (Significance value at <0.001), CAR variable with (significance
value at <0.009) and NPL variable with significance value at 0.040).
2.1. Goodness Of Fit test
Goodness of fit testing is carried
out to produce a research model that is in accordance with the original data.
According to Latan and Ghozali (2016) the results of the evaluation of the
suitability of this model will provide benefits for measuring the quality of
the model. The results of the model suitability test / goodness of fit are
presented in the following table.
|
Table 2 Goodness of Fit |
|||
|
Criteria |
Parameter |
Rule
of thumb |
resume |
|
Average
path coefficient (APC) |
0.177 |
Acceptable
P<0.05 |
accept |
|
P<0.001 |
|||
|
Average
R Squared (ARS) |
0.218 |
Acceptable
P<0.05 |
accept |
|
P=0.025 |
|||
|
Average
adjusted R Squared (AARS) |
0.191
P=0.047 |
Acceptable
P<0.05 |
accept |
|
Average
block VIF (AVIF) |
1.132 |
Acceptable
if ≤ 5 ideally ≤ 3.3 |
accept |
|
Average
Full Collinearity VIF (AFVIF) |
1.175 |
Acceptable
if ≤ 5 ideally ≤ 3.3 |
accept |
|
Tenenhaus
GoF (GoF) |
0.467 |
Small
≥ 0.1 Medium ≥ 0.25 Large ≥ 0.36 |
accept |
|
Sympson’s
paradox ratio (SPR) |
0.889 |
Acceptable
if ≥ 0.7. ideally=1 |
accept |
|
R
squared contribution ratio (RSCR) |
0.982 |
Acceptable
if ≥ 0.9. ideally=1 |
accept |
|
Statistical
suppression ratio (SSR) |
0.889 |
Acceptable
if ≥ 0.7 |
accept |
|
output Warp PLS 5.0 |
|||
The results of the goodness of fit
model test in the table above can be explained this research model has a good and acceptable fit value, where the P-Value APC, ARS < 0.005. Meanwhile, in
testing the multicollinearity problem between exogenous variables, the AVIF
value is 1.132 and the AFVIF value is 1.175 which 3.30 in this case means that
there is no multicollinearity between exogenous variables. Furthermore, the
size of the predictive power of the Tenenhaus GoF (GoF) model produces a value
of 0.467 (≥ 0.36) which means the predictive power of this model is very
strong and acceptable. In measuring the causality problem in the research model
with Sympson's paradox ratio (SPR), the resulting value of 0.889 (≥ 0.7)
is still acceptable because the ideal value is 1. Furthermore, to find out that
the research model is free from negative R squared contributions, it can be
seen from the R squared value. contribution ratio (RSCR) which produces a value
of 0.982 where 0.9 with an ideal value of 1.
The next test is the problem of the
impact of statistical suppression where a path coefficient has a large value
when compared to the path correlation relationship that connects two variables.
Testing the impact of statistical suppression problems resulted in a
Statistical suppression ratio (SSR) value of 0.889 0.7. this means that the
model is free from statistical suppression effect problems (Latan and Ghozali
2016). Looking at the results of the goodness of fit test, this research model
has a good fit. These results indicate the suitability of the model with the
support of available observational data.
2.2. Full Collinearity VIF test
Full Collinearity VIF test includes
vertical and lateral multicollinearity. (Solihin and Ratmono). Vertical or
classical collinearity is collinearity between predictor variables in the same
block, while lateral collinearity is collinearity between predictor variables
and criteria. Lateral collinearity was also used to test common methods bias.
In the Full Collinearity VIF test, the criteria must be lower than 3.3 (Kock
2013). The adjusted R squared test is used to explain the effect of certain
exogenous variables on endogenous variables whether they have a substantive
effect (Latan and Ghozali 2016). Meanwhile, the Q-squared test is used to
determine whether the model has predictive relevance or not (Latan and Ghozali
2016). The results of the Full Collinearity VIF, Adjusted R Squared and Q
Squared tests are presented in the following Table 3.
|
Table 3 Full Collinearity VIF Test |
|||||
|
BOPO |
NPL |
LDR |
CAR |
ROE |
|
|
Full Coll. VIF |
1.184 |
1.085 |
1.08 |
1.149 |
1.333 |
|
R Squared |
0.189 |
0.294 |
|||
|
Adj. R Squared |
0.167 |
0.261 |
|||
|
Q Squared |
0.196 |
0.29 |
|||
|
result output Warp PLS
5.0 |
|||||
Furthermore, to see whether the model
is free from problems of vertical, lateral collinearity and common method bias,
it can be seen based on the results of the full collinearity VIF test in the
table where the construct in this study is categorized as very good were based
on the rule of thumbs is < 3.3, which means the model is free from vertical
collinearity problems, lateral and common method bias. To see the variations
that affect CAR, it can be seen in the adjusted R squared value of 0.167 which
means that the effect of variations in BOPO, NPL, LDR is 16.7%, the remaining
83.3% is explained by other variables not included in this research model. If
you look at the rule of thumb for evaluating the structural model in this
study, it can be categorized as weak, where the adjusted R squared value of
0.167 is smaller than (≤ 0.25 weak category).
The adjusted R squared value for
variations in the effect of BOPO, NPL LDR on ROE of 0.261 or 26.1%, the
remaining 73.9% is explained by other variables not included in this research
model. If you look at the rule of thumb for evaluating the structural model in
this study, it can be categorized as moderate, where the adjusted R squared
value of 0.261 is greater than (> 0.25 moderate category).
As a reference for testing whether
the CAR variable has predictive relevance, it can be seen in the table above
that the value of Q squared is 0.196 (> 0) which means the model has
predictive relevance which if you look at the rule of thumb evaluation of the
structural model produced by the CAR variable is included in the moderate
category where (Q2 ≥ 0.15).
While the value of Q squared generated by the ROE variable is equal to (0.290
> 0) which means the model has predictive relevance. If you look at the rule
of thumb evaluation of the structural model, the ROE variable is included in
the moderate category where (Q2 ≥ 0.15).
2.3. Effect size and VIF test
The result of the output effect size is the absolute value of the individual contribution of each predictor variable on the R-Squared value of the criterion variable, the effect size shows the effect of the predictor variable in a practical point of view. Furthermore, the VIF test presents the results of vertical collinearity testing, namely between predictor variables, the value of VIF is presented for each criterion variable showing the level of collinearity or redundancy between predictor variables (Solihin and Ratmono). Furthermore, the results of the effect size and VIF test are presented in the table
|
Table 4 Effect Size dan VIF Test |
||
|
Path Description |
Effect
size |
VIF |
|
BOPO→ROE |
0.092 |
1.128 |
|
NPL→ROE |
0.096 |
1.097 |
|
LDR→ROE |
0,010 |
1.108 |
|
CAR→ROE |
0.085 |
1.293 |
|
BOPO→CAR |
0.072 |
1.002 |
|
NPL→CAR |
0.054 |
1.002 |
|
LDR→CAR |
0,018 |
1 |
|
output Warp PLS 5.0 |
|
|
3. RESULTS AND DISCUSSIONS
Based on the figure and table, it
shows the path coefficient and p value for each direct effect between variables
that have a positive effect. The relationship between the BOPO variable and ROE
shows a coefficient value, 0.218 which is significant at 0.002***, the
relationship between the NPL variable and ROE shows a coefficient value, 0.182
which is significant at 0.046*, the LDR variable relationship to ROE shows a
coefficient value, 0.048 which is not significant at 0.276. The relationship between
BOPO and CAR shows a coefficient value, 0.277 which is significant at 0.001***,
the relationship between NPL and CAR shows a coefficient value, 0.289 which is
significant at 0.009***, the relationship between LDR and CAR variables shows a
coefficient value, 0.135 which is not significant at 0.232. Meanwhile, the
relationship between the CAR variable and ROE shows a coefficient value of
0.237, which is significant at 0.015**.
|
Table 5 Result Significance Test Between Variables |
||
|
Path Description |
Path
Coefficient |
Sig.
(p-value) |
|
BOPO→ROE |
0.218 |
0.002** |
|
NPL→ROE |
0.182 |
0.046** |
|
LDR→ROE |
0.048 |
0.276 |
|
CAR→ROE |
0.237 |
0.015** |
|
BOPO→CAR |
0.277 |
<0.001*** |
|
NPL→CAR |
0.289 |
0.009** |
|
LDR→CAR |
0.135 |
0.232 |
|
output Warp PLS 5.0 |
||
This study followed the procedure as
in the formulation and stages of mediation testing proposed by (Hair 2013).
Sobel (1986), Baron Kenny (1986), Preacher and Hayes (2004). Testing the
indirect effect of BOPO, NPL, LDR on ROE through CAR as a mediator. The results
of the indirect test (indirect effect) and the total effect can be presented in
the figure and table
|
|
|
Figure 1 And
Model Result WarpPLS 5.0 |
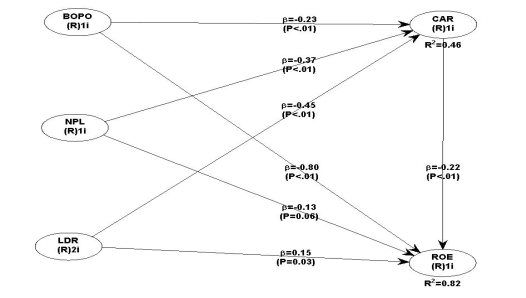
Based on the table presented on the
mediation effect, the indirect effect coefficient for testing the
BOPO→CAR→ROE mediation hypothesis is 0.066 with a p-value of 0.038
(p<5%) *. These results explain that CAR is able to mediate the effect of
BOPO on ROE. In testing the direct path relationship between BOPO and ROE, it
is significant at (0.002 < 1) ***. While the direct relationship path of
BOPO to CAR is significant at (0.001 < 1%) ***. Similarly, the direct
relationship path of CAR to ROE is (0.002 < 1%) *** (Gudono 2016)
|
Table 6 Indirect
Effect and Total Effect BOPO, NPL dan LDR to ROE Through CAR |
||
|
Indirect effect |
Path Coefficient |
Sig. (P value) |
|
BOPO→CAR→ROE |
0.066 |
0.038* |
|
NPL→ CAR→ROE |
0.069 |
0.044* |
|
LDR→ CAR→ROE |
0.032 |
0.149 |
|
Total effect |
Path Coefficient |
Sig. (P value) |
|
BOPO→CAR→ROE |
0.284 |
<0.001 |
|
NPL→ CAR→ROE |
0.250 |
0.005 |
|
LDR→ CAR→ROE |
0.080 |
0.018 |
|
output Warp PLS 5.0 |
||
4. CONCLUSIONS AND RECOMMENDATIONS
The empirical research model in this
study is financial variables and ROE mediated by CAR, using PLS linear
regression with the inner model of the warp3 algorithm, which tries to identify
the relationship between latent variables that follow the S curve. WarpPls 5.0
was chosen because in this study it has a model that tested the mediating
effect of three variables, namely BOPO, NPL, and LDR.
The results of WarpPls 5.0 can provide an explanation through the output of path coefficients either directly or indirectly. The results of the data processing show the path coefficient and p value in each direct effect between variables that have a positive effect. The relationship between the BOPO variable and ROE shows a coefficient value, 0.218 which is significant at 0.002***, the relationship between the NPL variable and ROE shows a coefficient value, 0.182 which is significant at 0.046*, the LDR variable relationship to ROE shows a coefficient value, 0.048 which is not significant at 0.276. The relationship between BOPO and CAR shows a coefficient value, 0.277 which is significant at 0.001***, the relationship between NPL and CAR shows a coefficient value, 0.289 which is significant at 0.009***, the relationship between LDR and CAR variables shows a coefficient value, 0.135 which is not significant at 0.232. Meanwhile, the relationship between the CAR variable and ROE shows a coefficient value of 0.237, which is significant at 0.015**.
The results of the mediation effect test in the indirect effect coefficient table for testing the BOPO→CAR→ROE mediation hypothesis is 0.066 with a p-value of 0.038 (p<5%) *. These results explain that CAR is able to mediate the effect of BOPO on ROE. In testing the direct path relationship between BOPO and ROE, it is significant at (0.002 < 1) ***. While the direct relationship path of BOPO to CAR is significant at (0.001 < 1%) ***. Likewise, the path of the direct relationship between CAR and ROE is (0.002 < 1%) *** (Gudono 2016).
REFERENCES
Arifin, Zaenal (2007). Teori keuangan dan pasar Modal. Yogyakarta : Ekonesia Kampus Fakultas Ekonomi UII.
Brigham, Eugene F, dan Michael C Ehrhardt (2011). Financial Management : Theory and Practice Vol. 13a, e : Shouth Westren.
Brigham, Eugene F., dan Joel F. Houston (2009). Fundamentals of Financial Management, 12th edition. Vol. 12. South-Western Cengage Learning 5191 Natorp Boulevard Mason, OH 45040 USA : South-Western, a part of Cengage Learning.
Chen, Su-Jane, et al. (2017). "Financial performance of Chinese airlines : Does state ownership matter ?" Journal of Hospitality and Tourism Management no. 33 :1-10. Retrieved from https://doi.org/10.1016/j.jhtm.2017.08.001
Dyson, John R (2010). "Accounting_for_Non-Accounting_Students." In, edited by 8th. England: Pearson Education Limited Edinburgh Gate Harlow Essex CM20 2JE England.
Hartono, Jogiyanto (2008). Teori Portofolio dan analisis investasi. cetakan kelima vols. Jogyakarta : BPFE fakultas ekonomika dan Bisnis UGM.
Horne, James C. Van, dan Jr. John M. Wachowicz (2009). Fundamentals of Financial Management. Vol. 13e. England: Pearson Education Limited Edinburgh Gate Harlow Essex CM20 2JE England and associated Companies throughout the world.
Ikhwa, Nuzul (2006). "Analisis ROA dan ROE Terhadap Profitabilitas Bank Di Bursa Efek Indonesia." Al Masraf : Jurnal Lembaga Keuangan dan Perbankan no. 1 (2).
Sudana, I Made (2015). Teori dan Praktik Manajemen Keuangan Perusahaan, 2. Jakarta Erlangga
Zvi, Bodie, et al. (2008). Investment. Vol. Seventh Edition : McGraw-Hill International Edition
|
|
 This work is licensed under a: Creative Commons Attribution 4.0 International License
© IJETMR 2014-2022. All Rights Reserved.