
|
|
|
|
CRIME RATE PREDICTION AND ANALYSIS USING LSTM ALGORITHM
Dr. D J Samatha Naidu 1, K. Yamini Priya 2![]()
![]()
1 Department
of MCA, Annamacharya PG College of Computer Studies,
Andhra Pradesh, India
2 Department
of MCA, Annamacharya PG College of Computer Studies,
Andhra Pradesh, India
|
|
|
ABSTRACT |
|
|
Crime occurs
when a motivated individual encounters a vulnerable target without effective
protection, as explained by Routine Activity Theory. Rational Choice Theory
suggests that criminals make decisions after considering the potential risks,
effort, and benefits. These theories are combined in Crime Pattern Theory,
which highlights how offenders tend to choose crime locations based on their
familiarity with the area, using their "cognitive maps." This leads
to the development of crime hotspots in areas that either generate or attract
criminal opportunities, influenced by past criminal activity and the
surrounding environment. The proposed crime prediction system employs machine
learning algorithms, including Random Forest, KNN, SVM, and LSTM. These
models are initially trained using only historical crime data to determine
the most effective algorithm. Subsequently, environmental factors like road
density and points of interest (POI) are incorporated to evaluate whether
prediction accuracy improves. KNN categorizes data by identifying the closest
data points based on input features, using either a majority vote or a
weighted voting system. Naive Bayes (NB), on the other hand, predicts
outcomes using probabilities and assumes that input features are independent
of each other, making it a straightforward yet useful classification
technique. |
|||
|
Received 15 January 2025 Accepted 20 February 2025 Published 22 March 2025 Corresponding Author K. Yamini
Priya, a.belal@seu.edu.sa DOI 10.29121/ijetmr.v12.i3.2025.1554 Funding: This research
received no specific grant from any funding agency in the public, commercial,
or not-for-profit sectors. Copyright: © 2025 The
Author(s). This work is licensed under a Creative Commons
Attribution 4.0 International License. With the
license CC-BY, authors retain the copyright, allowing anyone to download,
reuse, re-print, modify, distribute, and/or copy their contribution. The work
must be properly attributed to its author.
|
|||
|
Keywords: Crime, Routine
Activity Theory, Rational Choice Theory, Crime Pattern Theory, Crime
Hotspots, Machine Learning, Random Forest, KNN, SVM, LSTM, Naive Bayes, Crime
Prediction, Historical Crime Data, Environmental Factors, Road Density,
Points of Interest (POI), Cognitive Maps, Vulnerable Target, Motivated
Individual, Effective Protection |
|||


1. INTRODUCTION
The volume of spatiotemporal data related to public safety has surged dramatically in recent years; however, much of this information remains untapped for practical problem-solving. To support crime prevention efforts, researchers have developed various crime prediction models, with a predominant focus on leveraging past crime data to enhance accuracy. Contemporary crime prediction research centers on two main areas: predicting areas of crime risk and forecasting crime hotspots.
Crime risk area prediction explores the relationship between criminal activity and environmental determinants, grounded in "routine activity theory." Traditional methods for assessing crime risk typically identify hotspots based on historical patterns, assuming the continuation of these trends. For example, a terrain risk model combines environmental crime-related factors with historical crime data to produce long-term, stable predictions of crime hotspots. Numerous studies have examined crime prediction across varying timeframes by integrating demographic and economic data, land use information, mobile phone records, and historical crime reports. Conversely, crime hotspot prediction aims to pinpoint potential locations for future criminal incidents and identify clusters where crime is likely to concentrate. Kernel density estimation is a commonly employed technique for this purpose. Models that consider spatial or temporal autocorrelation in past crimes generally achieve higher performance than those that disregard these dependencies. Recently, machine learning methods have gained prominence in crime prediction, with popular techniques including K-Nearest Neighbor (KNN), Random Forest, Support Vector Machine (SVM), neural networks, and Bayesian models.
Several studies have benchmarked different methodologies: some have evaluated linear models for crime trend forecasting, while others have compared Bayesian models with BP neural networks. Further comparisons have been made between the spatiotemporal kernel density method and the Random Forest algorithm across various crime prediction periods. Among these approaches, KNN is valued for its efficiency in supervised learning. SVM is broadly utilized for its versatility in handling classification, regression, and anomaly detection. The Random Forest algorithm has demonstrated robust nonlinear data processing capabilities and high predictive accuracy in diverse applications.
Naïve Bayes (NB), a traditional classification algorithm, is recognized for its simplicity, low parameter requirements, and resilience to missing data. Convolutional Neural Networks (CNNs) offer scalability and improved feature representation, making them suitable for complex classification problems. Long Short-Term Memory (LSTM) networks excel at capturing temporal patterns, rendering them particularly effective for analyzing data with strong time-dependent trends. This study aims to compare these six machine learning algorithms and recommend the most effective one, assessing its predictive accuracy both with and without the inclusion of additional influencing variables.
2. MATERIALS AND METHODS
1) CONCEPTS
OF THEORETICAL CRIMINOLOGY IN FORECASTING CRIME HOTSPOTS
Predicting crime hotspots focuses on anticipating areas where criminal activity is likely to concentrate, guided by criminological theories that explain how location influences crime patterns. These theories inform law enforcement's use of hotspot data for crime prevention. Key theories supporting situational crime prevention include routine activity theory, rational choice theory, and crime pattern theory.
Routine activity theory, initially proposed by Cohen and Felson in 1979 and subsequently refined, posits that predatory crimes occur when a motivated offender, a suitable target, and the absence of effective guardianship converge in time and space.
Rational choice theory, developed by Cornish and Clarke, suggests that offenders make calculated decisions regarding crime locations, targets, and methods, weighing effort, risk, and potential reward.
Crime pattern theory synthesizes routine activity and rational choice theories to explain the spatial distribution of crime. It proposes that individuals develop "cognitive maps" and "activity spaces" through daily routines. Offenders utilize these maps to identify familiar locations with criminal opportunities, preferring to operate in known areas rather than unfamiliar ones.
Crime hotspots emerge due to their tendency to either generate or attract criminal activities. Therefore, effective prediction requires considering environmental factors alongside historical crime data.
2) BUILT
ENVIRONMENT DATA
Research consistently demonstrates a strong link between urban design and crime rates, suggesting that the built environment influences criminal behavior by shaping opportunities for crime. The 2007 UN-HABITAT Global Report on Human Settlements highlighted the significant role of built environment elements in the occurrence of criminal acts. Modern crime prediction models are increasingly incorporating Points of Interest (POI) data and road network density as key influencing factors.
·
POI DATA
Urban infrastructure datasets, specifically Points of Interest (POIs), provide location and characteristic information about various city amenities. Businesses like restaurants, shopping centers, and retail outlets tend to cluster in areas with significant pedestrian activity and accessible transit, which, while beneficial for commerce, can also attract a wide range of individuals, potentially increasing the risk of criminal activity. Similarly, entertainment venues are often associated with elevated crime rates. These POI attributes are used as predictive variables within crime forecasting models.
·
ROAD NETWORK DENSITY
Road network density, typically calculated as the total length of roads within a specific area divided by that area, is a key factor in urban analysis. Regions with higher road densities generally experience increased human traffic, which can include both potential crime victims and perpetrators. Studies have indicated a correlation between road network density and crime rates, especially in public settings.
3) CRIME
PREDICTION WITH MACHINE LEARNING ALGORITHMS
Traditional crime hotspot detection often relies on historical crime data, assuming past trends will persist [7, 2]. This approach is generally effective for long-term, stable hotspot identification. Kernel Density Estimation (KDE) is a common method for this purpose, with temporal autocorrelation enhancements improving its accuracy over standard KDE. However, machine learning approaches, such as Random Forest, have demonstrated superior performance over spatiotemporal KDE, particularly at finer temporal and spatial scales [12]. Recent research by Gabriel et al. [39] employed a Gated Localized Diffusion Network for street-level crime prediction, achieving significantly higher accuracy compared to network-time KDE. Machine learning's ability to model complex, non-linear relationships has proven valuable in crime prediction. These algorithms offer advantages like faster training, the capacity to handle high-dimensional data, and effective feature extraction.
3. PREDICTION MODEL
This research investigates crime prediction using four machine learning techniques: Random Forest, K-Nearest Neighbors (KNN), Support Vector Machines (SVM), and Long Short-Term Memory (LSTM). In the initial phase, the models are trained exclusively on historical crime data to identify the optimal predictive algorithm. Subsequently, the study examines the impact of incorporating built environment factors—specifically road network density and Points of Interest (POI)—as additional input variables to determine if these covariates improve prediction performance.
1) KNN
KNN classifies a new data point based on the classes of its k-nearest neighbors in the training dataset. Distances between the new point and training data are calculated using their feature vectors. The class assigned is determined by majority vote (or weighted vote by distance) among the k nearest neighbors. When k=1, the new point is assigned the class of its single nearest neighbor.
2) RANDOM
FOREST
A random forest employs an ensemble of regression trees, each generated using the CART algorithm without pruning. The forest's prediction, denoted as h(x, k), is derived from these individual trees, where 'x' signifies the input features and 'k' represents a randomly generated vector following a consistent distribution. The final classification is achieved through a majority voting process across all trees. Randomness is a key aspect of random forests, introduced via two mechanisms: firstly, by creating diverse training sets through bootstrap aggregating (bagging), and secondly, by randomly selecting a subset of features for each node's split. Specifically, if the dataset contains 'M' total features, a subset 'F' is defined. At each internal node, 'F' features are randomly chosen from the 'M' available features, and the node is split based on the optimal split among these selected 'F' features. The forest's ultimate classification is then determined by the aggregated decisions of these varied decision trees.
3) SVM
Support Vector Machines (SVMs), rooted in principles of statistical learning, are powerful tools for data mining. They demonstrate effectiveness across diverse applications, encompassing regression tasks like time series analysis and pattern recognition challenges such as classification and discriminant analysis. The fundamental operation of an SVM involves identifying the most effective classification hyperplane. This hyperplane is chosen to meet classification objectives while simultaneously maximizing the separation margin between data points on either side. Ideally, SVMs can provide optimal classification outcomes for datasets that are linearly separable.
4) NB
Bayesian theory, a cornerstone of probability and statistics, provides a framework for estimating the probability of an event by incorporating prior knowledge or evidence. The Naïve Bayes classifier, a popular machine learning algorithm, leverages this theory for classification tasks. It simplifies the calculations by assuming that the features contributing to a classification are mutually independent.
5) CNN
For sequential data prediction, Convolutional Neural Networks (CNNs) utilize one-dimensional convolutions. This process entails sliding a fixed-size kernel across the input sequence, computing weighted sums of the discrete values within the kernel's window. This sliding operation generates a transformed sequence. To further refine the extracted features, CNNs often incorporate pooling layers, which selectively emphasize the most salient characteristics within the convolved output.
6) LSTM
Long Short-Term Memory (LSTM) networks are a specialized form of recurrent neural network (RNN) architecture. A distinguishing characteristic of LSTMs is the incorporation of a memory cell, which facilitates the acquisition of contemporary data and the identification of meaningful data correlations for efficient information propagation. The memory cell's ability to mitigate information decay makes LSTMs well-adapted for deep neural network processing. Each memory cell operates with three control mechanisms: the input gate (i_t), the forget gate (f_t), and the output gate (o_t).
4. EVALUATION INDICATOR
By assessing the prediction outcomes of various machine learning models both with and without covariates, the following metrics are employed for evaluation. One such metric is the Hit Rate, which measures the accuracy of crime predictions. The Hit Rate includes two main components: Grid Hit Rate and Case Hit Rate. The Grid Hit Rate (HitRa) specifically refers to the ratio of correctly predicted hotspot grids to the total number of actual hotspot grids.
Here, A represents the total number of actual hotspot grids, while a denotes the total number of correctly predicted hotspot grids. The Case Hit Rate (HitRn) refers to the ratio between the actual number of cases in the correctly predicted hotspot grids and the total number of cases in the study area during that period. A higher value of HitRn indicates that more cases are included in the predicted hotspot grids, leading to a more accurate prediction.
Here, n represents the total number of cases in the study area, and N indicates the actual number of cases within the predicted hotspot grids. In addition to the Hit Rate metrics, the Prediction
Accuracy Index and Hit Efficiency Index (HitEn) can also be used to assess the model's prediction performance. For grids within a given period, as the number of predicted grids increases, more grids are covered. When the total number of predicted grids equals the total number of grids, the value of HitRn reaches 1.
In this case, while the value of HitRn may be high, it does not necessarily indicate a good prediction effect. Therefore, the HitEn (Hit Efficiency Index) is used to evaluate the model's prediction effectiveness. A higher HitEn value indicates that more cases are covered with fewer predicted grids, signifying better prediction efficiency.
Here, a represents the number of predicted hotspot grids, and A denotes the actual number of hotspots.
5. EXPERIMENTAL AREA AND DATA VISUALIZATION ANALYSIS
1) EXPERIMENTAL
AREA
The study area, designated as XT, is situated within a major coastal city in Southeast China. This urban community exhibits a high population density, encompassing approximately 6.5 square kilometers and housing an estimated 400,000 residents. Notably, only 50,000 are registered local residents, indicating a substantial presence of internal migrants or non-local inhabitants. The area is characterized by several large, densely populated urban villages. This intricate mix of built environment and diverse population contributes to elevated crime rates.
2) SELECTION
OF CRIME TYPES
Crimes against property in public areas, motivated by the intent to seize another's belongings, encompass offenses like theft, robbery, and snatching. Predicting hotspots for these crimes in this town is crucial for effective policing. Accurate predictions enable proactive resource allocation, shifting from reactive responses to preventative measures, thereby enhancing public safety.
3) DATA
VISUALIZATION ANALYSIS
The study utilized historical crime data from 2015 to 2018, obtained by the police from the P-GIS database of the Public Security Bureau within the experimental district. Text coordinate information was extracted from this database, and case point data was then isolated for the specific street range within the study area by mapping it. “To effectively address practical policing needs, the researchers aimed for a small spatial scale in their crime hotspot prediction experiments. Following a calculation formula for gridding study areas, the area was divided into 150m x 150m grids. This grid size was selected after investigating actual police work and analyzing the data distribution of the case points. The 150m grid size concentrates case points, reduces the randomness of hotspot grids, clarifies the patterns of cases, and improves the accuracy of crime hotspot predictions. The 150-meter grid aligns with the maximum patrol area a single officer can cover in a set timeframe, enhancing the practical application of the prediction results for crime prevention.
6. Results and Discussion
1) Improved
Accuracy:
Long Short-Term Memory (LSTM) networks have shown improved precision in crime rate forecasting compared to conventional approaches. This enhanced performance stems from LSTM's aptitude for recognizing extended temporal relationships within sequential data, a vital factor in discerning crime trends.
2) Time
Series Analysis:
Leveraging the temporal dependencies inherent in crime patterns, Long Short-Term Memory (LSTM) networks facilitate the analysis of time series data. This capability permits the forecasting of future crime rates by examining past trends, thereby empowering law enforcement to proactively identify potential high-crime areas and optimize resource deployment.
3) Crime
Type and Location Prediction:
Utilizing LSTM models allows for the forecasting of crime trends, going beyond simple rate predictions to include the categorization of crime types and their spatial distribution. This detailed predictive power enables the development of targeted intervention plans customized for particular high-risk locations and crime classifications.
4) Benefits
for Law Enforcement:
By forecasting crime occurrences and pinpointing high-risk areas, police departments can optimize resource distribution, refine preventative measures, and bolster community security.
5) Limitations:
LSTM models, similar to other machine learning models, have constraints. They typically need substantial training data and may produce inaccurate predictions, particularly when there are abrupt shifts in crime patterns.
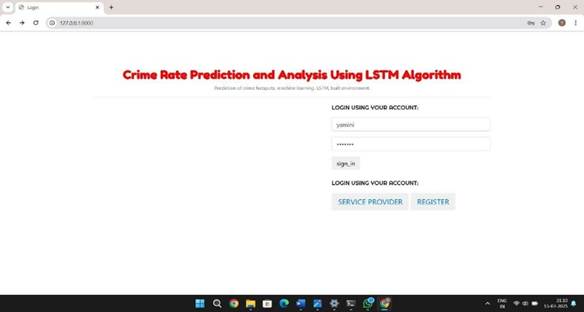
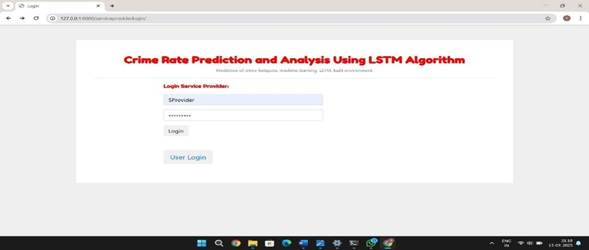
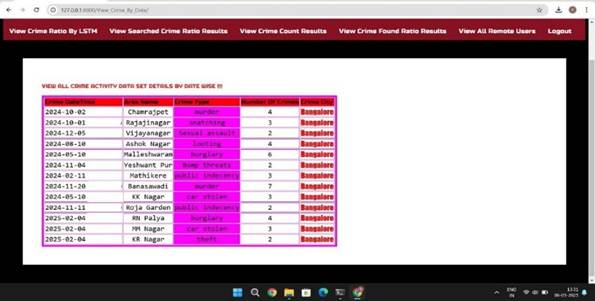
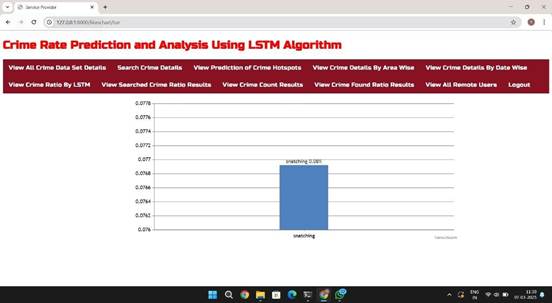
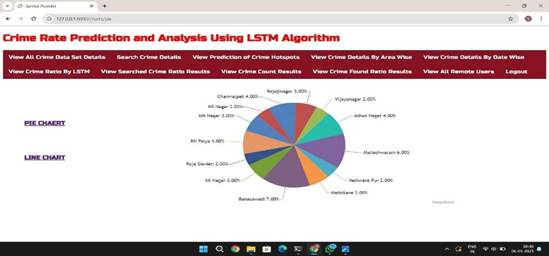
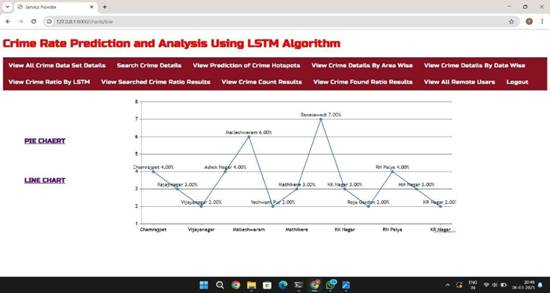
Fig Crime Rate Prediction and Analysis Using LSTM Algorithm
7. CONCLUSION
This study explores the application of six distinct machine learning techniques to forecast crime hotspots within a town located in a southeastern coastal city of China. The findings indicate that:
(1) The Long Short-Term Memory (LSTM) model demonstrates superior predictive performance compared to the other algorithms, effectively discerning trends and patterns within the historical crime records. (2) Integrating urban built environment factors significantly improves the LSTM model's predictive accuracy, achieving better results than relying solely on past crime data. The models developed in this research exhibit enhanced predictive capabilities relative to previous studies. For instance, Rummens et al. utilized historical crime data at a 200m x 200m grid scale, employing logistic regression, neural networks, and hybrid models [41]. While the generalizability of these results requires further validation across diverse geographical contexts, the outcomes have proven valuable in a recent crime hotspot prevention initiative undertaken by the local police.".
CONFLICT OF INTERESTS
None.
ACKNOWLEDGMENTS
None.
REFERENCES
Chainey, D. L., & Ratcliffe, G. (2013). GIS and Crime Mapping (2nd ed.). John Wiley & Sons.
|
|
 This work is licensed under a: Creative Commons Attribution 4.0 International License
© IJETMR 2014-2025. All Rights Reserved.