
|
|
|
|
OPTIMAL SIZING AND OPERATION OF HYBRID POWER SYSTEMS CONSIDERING THE BATTERY CAPACITY DEGRADATION LIMITATIONS
Musa Terkes 1![]() , Alpaslan Demirci 1
, Alpaslan Demirci 1![]()
1 Research
Assistant, Electrical Engineering, Yildiz Technical University, Turkey
|
|
|
ABSTRACT |
|
|
Evaluating
clean energy alternatives in hybrid power systems (HPS) is critical within
sustainable development and zero-carbon policies. Considering the
synchronization issues between energy generation and consumption, determining
the optimal operating performance of battery energy storage systems (BESS)
will likely increase support and interest in HPS investments. In this study,
HPSs using shared BESSs for prosumers in a common bus distribution network
are optimally sized with a minimum cost objective in a multi-year sensitivity
analysis. Most importantly, the optimal C-rate and maximum depth of discharge
(DODmax) operation are determined to match the supply-demand
balance and maximize the HPS benefit at lower end-of-life (EOL) limits. The
impact of increases in EOL limits on the technical, economic, and
environmental feasibility of HPS and BESS aging is also evaluated. At the
same time, all operations are performed considering four different
sub-degradation models using the Arrhenius strategy and Rainflow Counting
algorithm. The results show that increasing the C-rate reduces CO2
by up to 19% while increasing BESS equivalent cycles and cycling degradation
by 28.26% and 10%, respectively. HPS performance is maximized based on
optimum BESS operating at 80% DODmax. Based on the obtained
results, it is also emphasized that the impact of BESS operating performance
on HPS feasibility and aging analysis will be valuable for many stakeholders. |
|||
|
Received 10 August 2023 Accepted 12 September 2023 Published 30 September 2023 Corresponding Author Musa
Terkes, musa.terkes@yildiz.edu.tr DOI 10.29121/ijetmr.v10.i9.2023.1368 Funding: This research
received no specific grant from any funding agency in the public, commercial,
or not-for-profit sectors. Copyright: © 2023 The
Author(s). This work is licensed under a Creative Commons
Attribution 4.0 International License. With the
license CC-BY, authors retain the copyright, allowing anyone to download,
reuse, re-print, modify, distribute, and/or copy their contribution. The work
must be properly attributed to its author.
|
|||
|
Keywords: C-Rate, Depth of Discharge, End-of-Life, Optimization, Battery Energy Storage |
|||


1. INTRODUCTION
Integrating battery energy storage systems (BESS) is critical to fulfill intermittent renewable energy generation profiles and prevent excessive renewable penetration so that the supply-demand balance performs as desired. Evaluating the potential for integration, especially in hybrid power systems (HPS), in sustainable zero-carbon-based development plans offers many benefits. If the appropriate incentives are provided for higher battery investment costs, cost of energy (COE) Qi et al. (2022) , Zieba Falama et al. (2022), carbon emissions Jacobus et al. (2011), and grid dependency Üçtuğ and Azapagic (2018) can be reduced, and load coverage and self-consumption rates can be increased Liu et al. (2020).
Appropriate determination of battery degradation characteristics and extra costs due to degradation for optimal sizing of HPSs is essential for many stakeholders to partner in reliable investments Bordin et al. (2017) , Jung et al. (2020). Accordingly, the demand profile and the desired C-rate are the main factors determining the battery degradation characteristics. In addition, other reasons are anode plating thickness/particle size, state of health (SOH), and the shape of the capacity decay curve Kucinskis et al. (2022). Overall, state of charge (SOC) and operating time are highly influential parameters for calendar aging. At the same time, the number of cycles and depth of discharge (DOD) are highly significant parameters for cycling aging. At lower DODs, a lower C-rate increases the number of cycles until the BESS replacements. In comparison, at higher DODs, the effect of possible C-rate on the cycle gradually decreases De La Torre et al. (2019). Obtaining proper information on SOC, power state, and battery efficiency and considering battery current-voltage characteristics under various operating conditions verifies the high estimation of SOC during discharge while eliminating SOC underestimation during charging at each time step (Shabani et al., 2021). Determining the optimal average SOC for each day and the optimal DOD for each cycle guarantees reliable planning of grid operating costs Fallahifar and Kalantar (2023). Moreover, determining the optimum operating conditions for rated capacity and current rate minimizes the annual BESS cost by reducing calendar and cycling aging Dulout et al. (2017). However, the economics of degradation effects versus cost should not be neglected. Higher C-rates may be needed to provide additional grid revenues Sarker et al. (2017). However, for long-term operations, focusing on battery life and considering degradation functions results in 32.2% higher lifecycle costs due to the larger BESS capacity (5.34%) Wu et al. (2022).
On the other hand, the impact of calendar degradation on battery aging is less than the cycling effect. In parallel with the energy variation in supply and demand, C-rates and operational choices in DOD deeply affect planning and optimization objectives Qiu et al. (2022). The inability of most electrochemical models to accurately predict lithium-ion battery behavior, especially at rates higher than 2 C, is one of the main problems limiting their use Li et al. (2019). Higher C-rates result in reduced battery voltage due to higher internal resistance, while discharge rates lower than 0.1 C help maintain BESS health in simplified equivalent circuit models Kebede et al. (2021). Accelerated degradation models assume accurate prediction of battery capacity degradation, especially at lower discharge rates Saxena et al. (2019). Battery capacity degradation accelerated by higher average temperature and SOC in the 0°C to 55°C operating range is detected with the proposed model with an RMS error of 1.4% and battery internal resistance growth with an RMS error of 15% Smith et al. (2017). Considering other main battery degradation factors besides C rates in neural networks enabling the day-ahead market-based data-driven operation can reduce the daily BESS degradation and battery degradation cost by 0.0155% and 78.6% Zhao and Li (2023). Executing the predictions in peak shaving and UPS applications can reduce calendar degradation by 2.9% and 5.6% due to the lower operating times of the BESS and the higher C-rates Kraenzl et al. (2019). However, the reverse power flow effect must be minimized due to high peak generation penetration during certain generation hours Gupta et al. (2022a). Efficient grid support is achieved, especially at a C-rate of 0.33, and a diversity of reliable grid load power demand is ensured Gupta et al. (2022b).
In contrast to the C-rate, at optimum BESS capacity and DOD, self-consumption and feed-in rate can be maximized while maintaining BESS health by synchronizing generation and consumption Tsioumas et al. (2021), Wang et al. (2020). Especially in hybrid plants considering hydrogen production, lowering the DOD will positively impact BESS health but will slow down hydrogen production and reduce system efficiency Tebibel et al. (2015). Therefore, the load demand must be met with minimum cost and high reliability for optimal energy operation during BESS charging and discharging. It is also emphasized that 70% of DOD can realize the desired planning Hlal et al. (2019). Considering the objective of achieving an internal rate of return of 8%, considered the minimum hurdle rate, the optimal DOD should operate at 90%, provided that the battery cost falls below 125-150 £/kWh Rayit et al. (2021). In contrast, in off-grid microgrids, grid extension costs will be similar at a BESS lifetime of 10 years or a DOD higher than 80% Alsaidan et al. (2016).
Finally, many studies have comprehensively evaluated the impacts of DOD and C-rate in terms of calendar and cycling aging. However, no study evaluates the effects of operational operations (DODmax and C-rate) of a shared BESS to be proposed for prosumers in the distribution grid on optimal HPS feasibility outputs at minimum cost. This study fills this gap and determines the optimal DODmax and C-rate at lower end-of-life (EOL) limits. It also evaluates the impact of increasing replacement limits, foreseen as EOL, on the technical, economic, and environmental performance of HPSs and the aging analysis of the BESS. All these processes are performed in four different Arrhenius-based sub-aging models: functional, temperature versus relative capacity curve, DOD curve versus number of cycles until replacement, and temperature versus lifetime curve. These simultaneously operated aging models, which also consider the degradation cost, are built in HOMER Pro, and the Rainflow Counting algorithm is also included to determine the calendar and cycle aging characteristics according to the simultaneous change in the degradation parameters.
2. MATERIALS AND METHODS
2.1. HPS Model
The HPS model in Figure 1 determines the optimal DODmax and C-rate operation for lower or higher EOL. The electricity demand of 30 prosumer households connected to the common distribution line is primarily met by PV. The excess electricity generated first charges the BESS, and when fully charged, the excess energy is sold to the grid. However, optimizing the excess electricity that cannot be used after grid sale is essential. On the contrary, if the energy generated from PV cannot meet the electricity demand and the BESS occupancy rate is insufficient, energy is purchased from the grid, and carbon emissions cannot be prevented. Converters are used for AC and DC energy conversion, while the BESS is prevented from charging from or discharging to the grid. On the other hand, the optimization of HPSs based on shared BESS for a common distribution grid with a minimum cost objective was performed in HOMER Pro. The impact of the optimal DODmax and C-rate on the technical, economic, and environmental feasibility outputs of the BESS operation, considering the cumulative increase in electricity demand over the years, grid tariff, and PV degradation, has been evaluated in-depth in multi-year sensitivity analyses. For this purpose, four different sub-aging models were created in HOMER Pro using Arrhenius and Rainflow Counting algorithms. Initially, the optimum capacity sizes selected for minimum-cost HPS configurations after optimizations are kept constant to examine the effect of BESS technical parameters. Accordingly, PV, BESS, and converter capacities are considered 300 kW, 250 kWh, and 200 kW. All these studies were conducted in Fatih, Istanbul (41° 0.5' N and 28° 58.7' E). The average daily solar irradiation, clearness index, and temperature for Fatih from the NASA database are 3.94 kWh/m2/day, 0.481, and 14.46°C.
Three parameters are used to model PV in HPS configuration: PV array output power, cell temperature, and panel efficiency at nominal test conditions. The relevant parameters are calculated in Equations (1), Equation (2), and Equation (3) respectively Terkes et al. (2023).
![]() (1)
(1)
![]() (2)
(2)
![]() (3)
(3)
Figure 1

|
Figure 1 HPS Model (Terkes & Demirci, 2023) |
HOMER Pro considers a two-tank model depending on three different parameters: chemically bound energy for the batteries and available energy for energy conversion. The total energy the two tanks can store in the relevant tank model determines the maximum storage capacity. In contrast, the ratio of the available energy size to the composite size of both tanks provides the capacity rate. The rate constant indicates the bidirectional energy conversion rate from bound to available energy. Based on these three parameters, the tank's maximum charging and discharging power is calculated from Equations (4) and Equation (5). If the discharge efficiency is considered, Equation (5) is revised as Equation (6). In addition to the maximum limits determining the input and output energy range, two different limits are set on the maximum charging power. The first one is related to the charging power corresponding to the maximum charging rate and is calculated by Equation (7). The second one is associated with the maximum charging current and is determined by Equation (8). For the three limitations related to charging power and efficiency, the calculation of the maximum charging power is based on the minimum in Equation (9). After determining the charging and discharging power at each time step, the bound and available energy are calculated in Equations (10) and Equation (11). Moreover, depending on the maximum capacity and voltage of the storage, the number of cycles until the replacement, and the DOD, the lifetime energy throughput of the battery pack is determined in Equation (12) Terkes and Demirci (2023).
![]() (4)
(4)
![]() (5)
(5)
![]() (6)
(6)
![]() (7)
(7)
![]() (8)
(8)
![]() (9)
(9)
![]() (10)
(10)
![]() (11)
(11)
![]() (12)
(12)
In addition to the battery model, four sub-aging curves must be determined. The first sub-model uses the functional approach, i.e., the output power calculated in Equation (13), considering the losses related to the battery's internal resistance. The functional expression is known as capacity decay and growth series resistance. Considering the circuit behavior, the output power decreases with the square of the current flowing through the circuit. Suppose the derivative of the output power concerning the circuit current is equal to zero. In that case, the maximum current limitation corresponding to the maximum output power is found in Equation (14) Terkes and Demirci (2023).
![]() (13)
(13)
![]() (14)
(14)
Another sub-aging model involves characterizing the temperature as the bulk thermal capacity. The energy dissipated in the active series resistor is either converted into heat or increases the bulk temperature in the storage bank. The heat transferred to or removed from the environment is calculated according to the convection equation (q=hΔt), while the thermal energy ultimately lost is determined by Equation (15). Considering the energy balance in Equation (16), the differential solution in Equation (17) is used to calculate the rate of change in the battery's internal temperature. Depending on the available temperature of the battery pack, HOMER Pro effectively adjusts the SOCmin Terkes and Demirci (2023).
![]() (15)
(15)
![]() (16)
(16)
![]() (17)
(17)
The relative capacity about temperature represents another sub-curve, and the corresponding curve is fitted to Equation (18) based on the parameters d0, d1, and d2 promised by battery manufacturers Terkes and Demirci (2023).
![]() (18)
(18)
The last sub-aging models address how to calculate calendar and cycling aging. The increasing degradation rates at each time step, whether in use or idle, is known as calendar aging and depends only on temperature, as in Equation (19). In contrast, in the case of cycling aging, which refers to cycle fatigue, the cycle count curve, which will vary depending on the DOD, is determined by Equation (20). When the Rain flow Counting algorithm adjusts the SOC-dependent time series for discrete cycles about DOD, the cumulative cycling degradation is calculated by Equation (21) , Terkes and Demirci (2023).
![]() (19)
(19)
![]() (20)
(20)
![]() (21)
(21)
In contrast to BESS, the converters used in this study operate in two modes: inverter and rectifier. The inverter and rectifier output power and converter efficiency are calculated in Equations (22), Equation (23), and Equation (24) Terkes et al. (2023).
2.2. Material
The technical and economic inputs and assumptions considered in the optimization are summarized in Table 1 . The investment, replacement, and O&M costs are average prices selected from the literature and the technical data for HPS components except BESS are related to the average assumptions in the HOMER tutorials. For households connected to the common distribution bus, each consuming 10 kWh/day, the peak demand is 61.76 kW, and the load factor is 20%. Daily and hourly demand variability is based on the HOMER assumption and is assumed to be 10% and 20%, respectively. Since the technical performance of BESS is analyzed considering the current residential tariffs in Turkey, electricity sales to the grid are assumed to be 0.02 $/kWh. Although inflation and discount rates vary daily, last year's data is used, and the carbon emission of the unit of electricity purchased from the grid is 426.1 g/kWh. The project horizon is 20 years, while 20 $/ton is considered a carbon tax. Regarding BESS technical parameters, only data for 50% EOL is shared in Table 1 . Based on historical average data, the cumulative increase in electricity tariff over the years is considered as 3.5% and electricity demand as 2.3%, while the PV degradation of 0.5% considered in HOMER tutorials is included in the optimization. On the other hand, the carbon tax is 20 $/ton, while the interest rate in Turkey is 23.3%, and the inflation rate is 14%, based on last year's average data.
2.3. Scenarios
This study evaluates the impact of DODmax and C-rate operating plans of BESSs on the technical, economic, and environmental feasibility of HPS and BESS aging analysis for lower EOL limits. Based on the optimal DODmax and C-rate to be determined in the first step, which effectively manages HPS feasibility, the EOL limits are changed in the second step.
Table 1
|
Table 1 Optimization Inputs of the Study |
|||
|
HPS |
Parameter
description |
||
|
PV |
Manufacturer |
Generic |
|
|
Panel type |
Flat plate |
||
|
Rated capacity |
1 |
kW |
|
|
Lifetime |
25 |
years |
|
|
Derating factor |
80 |
% |
|
|
Efficiency |
20 |
% |
|
|
Capital cost |
1500 |
$/kW |
|
|
Replacement cost |
1250 |
$/kW |
|
|
O&M cost |
10 |
$/kW/yr |
|
|
Converter |
Manufacturer |
Generic |
|
|
Rated capacity |
1 |
kW |
|
|
Lifetime |
15 |
years |
|
|
Inverter efficiency |
95 |
% |
|
|
Rectifier efficiency |
95 |
% |
|
|
Capital cost |
300 |
$/kW |
|
|
Replacement cost |
300 |
$/kW |
|
|
O&M cost |
0 |
$/kW/yr |
|
|
BESS |
Manufacturer |
Generic |
|
|
Initial SOC |
100 |
% |
|
|
Minimum SOC |
50 |
% |
|
|
Replacement degradation limit |
20-50 |
% |
|
|
Maximum C-rate |
0.2-3 C |
A/Ah |
|
|
Other round-trip losses |
8 |
% |
|
|
Maximum charge current |
270 |
A |
|
|
Maximum discharge current |
810 |
A |
|
|
Maximum capacity |
271.81 |
Ah |
|
|
Capacity ratio |
1 |
||
|
Rate constant |
74.29 |
1/hr |
|
|
Effective series resistance |
0.00036181 |
Ω |
|
|
Nominal cell voltage |
3.7 |
V |
|
|
Maximum operating temperature |
60 |
◦C |
|
|
Minimum operating temperature |
0 |
◦C |
|
|
Mass |
9.08 |
kg |
|
|
Fixed bulk temperature |
20 |
◦C |
|
|
d0 |
0.923 |
||
|
d1 |
0.00345 |
||
|
d2 |
-0.0000375 |
||
|
A |
0.00036059 |
||
|
β |
1.7945 |
||
|
B |
12.9366 |
||
|
d |
4238.854 |
||
|
Capital cost |
300 |
$/kWh |
|
|
Replacement cost |
250 |
$/kWh |
|
|
O&M cost |
5 |
$/kWh/yr |
|
|
Grid |
Flat tariff (06.00-17.00) |
0.0822 |
$/kWh |
|
Peak tariff (17.00-22.00) |
0.1199 |
$/kWh |
|
|
Valley tariff (22.00-06.00) |
0.052 |
$/kWh |
|
|
Grid sell-back price |
0.02 |
$/kWh |
|
Table 2
|
Table 2 Scenarios of the Study |
||||
|
Scenarios |
DODmax
(%) |
C-rate |
EOL
(%) |
Sub-scenarios |
|
A |
50,
60, 70, 80 |
0.2
C |
20 |
A.1.1,
A.1.2, A.1.3, A.1.4 |
|
|
|
0.5
C |
|
A.2.1,
A.2.2, A.2.3, A.2.4 |
|
|
|
1
C |
|
A.3.1,
A.3.2, A.3.3, A.3.4 |
|
|
|
2
C |
|
A.4.1,
A.4.2, A.4.3, A.4.4 |
|
|
|
3
C |
|
A.5.1,
A.5.2, A.5.3, A.5.4 |
|
B |
|
0.2,
0.5, 1, 2, and 3 C |
30 |
B.1.1,
B.1.2, … , B.5.3, B.5.4 |
|
C |
|
|
40 |
C.1.1,
C.1.2, … , C.5.3, C.5.4 |
|
D |
|
|
45 |
D.1.1,
D.1.2, … , D.5.3, D.5.4 |
|
E |
|
|
50 |
E.1.1,
E.1.2, … , E.5.3, E.5.4 |
2.4. Objective Functions and Decision Criteria
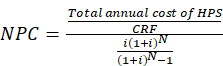
Minimizing the net present cost (NPC) is the objective for determining optimal HPS configurations. Simultaneously with the NPC, a lower levelized cost of energy (LCOE) is also desirable. The capital recovery factor (CRF) used for the calculations required for NPC and LCOE is determined by Equation (25). The difference between revenues and expenses at the end of each year, discounted to the present and summed over the years, is used to calculate the NPC with Equation (26), while the LCOE related to the CRF and NPC is determined with Equation (27). Another financial parameter, operating cost, is considered in Equation (28) Terkes and Demirci (2023).
![]() (25)
(25)
 (26)
(26)
![]() (27)
(27)
![]() (28)
(28)
On the path to carbon neutrality and the economic objective, it is desired to increase the renewable share (RF) in meeting the electricity demand and thus reduce the carbon emissions from the electricity purchased from the grid. Therefore, the total carbon emission is calculated by Equation (30) considering the emission factor in the grid mix while determining the RF in Equation (29) , Terkes et al. (2023).
![]() (29)
(29)
![]() (30)
(30)
Other essential parameters of concern for BESS are battery wear cost and autonomy. The storage wear cost in $/kWh, which represents the energy cycle cost, is calculated in Equation (31). In contrast, the autonomy, defined as the size of the storage bank about the electrical load, is evaluated in Equation (32) Terkes and Demirci (2023).
![]() (31)
(31)
![]() (32)
(32)
3. OPTIMIZATION RESULTS
3.1. Scenario A
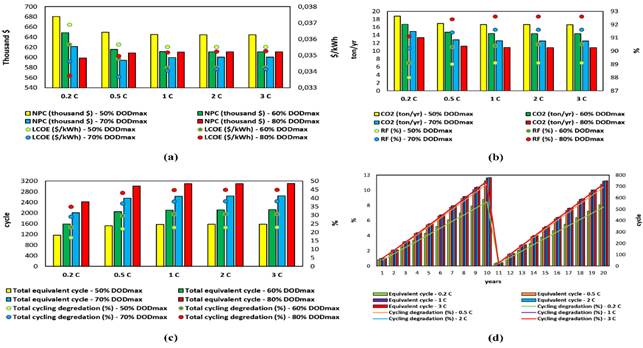
Optimal C-rate and DODmax are the main objectives due to the lower BESS lifetime at lower EOL limits. Therefore, the comparative impact of different C-rate and DODmax on HPS feasibility for a 20% EOL limit is shown in Figure 2 . At higher DODmax and increasing C-rate, LCOE, and NPC increase by 4.48% and 2.06% due to the increase in degradation and related operating costs. Despite rising expenses, a more favorable supply-demand balance increases the RF by 1.5%. With the rise in renewable potential, CO2 can be reduced by up to 19% on the path to carbon neutrality. As it is only related to temperature, while the total calendar degradation does not change depending on the C-rate and DODmax, with increasing DODmax and C-rate, the cycling degradation increases by 10%, and the total number of equivalent cycles increases by 683.58 (28.26%). Higher degradation rates increase the operating cost by up to 91.4%.
On the contrary, with increasing C-rate at lower DODmax, cycling degradation, and total equivalent cycle are reduced by 4% and 266.89 cycles, compared to higher DODmax due to the decreased matching in the supply-demand balance. This positive acceleration in aging reduces LCOE and NPC by up to 3.71% and 5.3%. However, RF and CO2 benefits are reduced by 0.4% and 7.65%. Higher operating costs are also avoided.
On the other hand, charge-discharge rates above 1 C-rate do not change the feasibility of HPS much, while lower DODmax is not very favorable to the supply-demand balance. Therefore, 80% DODmax and 1 C-rate offer optimal HPS feasibility. In detail, it is emphasized that in the case of a 1 C-rate, increasing DODmax can reduce LCOE and NPC by up to 1% and 5.4% while increasing RF by up to 3.5%. Calendar degradation does not change much, but cycling degradation and total equivalent cycles increase by 22% and 1522.54 cycles (96.83%). Although the negative impact on degradation is expected to increase operating costs, the dominant advantages of higher DODmax reduce the operating cost by up to 58%. It is emphasized that CO2 reduction in carbon neutral policies would benefit up to 34.81%. On the contrary, when analyzing the aging characteristics by years (Figure 2 (d)), the cycling degradation increases by up to 16% from the first to the last year, reaching 17.91%. Due to the significant impact of the C-rate on cycling degradation, increasing the C-rate raises the degradation rates to 2.76% and 3.06% at the first replacement of BESS (between years 10-11) and the end of the project horizon. Following the same logic, the total number of equivalent cycles increases by 191.59 and 211.65 (32.63% and 39.17%).
Figure
2
|
Figure 2 Evaluation of HPS Feasibility Considering DOD and C-Rate |
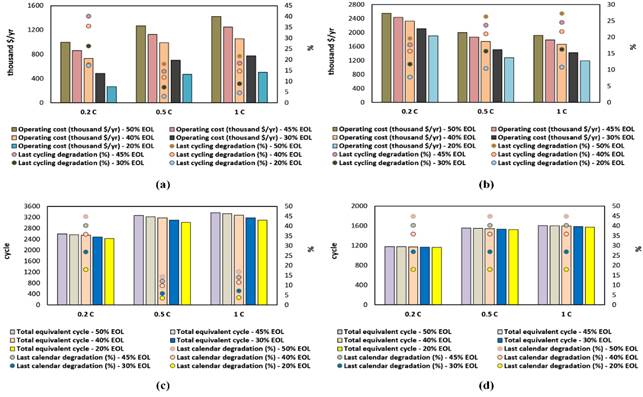
3.2. Scenarios B, C, D, and E
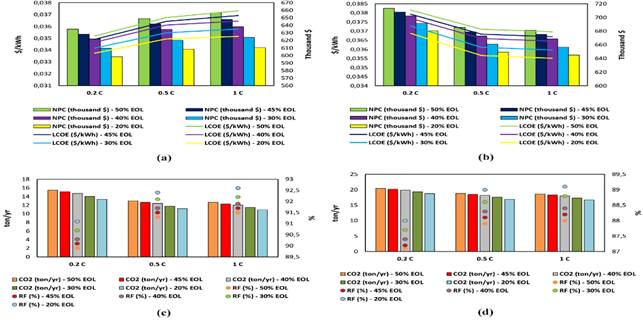
For the 20% EOL limit, a C-rate of 1 C and a DODmax of 80% were determined to be the optimal BESS technical operating parameters. However, the comparative effects of C-rate and DODmax on the feasibility of BESS and HPS at different EOL limits are also evaluated in Figure 3 . Where (a) and (c) are for 80% DODmax, (b) and (d) are for 50% DODmax. Suppose the EOL limit is increased by 30%. In that case, it is valuable to evaluate the impact on HPS feasibility of increasing the C-rate at 80% DODmax or increasing DODmax by 1 C by comparing the same logic. For 80% DODmax, the negatives of the increase in LCOE and NPC at increasing C-rates further increase up to 1.55% after a 30% increase in EOL. However, with a 98.73% increase in the total number of equivalent cycles, the negativity in operating costs decreases up to 48.6%.
Figure 3
|
Figure 3 Evaluation of HPS Feasibility Considering EOL Limits and C-Rate: (a) - (c) 80% Dodmax, (b) - (d) 50% Dodmax |
Another motivation is comparing the impact on HPS feasibility of increasing DODmax for a 1 C-rate compared to a 30% increase in EOL. A further positive effect of up to 1.74% is achieved on the previous beneficial downward trend in LCOE and NPC. In comparison, an additional contribution of up to 2.87% is made to environmental policies towards carbon neutrality. The total number of equivalent cycles increased by 243.27, and operating costs decreased by up to 32.11%.
Figure 4
|
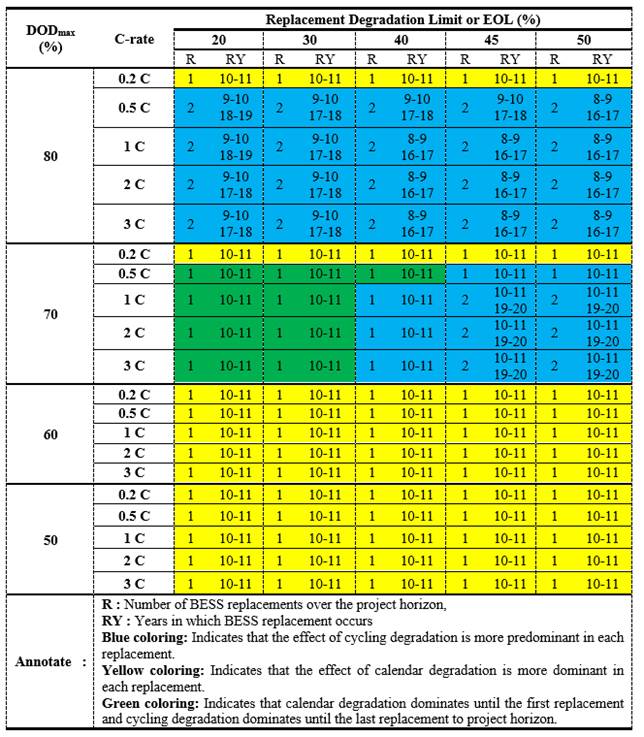
Figure
4 Battery Performance Assessment
Considering End of Life, C-Rate & Dodmax |
On the other hand, considering the optimal DODmax and C-rate, the higher EOL limits increased the operating costs, NPC, and LCOE by up to 921 thousand $, 7.6% and 6.1% despite reducing the number of BESS replacements and extending the lifetime. Although negative financial performance, CO2 can be reduced by up to 16.56% due to the 276.4 (8.93%) increase in the BESS total equivalent cycle. It can be noted that after the last BESS replacement, the calendar and cycling degradation increased up to 13.13% and 17%. Before the in-depth analysis of the BESS aging performance of the EOL limits, Figure 4 summarizes the number and range of years in which BESS replacement occurs for the EOL limits at different C-rate and DODmax.
Figure 5
|
Figure 5 Comparison of BESS Aging Performance Considering C-Rate for EOL Limits:
(a) - (c) 80% Dodmax , (b) - (d)
50% Dodmax |
The cases where cycling and calendar degradation dominate the BESS replacement are indicated by coloring in the table. As the EOL limit increases, the interval of years of replacement shortens by one year for 80% DODmax. For a 0.2 C-rate, it can be said that calendar degradation is the main cause of BESS replacement. For a charge-discharge rate above 0.2 C, cycling degradation can be shown as the cause of BESS replacement. At 70% DODmax, the number of replacements increases at higher EOL limits. In some sub-scenarios, the coloring area (green) is dominated by calendar degradation until the first BESS replacement and cycling degradation until the project horizon. At lower DODmax, the number of replacements is one since the BESS is less utilized in the supply-demand balance, and the dominant cause of replacements is calendar degradation.
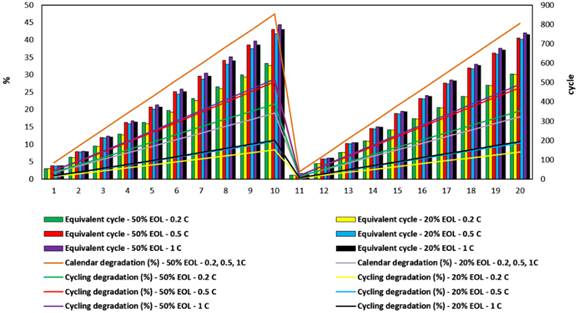
On the other hand, the BESS aging performance is analyzed in Figure 5 for different EOL limits considering the C-rate and DODmax. Where (a) and (c) are given for 80% DODmax, (b) and (d) for 50% DODmax, comparing the degradation after the last BESS replacement due to the degradation limit and other parameters.
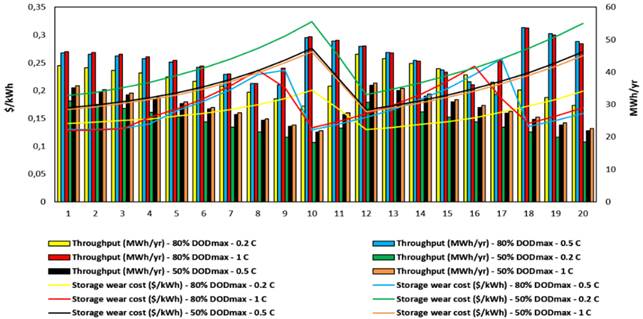
Figure 6
|
Figure 6 (a) Annual Comparison of BESS Technical Performance
Considering the C-Rate for EOL Limits (b) Annual Comparison of BESS Technical
Performance Considering the C-Rate for EOL Limits |
Therefore, for higher DODmax and 1 C-rate, the EOL increased by 276.4 equivalent BESS cycles (8.93%), raising the operating costs up to 921 thousand $. In addition, calendar and cycling degradation rises up to 13.13% and 17%. On the contrary, for lower DODmax and 1 C-rate, EOL increases by 33.11 equivalent BESS cycles (2.11%), and operating costs rise up to 725.92 thousand $.
Moreover, an in-depth analysis of the BESS aging performance by year, depending on the EOL limits and considering the C-rate and DODmax, is evaluated in Figure 6. Where (a) and (c) are considered for 80% DODmax and (b) and (d) for 50% DODmax.
Increasing C-rates for an EOL limit of 20%: cycling degradation rises up to 2.76% during the first BESS replacement and up to 3.06% at the project horizon; total equivalent cycles increase by 191.59 (32.63%) and 211.65 cycles (39.17%). If the EOL limit is increased by 30%, the respective degradation rates rise to 4.55% and 4.76%, and the total number of equivalent cycles increases by 11.68 (1.26%) and 5.34 cycles (0.67%). In-depth on a year-by-year basis, as the EOL limit increases for the optimal 1 C-rate and 80% DODmax, calendar degradation rises up to 28.44% and 26.87% at the time of the first BESS replacement and at the project horizon. In a similar logic, cycling degradation and total equivalent cycle increase up to 17.6% and 16.5% and 23.2 and 8.59 cycles (3% and 1.15%), respectively. However, increasing C-rates has little effect on calendar degradation since calendar degradation is temperature-related.
In addition to degradation parameters, throughput, and BESS wear cost are also valuable for BESS performance. For increasing C-rates, regardless of DODmax, BESS wear cost decreases between 17.67-33.83%, while lifetime throughput increases between 21.86-73.05% at increasing C-rates, lifetime throughput increases by 145 MWh (19.29%) for 80% DODmax. The same parameter increases by 307.52 MWh (52.22%) at increasing DODmax for 1 C-rate. It can be emphasized that the effect of DODmax on lifetime throughput is higher.
4. CONCLUSION
This study optimizes the sizing of HPSs using a shared BESS for prosumers in a common bus distribution network by considering BESS operation with a minimum cost objective. DODmax and C-rate are initially determined for prosumers, providing optimal HPS feasibility at lower EOL limits. The beneficial impact of possible increases in EOL limits on technical, economic, and environmental HPS feasibility and BESS aging characteristics was also evaluated. The effect of DODmax, C-rate, and EOL on HPS feasibility was examined in depth at each step, and all results were analyzed in multi-year sensitivity analyses considering the cumulative increase in electricity demand over the years, grid tariff, and PV degradation. The results show that increasing the C-rate reduces CO2 by up to 19% and increases the total number of equivalent BESS cycles by 683.58 (28.26%) but increases cycling degradation by up to 10%. Moreover, regarding the HPS benefit, the effect of increasing DODmax is proven to be higher than the C-rate. In addition, the higher EOL limit can increase costs by up to 7.6% and raise the calendar and cycling degradation from the last BESS replacement to the project lifetime by up to 17%. These drawbacks can be reduced by increasing the total BESS equivalent cycle to 276.4 (8.93%). Finally, the optimal operating point that maximizes the HPS feasibility benefit while ensuring investment reliability for many stakeholders is 80% DODmax. The outputs of this study can be extended in the future using different BESS technologies and considering individual BESS instead of shared BESS.
CONFLICT OF INTERESTS
None.
ACKNOWLEDGMENTS
Analyzes and comments made in this document belong to the authors. Any institution, company, etc., does not support the article.
REFERENCES
Alsaidan, I., Khodaei, A., & Gao, W. (2016). Determination of Optimal Size and Depth of Discharge for Battery Energy Storage in Standalone Microgrids. 48th North American Power Symposium (NAPS), 1-6. https://doi.org/10.1109/NAPS.2016.7747845
Bordin, C., Anuta, H. O., Crossland, A., Gutierrez, I. L., Dent, C. J., & Vigo, D. (2017). A Linear Programming Approach for Battery Degradation Analysis and Optimization in Offgrid Power Systems with Solar Energy Integration. Renewable Energy, 101, 417-430. https://doi.org/10.1016/j.renene.2016.08.066
De La Torre, S., González-González, J. M., Aguado, J. A., & Martín, S. (2019). Optimal Battery Sizing Considering Degradation for Renewable Energy Integration. Iet Renewable Power Generation, 13(4), 572-577. https://doi.org/10.1049/iet-rpg.2018.5489
Dulout, J., Jammes, B., Alonso, C., Anvari-Moghaddam, A., Luna, A., & Guerrero, J. M. (2017). Optimal Sizing of a Lithium Battery Energy Storage System for Grid-Connected Photovoltaic Systems. Ieee 2nd International Conference on Direct Current Microgrids (ICDCM), 582-587. https://doi.org/10.1109/ICDCM.2017.8001106
Fallahifar, R., & Kalantar, M. (2023). Optimal Planning of Lithium Ion Battery Energy Storage for Microgrid Applications: Considering Capacity Degradation. Journal of Energy Storage, 57, 106103-106113. https://doi.org/10.1016/j.est.2022.106103
Gupta, S., Rawat, M. S., & Gupta, T. N. (2022). Optimal Placement and Sizing of Various C-Rate Type of Bess for Minimizing the Impact of Intermittent Dg Output on Hourly Peak Load Variation in Radial Distribution Network. 2nd International Conference on Emerging Frontiers in Electrical and Electronic Technologies (ICEFEET), 1-6. https://doi.org/10.1109/ICEFEET51821.2022.9847777
Hlal, M. I., Ramachandaramurthy, V. K., Sarhan, A., Pouryekta, A., & Subramaniam, U. (2019). Optimum Battery Depth of Discharge for Off-Grid Solar Pv/Battery System. Journal of Energy Storage, 26, 100999-101007. https://doi.org/10.1016/j.est.2019.100999
Jacobus, H., Lin, B., Jimmy, D. H., Ansumana, R., Malanoski, A. P., & Stenger, D. (2011). Evaluating the Impact of Adding Energy Storage on the Performance of a Hybrid Power System. Energy Conversion and Management, 52(7), 2604-2610. https://doi.org/10.1016/j.enconman.2011.01.015
Jung, W., Jeong, J., Kim, J., & Chang, D. (2020). Optimization of Hybrid Off-Grid System Consisting of Renewables and Li-Ion Batteries. Journal of Power Sources, 451, 227754-227765. https://doi.org/10.1016/j.jpowsour.2020.227754
Kebede, A. A., Coosemans, T., Messagie, M., Jemal, T., Behabtu, H. A., Van Mierlo, J., & Berecibar, M. (2021). Techno-Economic Analysis of Lithium-Ion and Lead-Acid Batteries in Stationary Energy Storage Application. Journal of Energy Storage, 40, 102748-102766. https://doi.org/10.1016/j.est.2021.102748
Kraenzl, J., Nguyen, T. T., & Jossen, A. (2019). Investigating Stationary Storage Applications and their Impact on Battery Aging. 14th International Conference on Ecological Vehicles and Renewable Energies (EVER), 1-9. https://doi.org/10.1109/EVER.2019.8813636
Kucinskis, G., Bozorgchenani, M., Feinauer, M., Kasper, M., Wohlfahrt-Mehrens, M., & Waldmann, T. (2022). Arrhenius Plots for Li-Ion Battery Ageing as a Function of Temperature, C-Rate, and Ageing State - An Experimental Study. Journal of Power Sources, 549, 232129-232138. https://doi.org/10.1016/j.jpowsour.2022.232129
Li, J., Wang, D., & Pecht, M. (2019). An Electrochemical Model for High C-Rate Conditions in Lithium-Ion Batteries. Journal of Power Sources, 436, 226885-226894. https://doi.org/10.1016/j.jpowsour.2019.226885
Liu, J., Wang, M., Peng, J., Chen, X., Cao, S., & Yang, H. (2020). Techno-Economic Design Optimization of Hybrid Renewable Energy Applications for High-Rise Residential Buildings. Energy Conversion and Management, 213, 112868-112882. https://doi.org/10.1016/j.enconman.2020.112868
Qi, X., Wang, J., Królczyk, G., Gardoni, P., & Li, Z. (2022). Sustainability Analysis of a Hybrid Renewable Power System with Battery Storage for Islands Application. Journal of Energy Storage, 50, 104682-104693. https://doi.org/10.1016/j.est.2022.104682
Qiu, Z., Zhang, W., Lu, S., Li, C., Wang, J., Meng, K., & Dong, Z. (2022). Charging-Rate-Based Battery Energy Storage System in Wind Farm and Battery Storage Cooperation Bidding Problem. Csee Journal of Power and Energy Systems, 8(3), 659-668. https://doi.org/10.17775/CSEEJPES.2021.00230
Rayit, N. S., Chowdhury, J. I., & Balta-Ozkan, N. (2021). Techno-Economic Optimisation of Battery Storage for Grid-Level Energy Services Using Curtailed Energy from Wind. Journal of Energy Storage, 39, 102641-102654. https://doi.org/10.1016/j.est.2021.102641
Sarker, M. R., Murbach, M. D., Schwartz, D. T., & Ortega-Vazquez, M. A. (2017). Optimal Operation of a Battery Energy Storage System: Trade-Off Between Grid Economics and Storage Health. Electric Power Systems Research, 152, 342-349. https://doi.org/10.1016/j.epsr.2017.07.007
Saxena, S., Xing, Y., Kwon, D., & Pecht, M. (2019). Accelerated Degradation Model for C-Rate Loading of Lithium-Ion Batteries. International Journal of Electrical Power and Energy Systems, 107, 438-445. https://doi.org/10.1016/j.ijepes.2018.12.016
Shabani, M., Dahlquist, E., Wallin, F., & Yan, J. (2021). Techno-Economic Impacts of Battery Performance Models and Control Strategies on Optimal Design of a Grid-Connected PV System. Energy Conversion and Management, 245, 114617-114637. https://doi.org/10.1016/j.enconman.2021.114617
Smith, K., Saxon, A., Keyser, M., Lundstrom, B., Cao, Z., & Roc, A. (2017). Life Prediction Model for Grid-Connected Li-Ion Battery Energy Storage System. Proceedings of the American Control Conference, 4062-4068. https://doi.org/10.23919/ACC.2017.7963578
Tebibel, H., Labed, S., Khellaf, A., Ziogou, C., Papadopoulou, S., & Voutetakis, S. (2015). Impact of the Battery Depth of Discharge on the Performance of Photovoltaic Hydrogen Production Unit with Energy Management Strategy. International Conference on Renewable Energy Research and Applications (ICRERA), 1074-1078. https://doi.org/10.1109/ICRERA.2015.7418575
Terkes, M., & Demirci, A. (2023). Evaluation of Hybrid Power System Feasibility Considering Battery Degradation. 17th International Scientific Research Congress, 95-105.
Tsioumas, E., Jabbour, N., Koseoglou, M., Papagiannis, D., & Mademlis, C. (2021). Enhanced Sizing Methodology for the Renewable Energy Sources and the Battery Storage System in a Nearly Zero Energy Building. IEEE Transactions on Power Electronics, 36(9), 10142-10156. https://doi.org/10.1109/TPEL.2021.3058395
Wang, S., Guo, D., Han, X., Lu, L., Sun, K., Li, W., Sauer, D. U., & Ouyang, M. (2020). Impact of Battery Degradation Models on Energy Management of a Grid-Connected DC Microgrid. Energy, 207, 118228-118243. https://doi.org/10.1016/j.energy.2020.118228
Wu, Y., Liu, Z., Liu, J., Xiao, H., Liu, R., & Zhang, L. (2022). Optimal Battery Capacity of Grid-Connected PV-Battery Systems Considering Battery Degradation. Renewable Energy, 181, 10-23. https://doi.org/10.1016/j.renene.2021.09.036
Zhao, C., & Li, X. (2023). Microgrid Optimal Energy Scheduling Considering Neural Network Based Battery Degradation. IEEE Transactions on Power Systems, 1-12. https://doi.org/10.1109/tpwrs.2023.3239113
Zieba Falama, R., Dawoua Kaoutoing, M., Kwefeu Mbakop, F., Dumbrava, V., Makloufi, S., Djongyang, N., Salah, C. Ben, & Doka, S. Y. (2022). A Comparative Study Based on a Techno-Environmental-Economic Analysis of Some Hybrid Grid-Connected Systems Operating Under Electricity Blackouts: A Case Study in Cameroon. Energy Conversion and Management, 251, 114935. https://doi.org/10.1016/j.enconman.2021.114935
Üçtuğ, F. G., & Azapagic, A. (2018). Environmental Impacts of Small-Scale Hybrid Energy Systems: Coupling Solar Photovoltaics and Lithium-Ion Batteries. Science of the Total Environment, 643, 1579-1589. https://doi.org/10.1016/j.scitotenv.2018.06.290
|
|
 This work is licensed under a: Creative Commons Attribution 4.0 International License
© IJETMR 2014-2023. All Rights Reserved.