
|
|
|
|
APPLICATION OF BENFORD’S LAW ON TRADE VOLUME OF CRYPTOCURRENCIES
Ann Mary Alexander 1![]() , Dr. Resia Beegam. S 2
, Dr. Resia Beegam. S 2
1 Research Scholar, Department of
Commerce, University of Kerala, India
2 Professor, Department of Commerce, University
of Kerala, India
|
|
|
ABSTRACT |
|
|
Cryptocurrencies have become a global phenomenon and its trading volume has been increasing since 2017 Aloosh and Li (2019). However, cryptocurrencies have been accused of market manipulation in the past. Benford’s law is widely used for detecting probability of frauds and manipulation in various fields. This study applied Benford’s law on trade volume of cryptocurrencies. Chi- square statistics revealed that except for Cardano and USDT all the other cryptocurrencies did not conform to the distribution and reveals the dataset could have been manipulated. This method may be used as the pre-requisite before doing fine-grain screening such as machine learning and graph-based searching. |
|||
|
Received 15 November 2022 Accepted 16 December 2022 Published 31 December 2022 Corresponding Author Ann Mary
Alexander, annmary.alexander93@gmail.com
DOI 10.29121/ijetmr.v9.i12.2022.1279 Funding: This research
received no specific grant from any funding agency in the public, commercial,
or not-for-profit sectors. Copyright: © 2022 The
Author(s). This work is licensed under a Creative Commons
Attribution 4.0 International License. With the
license CC-BY, authors retain the copyright, allowing anyone to download,
reuse, re-print, modify, distribute, and/or copy their contribution. The work
must be properly attributed to its author.
|
|||
|
Keywords: Benford’s Law,
Cryptocurrencies, Chi-Square Test, Manipulation, Trade Volume |
|||


1. INTRODUCTION
Cryptocurrencies have been trending worldwide and is considered as a profitable means of investment. Trading volume has soared high in the cryptocurrency markets since the world realised the potential of the blockchain technology in 2017 Aloosh and Li (2019). Market manipulation means to create an artificial demand for an asset thereby resulting in hike in prices. This creates an illusion in the market and new investors find it unsafe to invest their money. In 2018, the US Department of Justice (DOJ) carried out an investigation to see if there was any price-volume manipulation in the Bitcoin market What is Market Manipulation in Cryptocurrency? (2021). It is difficult to regulate these markets because of their decentralised nature. Cryptos having low volumes are easy to be manipulated. There have been concerns around the world citing possible manipulation in these markets. Thus, studies have been conducted worldwide to track and trace suspicious trading activity.
A peripheral analysis of financial statements is necessary before delving into an in-depth analysis Vičič and Tošić (2021). Benford’s law, known as the law of first digit, has been used as a basic tool for uncovering frauds in finance and accounting. This study intends to check the conformity of trading volume of cryptocurrencies to Benford’s law to detect the presence of any anomalies in the crypto market.
2. Literature Review
There are various studies where Benford’s law has been applied under different contexts. Vaasa (2019) analysed the price and volume of cryptocurrencies to check their conformity with Benford’s law. While the whole sample results conformed with the law, the sub-samples did not show conformity. Aloosh and Li (2019) examined the undisclosed internal data of a Bitcoin market that was leaked by hackers to find out the presence of wash trading, a technique used for manipulating the market. The results showed evidence supporting that trade volumes were artificially manipulated. Peterson (2020) analysed the closing prices of bitcoin from 2011 to 2019 and findings confirmed that bitcoin prices had been fraudulently manipulated sometime after 2010.
To detect the presence of possible frauds Vičič and Tošić (2021) applied Benford’s law to cryptocurrencies and found that most of the cryptos did not conform to it. Benford’s law was used to check the distribution of first digits of S&P 500’s stock prices and returns, and findings proved that majority of the stocks followed Benford’s law thereby supporting previous literature Corazza and Ellero (2008).
Similar findings were obtained when Benford’s law was used to check conformity of stock turnover in BSE. The results showed that the law held good in case of the stocks Balamurugan et al. (2019).Benford’s law of anomalous numbers were applied on the stock market index values of Istanbul Stock Exchange (BIST).The output revealed that twenty-eight indices moderately agreed with Benford’s law Karavardar (2014).
However, some studies show partial conformity of data to Benford’s law. Jayasree et al. (2018) applied the law on stock trade and returns and showed that while stock trade which included volume, number of trades, and turnover agreed with the law stock returns showed non-conformity. After reading the relevant literature, the research problem identified is about whether there the first digit of naturally formed numbers deviates significantly from Benford’s law. The research hypothesis formulated is:
H0: The distribution of first digits of trade volume of cryptocurrencies is in accordance with Benford’s law
3. Benford’s Law
Benford’s law also known as the first-digit law is used for observing the frequency distribution of leading digits. It is widely used in different areas to find out frauds and manipulation in accounting, stock prices, real estate prices and very recently the reported number of COVID-19 cases. There is a fixed probability distribution for leading digits as per Benford’s law.
In 1938, Frank Benford found again an observation made by Newcomb (1881) that in various numerical datasets, the first digits ranging from 1 to 9 are not evenly distributed Rauch et al. (2013).The equation for the distribution of first digits of observed data is
P(d1) = log10(d
+ 1) − log10(d) = log10(1 + 1/d) Equation 1
Where the quantity P(d) is proportionate to the space between d and d + 1 on a logarithmic scale. The resulting distribution is shown in Table 1 given below:
Table 1
|
Table 1 Benford
Distribution of First Digit |
|||||||||
|
D1 |
1 |
2 |
3 |
4 |
5 |
6 |
7 |
8 |
9 |
|
P(D1=d1) |
0.301 |
0.176 |
0.125 |
0.097 |
0.079 |
0.067 |
0.058 |
0.051 |
0.046 |
4. Limitations of the Study
1) Only volume of the cryptocurrencies has been taken for the study.
2) Benford’s law has been checked only with respect to the first digit.
5. Methodology
The current study applies Benford’s law to the volume of cryptocurrencies to see if they conform to it or not. Daily trade volume of eight cryptocurrencies have been taken for analysis from 9th November 2017 to 5th March,2022 with 1577 observations each. Daily data was taken from Yahoo Finance. Cryptocurrencies taken for the study are given below in Table 2.
Table 2
|
Table 2 Cryptocurrencies Taken
for the Study |
||
|
No |
Name
of the cryptocurrency |
Symbol |
|
1. |
Bitcoin |
BTC |
|
2. |
Ethereum |
ETH |
|
3. |
Tether |
USDT |
|
4. |
BNB |
BNB |
|
5. |
USD coin |
USDC |
|
6. |
XRP |
XRP |
|
7. |
Cardano |
ADA |
|
8. |
Dogecoin |
DOGE |
Chi-square test was done to check the statistical significance.
Χ2 = N ![]() O-E)2
/E
Equation 2
O-E)2
/E
Equation 2
Where,
N denotes the number of observations,
O= Observed relative frequency,
E=Expected frequency
Degrees of freedom for the test are calculated as n-1 and are 8 for the first digit frequencies. Critical values for the Pearson’s chi-squared test are 20.09 for 8 degrees of freedom respectively on a 1 percent level and 15.51 for the same degree of freedom on a 5 percent level.
If the value obtained by the chi-squared test exceeds the critical value, the null hypothesis is rejected. The chi-squared test is more reliable when testing smaller data samples Nigrini and Wells (2012).
6. Empirical Results
Table 3
|
Table 3 Descriptive Statistics |
|||||||
|
Symbol |
Mean |
Median |
Std. Dev. |
Skewness |
Kurtosis |
Jarque-Bera |
Probability |
|
ADA |
19.404 |
19.023 |
1.838 |
0.259 |
2.056 |
76.253 |
0.000 |
|
BNB |
19.471 |
19.372 |
1.614 |
-0.109 |
3.295 |
8.886 |
0.011 |
|
BTC |
23.614 |
23.795 |
0.881 |
-0.339 |
2.098 |
83.741 |
0.000 |
|
DOGE |
18.485 |
18.086 |
2.073 |
0.569 |
2.585 |
96.529 |
0.000 |
|
ETH |
22.793 |
22.962 |
1.030 |
-0.311 |
2.076 |
81.546 |
0.000 |
|
LTC |
21.256 |
21.540 |
1.047 |
-0.390 |
2.183 |
83.88 |
0.000 |
|
USDT |
23.653 |
24.016 |
1.425 |
-0.473 |
1.998 |
124.830 |
0.000 |
|
XRP |
21.162 |
21.216 |
1.088 |
0.040 |
2.850 |
1.909 |
0.384 |
Descriptive Statistics in Table 3 throws light on the structure of the data series. Log values of the volume data was taken to convert the entire dataset into the similar scale. The mean values hover between 19.4 and 23.65. The standard deviation shows the dispersion of the data series. Standard deviation shows that Dogecoin (2.073) had the highest variation when compared to other cryptos. Skewness shows the symmetry of the distribution.
All the cryptocurrencies have almost perfect symmetry as the skewness values are close to zero. While Cardano, Dogecoin and XRP showed positive skewness all other cryptocurrencies showed negative skewness. Kurtosis shows the peakedness of the distribution. None of the coins are leptokurtic (kurtosis values being significantly greater than 3) or mesokurtic (kurtosis values being equal to 0).
All the kurtosis values are positive with values ranging between 2.0 and 3.2. This shows all the coins have heavy tails where they have a lot of data in the tails. Jarque-Bera statistics shows that except for XRP all other coins are not normally distributed.
6.1. Conformity of trade volume of cryptocurrencies to Benford’s law
Table 4, Table 5 and Table 6 shows the actual and expected values of the first digits of each of the cryptocurrencies The tabular representation of actual and theoretical values of Benford’s law is shown in Table 4, Table 5 and Table 6.
From the table it is evident that the actual values either overflow or underflow when compared to the theoretical values. At times, both the values are almost similar.
Table 4
|
Table 4 First Digit Distribution
of Trade Volume Data |
||||||||||||
|
|
ADA |
BNB |
BTC |
|||||||||
|
Digits |
Actual |
Actual % |
Benford’s % |
Benford’s expected |
Actual |
Actual % |
Benford’s % |
Benford’s expected |
Actual |
Actual % |
Benford’s % |
Benford’s expected |
|
1 |
469 |
29.74% |
30.10% |
475 |
421 |
26.70% |
30.10% |
475 |
301 |
19.10% |
30.10% |
475 |
|
2 |
263 |
16.68% |
17.61% |
278 |
454 |
28.80% |
17.60% |
278 |
294 |
18.60% |
17.60% |
278 |
|
3 |
190 |
12.05% |
12.49% |
197 |
219 |
13.90% |
12.50% |
197 |
327 |
20.70% |
12.50% |
197 |
|
4 |
158 |
10.02% |
9.69% |
153 |
187 |
11.90% |
9.70% |
153 |
256 |
16.20% |
9.70% |
153 |
|
5 |
127 |
8.05% |
7.92% |
125 |
104 |
6.60% |
7.90% |
125 |
158 |
10.00% |
7.90% |
125 |
|
6 |
121 |
7.67% |
6.69% |
106 |
54 |
3.40% |
6.70% |
106 |
105 |
6.70% |
6.70% |
106 |
|
7 |
89 |
5.64% |
5.80% |
91 |
54 |
3.40% |
5.80% |
91 |
66 |
4.20% |
5.80% |
91 |
|
8 |
93 |
5.90% |
5.12% |
81 |
49 |
3.10% |
5.10% |
81 |
36 |
2.30% |
5.10% |
81 |
|
9 |
67 |
4.25% |
4.58% |
72 |
35 |
2.20% |
4.60% |
72 |
34 |
2.20% |
4.60% |
72 |
|
Total |
1577 |
100% |
100% |
1577 |
1577 |
100% |
100% |
1577 |
1577 |
100% |
100% |
1577 |
|
Source Calculation
by authors |
||||||||||||
Table 5
|
Table 5 First Digit Distribution of Trade Volume
Data |
||||||||||||
|
|
DOGE |
ETHEREUM |
LTC |
|||||||||
|
Digits |
Actual |
Actual % |
Benford’s % |
Benford’s expected |
Actual |
Actual % |
Benford’s % |
Benford’s expected |
Actual |
Actual % |
Benford’s % |
Benford’s expected |
|
1 |
593 |
37.60% |
30.10% |
475 |
662 |
42.00% |
30.10% |
475 |
291 |
18.45% |
30.10% |
475 |
|
2 |
224 |
14.20% |
17.61% |
278 |
351 |
22.30% |
17.60% |
278 |
452 |
28.66% |
17.61% |
278 |
|
3 |
144 |
9.13% |
12.49% |
197 |
114 |
7.20% |
12.50% |
197 |
328 |
20.80% |
12.49% |
197 |
|
4 |
123 |
7.80% |
9.69% |
153 |
77 |
4.90% |
9.70% |
153 |
181 |
11.48% |
9.69% |
153 |
|
5 |
126 |
7.99% |
7.92% |
125 |
69 |
4.40% |
7.90% |
125 |
119 |
7.55% |
7.92% |
125 |
|
6 |
129 |
8.18% |
6.69% |
106 |
88 |
5.60% |
6.70% |
106 |
79 |
5.01% |
6.69% |
106 |
|
7 |
99 |
6.28% |
5.80% |
91 |
86 |
5.50% |
5.80% |
91 |
48 |
3.04% |
5.80% |
91 |
|
8 |
66 |
4.19% |
5.12% |
81 |
62 |
3.90% |
5.10% |
81 |
43 |
2.73% |
5.12% |
81 |
|
9 |
73 |
4.63% |
4.58% |
72 |
68 |
4.30% |
4.60% |
72 |
36 |
2.28% |
4.58% |
72 |
|
Total |
1577 |
100% |
100% |
1577 |
1577 |
100% |
100% |
1577 |
1577 |
100% |
100% |
1577 |
|
Source Calculation
by authors |
||||||||||||
Table 6
|
Table 6 First Digit Distribution
of Trade Volume Data |
||||||||
|
|
USD |
XRP |
||||||
|
Digits |
Actual |
Actual |
Benford’s % |
Benford’s expected |
Actual |
Actual |
Benford’s % |
Benford’s expected |
|
1 |
318 |
20.20% |
30.10% |
475 |
562 |
35.64% |
30.10% |
475 |
|
2 |
365 |
23.10% |
17.60% |
278 |
355 |
22.51% |
17.61% |
278 |
|
3 |
233 |
14.80% |
12.50% |
197 |
206 |
13.06% |
12.49% |
197 |
|
4 |
200 |
12.70% |
9.70% |
153 |
124 |
7.86% |
9.69% |
153 |
|
5 |
131 |
8.30% |
7.90% |
125 |
70 |
4.44% |
7.92% |
125 |
|
6 |
103 |
6.50% |
6.70% |
106 |
77 |
4.88% |
6.69% |
106 |
|
7 |
91 |
5.80% |
5.80% |
91 |
58 |
3.68% |
5.80% |
91 |
|
8 |
73 |
4.60% |
5.10% |
81 |
64 |
4.06% |
5.12% |
81 |
|
9 |
63 |
4.00% |
4.60% |
72 |
61 |
3.87% |
4.58% |
72 |
|
Total |
1577 |
100% |
100% |
1577 |
1577 |
100% |
100% |
1577 |
|
Source Calculation by authors |
||||||||
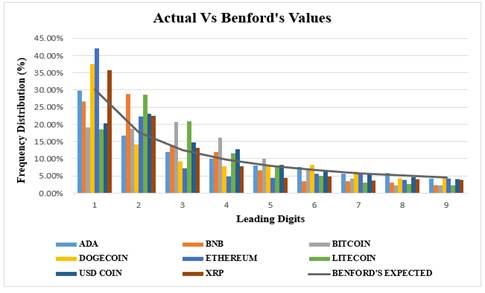
The graphical representation of the actual and Benford’s values are given below:
Figure1
|
Figure
1 First Digit Distribution of Cryptocurrencies |
Figure 1 shows the graphical representation of the conformity of the trade volume of cryptocurrencies to Benford’s law. The line graph shows the Benford’s expected values. The cryptocurrency wise interpretation of the graph is given below:
1) ADA or Cardano’s trade volume does not conform to Benford’s law. While digits 1,2,3,4,5 are way below the Benford’s law expectations, the later digits from 6 to 9 are almost close to the Benford values.
2) BNB – Digit 2 of BNB almost overflows when compared to the Benford’s values. Digits 1, 3,5,6,8 and 9 underflows. Digit 4 is almost close to the Benford values. Hence the overall dataset does not confirm to Benford values.
3) Bitcoin- The trade volume of bitcoin starting with digits 3 and 4 are way beyond the Benford’s value expectations. Digits 1,2,6,7,8 and 9 are too low when compared to the theoretical values. Only digit 5 is extremely close to the Benford values. The trade volume does not confirm to the Benford distribution.
4) Dogecoin – Digits 1, 6 and 9 are almost close to the Benford law values. Digits 2,3,4,5,7 and 8 are underflowing. The overall dataset partially conforms to Benford’s law.
5) Ethereum- Digit 1 of Ethereum has overflowed when compared to the Benford values. While digits 2, 7 and 9 are close to the theoretical values, digits 3,4,5,6 and 8 are way below the actual values.
6) Litecoin – Digits 2 and 3 have are extremely higher than Benford’s values. While digit 4 is almost close to the expected value, all the other digits have underflowed when compared to Benford’s distribution. The volume dataset does not conform to Benford’s values.
7) USD coins – USD coins seems to be the only coin in the sample that almost conforms to the theoretical values of the Benford’s distribution. While digits 2 and 4 slightly exceeds the Benford’s values, digit 1 is lower than the expected values. All the other digits are almost close to the Benford values.
8) XRP- Digits 1 and 2 of XRP have highly exceeded the expected Benford’s values. While digit 3 almost touches the theoretical values, all the other digits have underflowed when compared to the theoretical distribution.
6.2. Statistical test for checking conformity to Benford’s law
The statistical test used for checking the conformity of actual trade volume to Benford’s law expectations is chi-square test. The hypothesis tested is given below:
H0: The distribution of first digits of trade volume of cryptocurrencies are in accordance with Benford’s law
Table 7
|
Table 7 Conformity
Test for All Cryptocurrencies Using Chi-Square Statistic |
|||||||||||
|
|
Chi-Square Statistics of The First Digit |
|
|
||||||||
|
Symbols |
1 |
2 |
3 |
4 |
5 |
6 |
7 |
8 |
9 |
|
p value |
|
XRP |
16.05 |
21.52 |
0.41 |
5.44 |
24.11 |
7.73 |
12.24 |
3.44 |
1.73 |
92.66 |
0.00 |
|
USDT |
51.74 |
27.44 |
6.56 |
14.56 |
0.30 |
0.06 |
0.002 |
0.72 |
1.162 |
102.5 |
0.994 |
|
LTC |
71.10 |
109.41 |
87.06 |
5.19 |
0.28 |
6.69 |
20.65 |
17.59 |
18.12 |
336.0 |
0.00 |
|
ETH |
73.88 |
19.35 |
34.99 |
37.62 |
25.00 |
2.93 |
0.33 |
4.32 |
0.24 |
198.6 |
0.00 |
|
DOGE |
29.47 |
10.38 |
14.27 |
5.82 |
0.01 |
5.20 |
0.62 |
2.67 |
0.01 |
68.45 |
0.00 |
|
BTC |
63.57 |
0.96 |
85.74 |
69.65 |
8.79 |
0.00 |
7.08 |
24.73 |
20.18 |
280.7 |
0.00 |
|
BNB |
6.07 |
111.93 |
2.45 |
7.64 |
3.48 |
25.19 |
15.33 |
12.43 |
19.13 |
203.6 |
0.00 |
|
ADA |
0.069 |
0.778 |
0.251 |
0.175 |
0.036 |
2.254 |
0.066 |
1.885 |
0.369 |
5.883 |
0.66 |
|
Source
Calculation by authors |
|||||||||||
From the chi-square statistics, it is evident that only USDT and ADA are the only two cryptocurrencies that follow the Benford’s distribution. The rest of them have statistically significant values showing that they do not conform to Benford’s law. The results reject the null hypothesis that the distribution of first digit’s trade volume of cryptocurrencies is in accordance with Benford’s law with respect to XRP, Litecoin, Ethereum, DOGE, Bitcoin and BNB. This indicates that except for Cardano and USDT all the other cryptocurrencies have a probable chance of being manipulated. This warrants a further in-depth investigation using different methods such as machine learning and graph-based searching.
7. Conclusion
The main purpose of the study was to apply Benford’s law to the trade volume of cryptocurrencies as a method for preliminary screening. From the chi square statistics, it is evident only USDT, and Cardano (ADA) are the two digital coins whose volumes conform to Benford’s values. Whereas XRP, Litecoin (LTC), Ethereum (ETH), DOGE, Bitcoin (BTC), and BNB do not conform to Benford’s distribution. However, failure to comply with Benford’s law does not imply the existence of fraud Vičič and Tošić (2021). The non-conformity may be a false alarm and there may not be any manipulation. However, this method may be used as the pre-requisite for fine-grain screening such as machine learning and graph-based searching.
CONFLICT OF INTERESTS
None.
ACKNOWLEDGMENTS
None.
REFERENCES
Aloosh, A., and Li, J. (2019). Direct Evidence of Bitcoin Wash Trading. SSRN, April, 1–51. https://dx.doi.org/10.2139/ssrn.3362153.
Balamurugan, A., Harish, A., and Gandhi, S. (2019). Application of Benford’s Law on Stock Turnover. International Journal of Business and Management Invention, 8(01), 63–67.
Corazza, M., and Ellero, A. (2008). Checking Financial Markets Via Benford’s Law. Services. Economía.Unitn.It, 1–4. http://dx.doi.org/10.1007/978-88-470-1481-7_10.
Jayasree, M., Jyothi, C. S. P., and Ramya, P. (2018). Benford’s Law and Stock Market—The Implications for Investors: The Evidence From India Nifty Fifty. Jindal Journal of Business Research, 7(2), 103–121. https://doi.org/10.1177/2278682118777029.
Karavardar,
A. (2014). Benford’s Law and An Analysis in Istanbul Stock Exchange (BIST).
International Journal of Business and Management, 9(4), 160–172. https://doi.org/10.5539/ijbm.v9n4p160.
Newcomb, S. (1881). Note on The Frequency of Use of The Different Digits in Natural Numbers. American Journal of Mathematics, 4(1/4), 39–40. https://doi.org/10.2307/2369148.
Nigrini, M., and Wells, J. (2012). Benford’s Law – Application for Forensic Accounting, Auditing, and Fraud Detection. John Wiley and Sons.
Peterson, T. (2020). Benford’s Law Suggests Bitcoin’s Price Manipulation – Quantpedia. Quantpedia.
Rauch, B., Goettsche, M., and El Mouaaouy, F. (2013). LIBOR Manipulation Empirical Analysis of Financial Market Benchmarks Using Benford’s Law. SSRN Electronic Journal. https://doi.org/10.2139/ssrn.2363895.
Vaasa. (2019). Assessing The Conformity of Cryptocurrency Market Data With Benford’s Law.
Vičič,
J., and Tošić, A. (2021). Application of Benford’s Law on
Cryptocurrencies. Journal of Theoretical and Applied Electronic Commerce
Research, 17(1), 313–326.
https://doi.org/10.3390/jtaer17010016.
What is Market Manipulation in Cryptocurrency? (2021). Binance Blog.
|
|
 This work is licensed under a: Creative Commons Attribution 4.0 International License
© IJETMR 2014-2022. All Rights Reserved.