
|
|
|
|
An Efficient Compromised Imputation Method for Estimating Population Mean
Sandeep Mishra 1 ![]()
![]()
1 Association of Indian Universities, New Delhi, India
|
|
|
ABSTRACT |
|
|
This paper
suggests a modified new ratio-product-exponential imputation procedure to
deal with missing data in order to estimate a finite
population mean in a simple random sample without replacement. The bias and
mean squared error of our proposed estimator are obtained to the first degree
of approximation. We derive conditions for the parameters under which the
proposed estimator has smaller mean squared error than the sample mean,
ratio, and product estimators. We carry out an empirical study which shows
that the proposed estimator outperforms the traditional estimators using real
data. |
|||
|
Received 16 July 2022 Accepted 19 August 2022 Published 05 September 2022 Corresponding Author Sandeep
Mishra, smisra1983@yahoo.co.in DOI10.29121/ijetmr.v9.i9.2022.1216 Funding: This research
received no specific grant from any funding agency in the public, commercial,
or not-for-profit sectors. Copyright: © 2022 The
Author(s). This work is licensed under a Creative Commons
Attribution 4.0 International License. With the
license CC-BY, authors retain the copyright, allowing anyone to download,
reuse, re-print, modify, distribute, and/or copy their contribution. The work
must be properly attributed to its author.
|
|||
|
Keywords: Missing Data,
Mean Square Error, Imputation, Bias, Ratio Estimator |
|||


1. INTRODUCTION
Imputation means
replacing a missing value with another value based on a reasonable estimate.
Information on the related auxiliary variable is generally used to recreate the
missing values for completing datasets. Incomplete data is usually categorized
into three different response mechanisms: Missing Completely at Random (MCAR);
Missing at Random (MAR); and Missing Not at Random (MNAR or NMAR) Little and Rubin (2002). Missing completely at random (MCAR): Missing
data are randomly distributed across the variable and unrelated to other
variables. Missing at random (MAR): Missing data are not randomly distributed
but they are accounted for by other observed variables. Missing not at random
(MNAR): Missing data systematically differ from the observed values. From the
above-mentioned classifications of missing data, we, in the present study, have
assumed MCAR.
Auxiliary
information is important for survey practitioner as it is utilized to improve
the performance of the methods. It may be utilized at the design stage or the
estimation stage of the survey to get the more efficient estimator. At
estimation stage ratio, product and regression methods are traditionally used. Bhal
and Tuteja (1991) introduced
exponential ratio and product estimator for estimation of population mean. Many
modifications have been proposed using these methods till date. For handling
missing data on the study variable several extensions and developments were
proposed in the literature. Singh (2003) suggested
product estimation for imputation. Shakti Prasad (2018) adapts exponential
product type estimator given by Bahal and Tuteja (1991) and
proposed exponential estimators for imputation. Kadilar and Cingi (2008) investigated some ratio-type imputation
methods and proposed three new estimators to overcome the problem of the
missing data. Diana and Perri (2010)
proposed three regression type estimators which were
more efficient than the Kadilar and Cingi (2008). The
present article suggests a general ratio product exponential type method of
imputation and accordingly proposed three estimators using the different amount
of available auxiliary information as utilized by Ahmad
et al. (2006), Kadilar and Cingi (2008), and Diana and Perri (2010). The proposed methods are
than compared by traditional procedure of imputation. The proposed estimators
come out to be more efficient than the usual ratio, product, regression, and
exponential method for handling missing observations to estimate the population
mean.
Given a finite population ![]() ,
the objective is to estimate the
population mean
,
the objective is to estimate the
population mean ![]() . A
simple random sample wor,
. A
simple random sample wor, ![]() ,
of size
,
of size ![]() is drawn from the population
is drawn from the population ![]() .
Let the responding units be
.
Let the responding units be ![]() from the
from the ![]() sampled units. Let us denote
sampled units. Let us denote ![]() as the set of responding units and
as the set of responding units and ![]() the set of non-responding units, i.e.,
the set of non-responding units, i.e., ![]() is observed for
is observed for ![]() but for units in
but for units in ![]() the values are not available and hence imputed
values are derived by some method. In this paper we shall use the following
notations:
the values are not available and hence imputed
values are derived by some method. In this paper we shall use the following
notations:
![]() : Population
Size;
: Population
Size; ![]() Sample size;
Sample size; ![]() : Number of
responding units;
: Number of
responding units; ![]() : Population
means of study variate
: Population
means of study variate ![]() and auxiliary variate
and auxiliary variate ![]() respectively;
respectively; ![]() : Standard Deviation of study variate
: Standard Deviation of study variate ![]() and auxiliary variate
and auxiliary variate ![]() respectively;
respectively; ![]() : Coefficient
of variation of study variate
: Coefficient
of variation of study variate ![]() and auxiliary variate
and auxiliary variate ![]() respectively;
respectively; ![]() : Correlation
coefficient between
: Correlation
coefficient between ![]() and
and ![]() ;
; ![]() .
.
2. Some
existing methods of imputation
1)
The mean method of imputation suggests replacing the
missing observations with the mean of the observations available on response
units i.e.
Then the estimator of the population mean ![]() is given by
is given by
![]() and its MSE is given by
and its MSE is given by
![]() (1.1)
(1.1)
2)
The ratio method of imputation uses information on one auxiliary
variable ![]() and calculates the missing values by
and calculates the missing values by
![]()
Where ![]()
This gives the resulting estimator by
![]()
The MSE of ![]() is given by
is given by
![]() (1.2)
(1.2)
It is noted that, in the presence of missing data, the
availability of information on auxiliary variable ![]() in the data set supports
suggesting efficient estimators.
in the data set supports
suggesting efficient estimators.
3) Diana
and Perri (2010) proposed three estimators as by using different regression-type
method of imputation such that the imputed data is given by
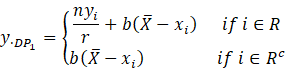
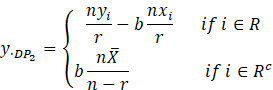
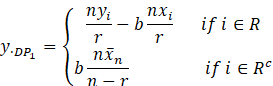
For these
methods the resulting estimators are
![]()
![]()
![]()
![]() (1.2)
(1.2)
![]() (1.3)
(1.3)
![]() (1.4)
(1.4)
They proved
that the suggested estimators are more efficient than the Kadilar and Cingi (2008) estimators. ![]() is always more efficient
than both
is always more efficient
than both ![]() and
and ![]() , whereas
, whereas ![]() perform better than
perform better than ![]() if the condition
if the condition
![]()
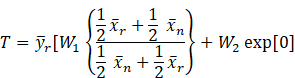
3. The proposed Estimator
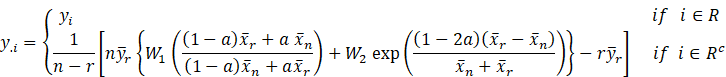
With the above
imputation method, the resulting estimator of the population mean ![]() is obtained as
is obtained as
 (2.1)
(2.1)
![]() and
and ![]() are constant chosen
suitably so that their choice minimizes the mean square error of the resultant
estimator and
are constant chosen
suitably so that their choice minimizes the mean square error of the resultant
estimator and ![]() is a real constant. Our
goal in this paper is to discuss the suggested estimators for different values
of
is a real constant. Our
goal in this paper is to discuss the suggested estimators for different values
of ![]() and have a comparative
study of the suggested estimator for these values of
and have a comparative
study of the suggested estimator for these values of ![]() in order
to get the minimum MSE.
in order
to get the minimum MSE.
4. First
Degree Approximation to the Bias
To derive the Bias and MSE expressions of the proposed estimator ![]() upto
upto ![]() , we define
, we define
![]()
Thus, we have ![]()
The expectation of these ![]() are
are ![]()
And under simple random sampling without replacement,
![]()
![]()
where ![]() ,
, ![]()
![]() .
. ![]()
Now representing (2.1) in terms of ![]() , we have
, we have

![]()

We assume that the sample is large enough to make ![]() and
and ![]() so small that contributions from powers of
degree higher than two are negligible. By retaining powers up to
so small that contributions from powers of
degree higher than two are negligible. By retaining powers up to ![]() and
and ![]() , we get
, we get


 (2.2)
(2.2)
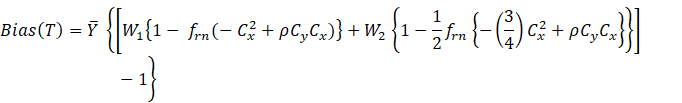
Theorem 2.1. The
conditional bias up to the first order of approximation of the estimator ![]() is given by the estimator
is given as
is given by the estimator
is given as
![]()
Where ![]() and
and ![]()
Proof: From (2.2) we have
 (2.3)
(2.3)
Taking expectation on both side we obtain the bias of ![]() to order
to order ![]() as
as

 (2.4)
(2.4)
Letting ![]() ,
, ![]() in eq. (A.1)
in eq. (A.1)
![]()
5. Mean
Squared Error of T
We calculate the mean squared error of ![]() up to order
up to order ![]() by
squaring (2.2) and retaining terms up to squares in
by
squaring (2.2) and retaining terms up to squares in ![]() and
and ![]() , and then
taking the expectation. This yields the first-degree approximation of the MSE
, and then
taking the expectation. This yields the first-degree approximation of the MSE
Theorem 2.2. The minimum mean square
error of the proposed estimator ![]() is given by
is given by
![]()
The optimum values of ![]() and
and ![]() are:
are:
![]()
Where
![]()
![]()
, ![]()
![]()
![]()
And the minimum MSE of the proposed estimator
is given by
![]()
Proof:
 (A.2)
(A.2)
Let coefficient
of ![]() and
and ![]() in eq. (A.2) are
in eq. (A.2) are ![]() and
and ![]() respectively then
respectively then ![]() is
is
![]()
![]()
![]() (2.5)
(2.5)
Now, let


![]()
![]()
![]()
![]()
![]()


![]()

![]()
From
previous theorem
![]() ,
,
Placing these values of ![]() in (A.2) we get
in (A.2) we get
![]()
![]()
Differentiating MSE with respect to ![]() and
and ![]() ,
and equating to zero, we get
,
and equating to zero, we get
![]()
![]()
On
solving these equations, we get
![]()
And
after placing the values of ![]() and
and ![]() from () to the expression
of MSE (?) the minimum MSE expression is
from () to the expression
of MSE (?) the minimum MSE expression is
![]()
6. Expressions of MSE for different choices of ![]()
Here we consider the
different forms of the proposed estimator for various values of ![]() .
.
Case 1. ![]()
![]()
![]()
![]()
![]()
![]()
![]() ,
, ![]()
![]()
![]()
![]()

![]()
Which is better
than the mean estimator ![]() in terms of efficiency as
in terms of efficiency as
![]()
And if ![]() , The proposed estimator
at
, The proposed estimator
at ![]() is equivalent to the mean
estimator
is equivalent to the mean
estimator![]()
Case 2. ![]()
![]()
![]()
![]()
![]()
, ![]()
![]()
![]()
![]()
![]()
For ![]()
![]()
![]()
![]()
![]()
For ![]()
![]()
![]()
![]()
Case 3. ![]()
![]()
A linear
combination of product estimator and product type exponential estimator,
![]() ,
, ![]()
![]()
![]()
![]()
![]()
, ![]()
![]()
![]()
and further
For ![]() it reduces to product
estimator
it reduces to product
estimator
![]()
![]()
![]()
and for ![]() it reduces to product type exponential estimator
it reduces to product type exponential estimator
![]()
![]()
![]()
![]()
For the purpose of
comparison of the proposed estimator we conducted the empirical study and
computed the Percentage relative efficiency (PRE) of the estimators ![]() ,
, ![]() ,
, ![]() for (i) real data and (ii) artificially generated data.
for (i) real data and (ii) artificially generated data.
The empirical study has been carried out to
illustrate and compare the performance of the proposed imputation methods with
the existing conventional imputation methods and the method proposed by Diana and Perri (2010) and Bhushan and Pandey (2010) utilizing Searl () constant with the Diana and Perri (2010)
estimator for
(i) real data described in Horvitz
and Thompson (1952), Singh (2003), described in Table 1, Table 2.
Table 1
|
Table 1 Description of Populations considered
for empirical study |
||
|
Population 1 |
Population 2 |
|
|
Description |
Horvitz and Thompson (1952),
|
Singh (2003, pp 1114), the
season-average price for commercial crop: season average price in $ per pound,
by states,1994-96; |
|
|
20 |
36 |
|
|
7 |
18 |
|
|
5 |
8 |
|
|
21.15 |
0.2033 |
|
|
19.7 |
0.1856 |
|
|
94.028947 |
0.006458 |
|
|
61.8 |
0.005654 |
|
|
0.8526154 |
0.8775 |
2)
Ratio Method of imputation, ![]()
3)
Diana and Perri method of imputation ![]()
4)
Diana and Perri method of imputation ![]()
5)
Diana and Perri method of imputation ![]()
6)
Proposed method of imputation, ![]()
![]()
Table 2
|
Table 2 Mean square error and percent relative
efficiency based on Population I(Singhpop) |
|||||
|
Estimator |
MSE |
PRE |
MSE |
PRE |
|
|
|
0.000627874 |
100 |
14.1043421 |
100 |
|
|
|
0.00029219 |
214.8858518 |
10.2000587 |
138.2771 |
|
|
|
0.00048973 |
128.2082427 |
7.75712694 |
181.8243 |
|
|
|
0.000144369 |
434.9080453 |
3.85114837 |
366.2373 |
|
|
|
0.000282514 |
222.2456233 |
10.1983635 |
138.3001 |
|
|
|
|
MSE
and PRE of Proposed Estimator for different choices of |
|||
|
-1 |
*-0.000109667 |
*-572.5264505 |
*-5.07540636 |
*-277.8958 |
|
|
-0.9 |
*-5.54806E-05 |
*-1131.701446 |
*-2.98949277 |
*-471.7972 |
|
|
|
-0.8 |
*-1.13765E-05 |
*-5519.055982 |
*-1.36603234 |
*-1032.5043 |
|
-0.7 |
2.43566E-05 |
2577.844737 |
*-0.09897433 |
*-14250.5046 |
|
|
-0.6 |
5.31303E-05 |
1181.763804 |
0.89001809 |
1584.7253 |
|
|
-0.5 |
7.61179E-05 |
824.8708681 |
1.66003196 |
849.6428 |
|
|
-0.4 |
9.4301E-05 |
665.8194857 |
2.25644120 |
625.0702 |
|
|
-0.3 |
0.000108506 |
578.656658 |
2.71463222 |
519.5673 |
|
|
-0.2 |
0.00011943 |
525.7257808 |
3.06257328 |
460.5389 |
|
|
-0.1 |
0.000127667 |
491.8054912 |
3.32262502 |
424.4939 |
|
|
0 |
0.000133722 |
469.5370246 |
3.51284069 |
401.5082 |
|
|
0.1 |
0.000138025 |
454.8999563 |
3.64791560 |
386.6411 |
|
|
0.2 |
0.000140943 |
445.4819583 |
3.73989064 |
377.1325 |
|
|
0.3 |
0.000142789 |
439.7214493 |
3.79868012 |
371.2959 |
|
|
0.4 |
0.00014383 |
436.5391782 |
3.83247219 |
368.0220 |
|
|
0.5 |
NaN |
#VALUE! |
NaN |
- |
|
|
0.6 |
0.000144359 |
434.9406963 |
3.85095252 |
366.2559 |
|
|
0.7 |
0.00014419 |
435.4483623 |
3.84580584 |
366.7461 |
|
|
0.8 |
0.000143911 |
436.2925635 |
3.83631355 |
367.6535 |
|
|
0.9 |
0.00014362 |
437.1774822 |
3.82543836 |
368.6987 |
|
|
1 |
0.000143389 |
437.8833031 |
3.81546698 |
369.6623 |
|
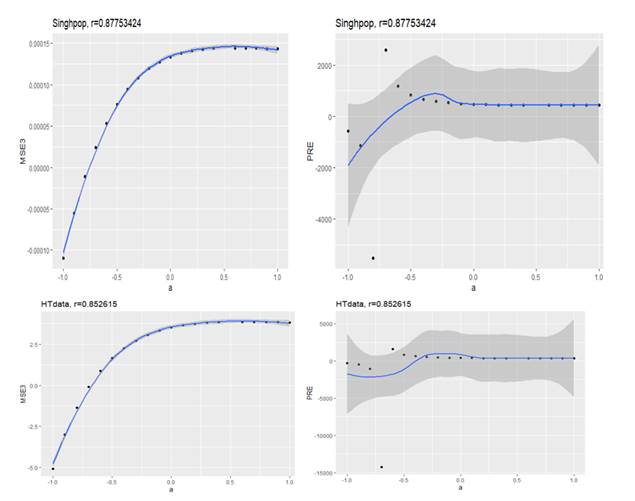
8. Interpretations of the computational results
The
following interpretations may be read out from above Tables:
1) For the real
populations, HT data and Singh Population where the correlation between ![]() and
and ![]() is 0.852615 and 0.877534, the results are
shown in Table 1. It is clear that the proposed imputation method
is 0.852615 and 0.877534, the results are
shown in Table 1. It is clear that the proposed imputation method ![]() is superior to all the imputation methods i.e.,
is superior to all the imputation methods i.e.,
![]() and the
imputation methods suggested by Diana and Perri
and the
imputation methods suggested by Diana and Perri ![]() for a wide choice of the constant
for a wide choice of the constant ![]() for the proposed estimator.
for the proposed estimator.
CONFLICT OF INTERESTS
None.
ACKNOWLEDGMENTS
None.
REFERENCES
Heitjan, D.F. and Basu, S. (1996). Distinguishing 'Missing at Random' and 'Missing Completely at Random'. The American Statistician. 50(3), 207-213. https://doi.org/10.1080/00031305.1996.10474381.
Horvitz, D. G. and Thompson, D.J. (1952). A Generalization of Sampling Without Replacement From a Finite Universe. Journal of the American Statistical Association, 47(260), 663-685. https://doi.org/10.1080/01621459.1952.10483446.
Lee, H., Rancourt, E., and Sarndal, C.E. (1994). Experiments with Variance Estimation from Survey Data with Imputed Values. Journal of Official Statistics,10(3),231-243.
Rubin, R. B. (1978). Multiple Imputation for Nonresponse in Surveys. New York : John Wiley.
Singh, S. (2003). Advanced Sampling Theory with Applications. How Michael Selected Amy. Kluwer, Dordrecht, 1(2). https://doi.org/10.1007/978-94-007-0789-4.
Singh, S. and Horn, S. (2000). Compromised Imputation in Survey Sampling. Metrika, 51, 267-276. https://doi.org/10.1007/s001840000054.
|
|
 This work is licensed under a: Creative Commons Attribution 4.0 International License
© IJETMR 2014-2022. All Rights Reserved.