
|
|
|
|
THE ANALYSIS OF CLIMATE VARIABILITY ON AQUACULTURE PRODUCTION IN KARACHI OF PAKISTAN
Maliha Afreen 1, İlknur Ucak 1, M. Cuneyt Bagdatli 2![]()
![]()
1 Nigde Omer Halisdemir University, Faculty of Agricultural Sciences and Technologies, Nigde, Turkey
2 Nevsehir Hacı Bektas
Veli University, Engineering and Architecture
Faculty, Department of Biosystem Engineering, Nevsehir,
Turkey
|
|
|
ABSTRACT |
|
|
Aquaculture is a developing sector in Pakistan. Aquaculture based on river and seas and Pakistan has both these sources of water. In Pakistan Arabian sea exist in Karachi (Sindh) and Gwadar (Baluchistan). Karachi is a big city and known as backbone of Pakistan. There are two ports are available on Karachi coastline Karachi port and port Bin Qasim. Because Karachi is an industrial city so there are many climatic variabilities occur in Karachi due to global warming. Excretion of wastes in marine water also badly effected aquaculture production. Due to global warming, there are many climatic factors can be changed including temperature, rainy days, humidity, precipitation and sunny days. Due to lack of rain Aquaculture also can be affected by drought in Karachi. In this article we observed effects of climatic changings on Aquaculture production in Karachi Pakistan. It was found that Precipitation has highest value of standard deviation as compared to all other variable factors. According to regression analysis values, it was concluded that only sunny days actual values are closer to predicted values to some extent. |
|||
|
Received 13 July 2022 Accepted 15 August 2022 Published 27August 2022 Corresponding Author M. Cuneyt Bagdatli, cuneytbagdatli@gmail.com DOI 10.29121/ijetmr.v9.i8.2022.1210 Funding: This research
received no specific grant from any funding agency in the public, commercial,
or not-for-profit sectors. Copyright: © 2022 The
Author(s). This work is licensed under a Creative Commons
Attribution 4.0 International License. With the
license CC-BY, authors retain the copyright, allowing anyone to download,
reuse, re-print, modify, distribute, and/or copy their contribution. The work
must be properly attributed to its author.
|
|||
|
Keywords: Climate
Variability, Aquaculture Production, Karachi, Pakistan |
|||


1. INTRODUCTION
Aquaculture is not emerging but still growing sector all over the world. Many anthropogenic factors cause ecological misbalance of the aquatic ecosystem and variety of biota Farombi et al. (2007), Forstner and Wittmann (1983). Sea is a valuable gift of nature to the human beings. Heavy metals have the propensity to gather in many aquatic organisms, and it depends upon the ingestion and the exclusion from the body Karadede et al. (2004).
In sea Metal pollution is less evident and uninterrupted than other kinds of pollution but its special effects can be rigorous on marine environment and on human beings by fish eating Ikem and Egiebor (2005).
It is stated that natural threats like tsunamis, typhoons, earthquakes, floods, and some other enticing natural catastrophes often happened in the past and affected heavy production of the fishery Wan and Chen (2011). Likewise, it has been established that marine climate variability produced by human activities are alarming for fishery resources Mckelvey and Golubtsov (2015), Martinet et al. (2015). A crucial point is a rise in sea-level due to climate variability. It directly causes the damage of mangroves forest which is main source of food, fuel and wood in Pakistan. It is also the upbringing place for 90 percent of native shrimps Chaudhry (2017). Thus, saving of mangrove forests is significant for growth of shrimp fishery reserve in Pakistan Farooqi et al. (2005).
The variety of fish species beside the coastline of Pakistan is facing pressures from natural aspects include temperature, wave stroke, salinity variations, and seasonal dispersion of anoxic waters escalating from sea depths Haq et al. (1997). Marine ecosystem is affected by global warming produced by emission of carbon dioxide and other greenhouse gases. Sindh is mostly affected with many indicators of Climate Change like increased erraticism of river streams and floods, drought and heat waves. Beside the Karachi coastline Sea level, the has escalated about 10 centimetres in the last century and is estimated to more escalate to 60 centimetres by the end of the century to intimidate the low land coastal zones south of Karachi on the way to Keti Bander and the Indus River estuary disturbing the infrastructure and living beings in these areas. It is expected that at the end of this century, the yearly mean temperature rises by 3°C to 5°C. Acidic and warmer oceans are probably disturb coastline and marine ecosystems. There are numerous climate variability aspects that have an influence on the fish productivity like water currents, winds, temperature, and rainfall Chaudhry (2017).
Aquaculture is mostly affected by high temperatures, varying evaporation degrees, decreased rainfall and challenging needs of water consumption WWF (2014). The objective of this study is to examine the effects of climatic changing factors on aquaculture production in Karachi city of Pakistan.
2. MATERIAL and METHOD
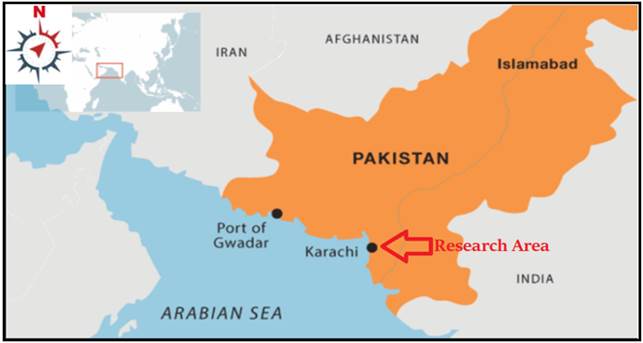
Karachi is the main city in Pakistan and the twelfth-largest city in the world. Karachi: The Backbone of Pakistan" (2020). It is the capital of Sindh province Pakistan. Karachi is the center of Pakistan's leading financial and industrial PIGJE, (2016) with an assessed GDP of 164 billion dollar as of 2019 and known as beta-global city GAWC (2010). Karachi is Pakistan's most diverse city in terms of linguistics, ethnics, and religions Welle (2016).
It is located on the Arabian Sea, Karachi helps as a transport center, because of containing Pakistan's two biggest seaports, the Port of Karachi and Port bin Qasim, and also have Jinnah International Airport which is a busiest airport of Pakistan Abbas and Qaswar. (2016). The area of fish-processing in Pakistan is extremely resolute in Karachi as compared to other cities. In Pakistan total registered importers and exporters are 183, from which 175 are placed in Karachi. Around 104 are dealers only, 77 have a packing or processing facility and 2 are fishmeal operatives Sea-Ex (2017). Figure 1 shows the location of Karachi city in map.
Figure 1
|
Figure
1 The Location
of Research Area in Karachi of Pakistan |
In this article we focused on climatic variability effects on aquaculture production in Karachi Pakistan. We calculated obtained data through standard deviation and regression analysis. The standard deviation (SD) shows that at which the range data is scattering, usually related to the mean significance of the data set Whitley and Ball (2002), Vetter (2017).
The linear regression was firstly recommended in 1894 by Sir Francis Galton. It is a statistical test used to find out the relation between the measured variables. It is denoted by the mathematical equation, i.e., y = mx + c. The regression coefficient (R2) indicates the level of variability of y due to x Schneider et al. (2010).
3. RESEARCH FINDINGS
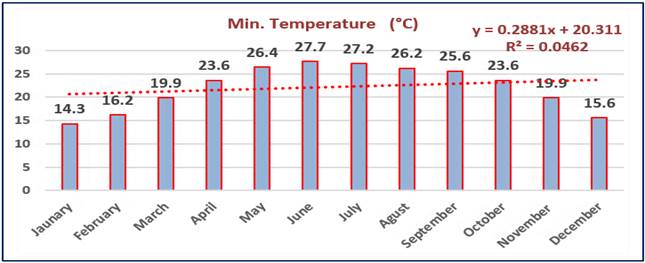
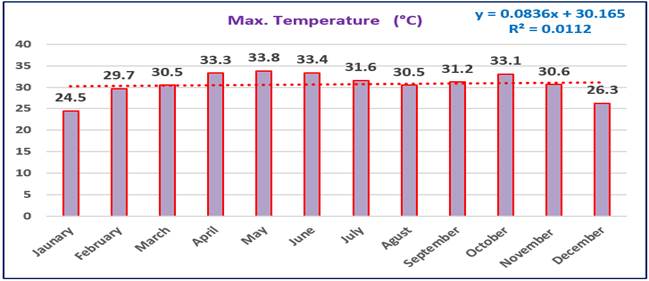
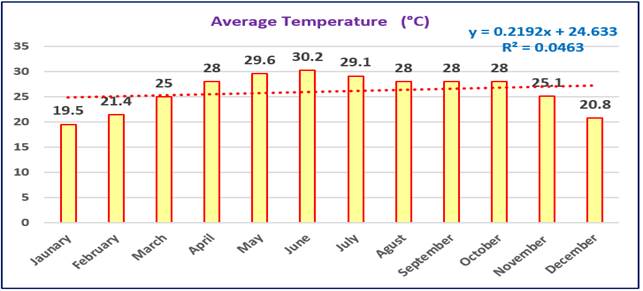
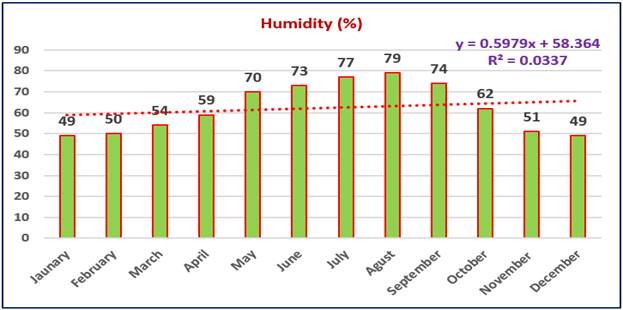
Figure 2, Figure 3, Figure 4, Figure 5, Figure 6, Figure 7 and Figure 8 shows the climatic variability data including Min. Temperature (°C), Max. Temperature (°C), average Temperature (°C), Precipitation (mm), Rainy Days, Humidity (%), and Sunny Hours of whole year. When we see on standard deviation minimum temperature has more variability than average temperature, and maximum temperatures but has low value as compared to Precipitation and Humidity.
Rainy days and sunny hours have lower values as compared to all other variables which means these variables has very less variability in all months of whole year whether Precipitation varied so much because it has highest value of standard deviation. Table 1 shows the average values and Standard deviation of some Climate variability data in Karachi city.
Table 1
|
Table 1 The Average or Total
Values and Standard Deviation of Some Climate Data in Karachi |
||
|
Climate Parameters |
Standard deviation |
|
|
Min. Temperature(°C) |
22.18 |
4.8328 |
|
Max. Temperature (°C) |
30.71 |
2.8503 |
|
Average Temperature (°C) |
26.06 |
3.6734 |
|
Precipitation (mm) (Total) |
145.00 |
18.6521 |
|
Humidity (%) |
62.25 |
11.7483 |
|
Rainy Days (Total) |
13 |
1.6765 |
|
Sunny Days (hour) |
9.30 |
1.1924 |
Values of all climatic variables data also explained by making linear regression analysis between months and climatic change variables individually. Where R2 values shows that whether these climatic variables are closer to predicted values of regression line or not. After observing R2 we found that all of these variable actual values are not closer to predicted values. Sunny days has higher R2 value followed by min. temperature, average temperature, humidity, precipitation, and max temperature while rainy days has error in R2 value because there was no rain was found in months of march, April and may in Karachi city.
Which means only Sunny days actual values are closer to predicted values to some extent. It concluded that due to climatic change actual values of climatic variables are extremely changing. In this study, linear regressions and standard deviations of climate data were calculated.
Figure 2
|
Figure
2 Minimum Temperature
Distribution in Karachi |
Figure 3
|
Figure
3 Maximum Temperature
Distribution in Karachi |
Figure 4
|
Figure
4 Average Temperature
Distribution in Karachi |
Figure 5
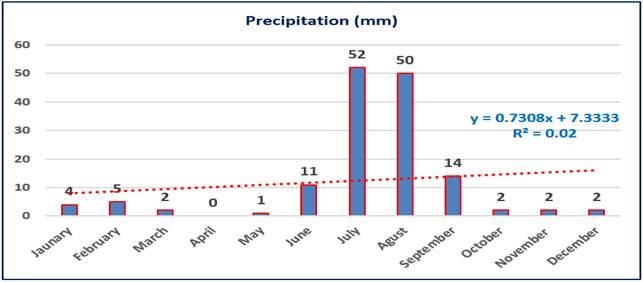
|
Figure
5 Precipitation
Distribution in Karachi |
Figure 6

|
Figure
6 Rainy Days
Distribution in Karachi |
Figure 7
|
Figure
7 Humidity
Distribution in Karachi |
Figure 8
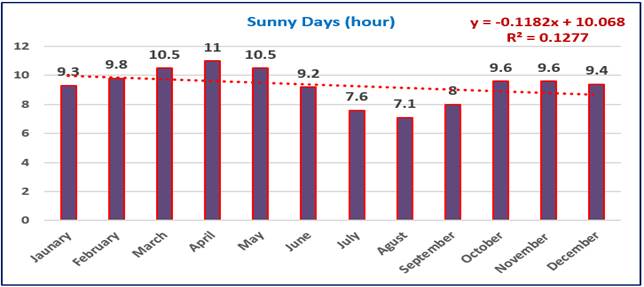
|
Figure
8 Sunny Days
Distribution in Karachi |
In one study Fishes of different lengths (cm) and weights (g) were collected of five years from the Karachi coast in August 2006 to December 2011. The fishes were gathered for four seasons of Pakistan (winter, autumn, summer, spring) for consideration of heavy metals. Analysis of variance (ANOVA) was used to check the variance between samples to check the significance of changes between seasons, organs and metals.
The metal interface with season, year and tissues, were found significant in Rastrelliger kanagurta fish for Mn, Fe, Zn and Cu. Fish and shellfish store metals to higher level in different body organs as compared to exist in sediment or water Gungum et al (1994), Khaled (2004) under many environmental situations such as pH. Salinity and Metal storage in the aquatic organisms up to toxic level which can cause harm for ecosystem Guven et al. (1999). These all samples were found significantly different in fish organs in different seasons Ahmed et al. (2014).
In another study seasonal changes (pre-monsoon, monsoon, & post-monsoon) were observed in different types of sea cucumbers species in the coastline waters of Karachi, Pakistan. The temperature of water was higher in monsoon than pre-monsoon and post-monsoon. It was found that only Holothuria arenicola, have significantly negative correlation between Krel and temperature. Specifically lower gonad index values were found during winter season (post-monsoon) and higher during summer season (monsoon) Siddique et al. (2014), with the lower Krel values, and higher Krel values respectively Ahmed et al. (2018).
4. CONCLUSION and RECOMMENDATIONS
It was concluded from this study that Precipitation has highest value of standard deviation as compared to all other variable factors. According to regression analysis values, it was concluded that only Sunny days actual values are closer to predicted values to some extent. The obtained value of rainy days in regression analysis has given error because there was no rain was observed in months of march April and may. It concluded that due to climatic change actual values of climatic variables are extremely changing. It is essential to improve more inclusive aquaculture extension lead and training program in Pakistan. This would support increase capability by training trainers from out of the Pakistan in bordering countries that have innovative aquaculture industries.
CONFLICT OF INTERESTS
None.
ACKNOWLEDGMENTS
None.
REFERENCES
Abbas and Qaswar. (2016). Karachi : World's Most Dangerous City, India Today. Karachi, Pakistan's Largest City, with a Population of Approx. 3.0 Crore.
Ahmed, Q., Alicia, PS, Ali, QM, and Levent, BAT (2018). Seasonal Variation in the Length-Weight Relationships And Condition Factor Of Four Commercially Important Sea Cucumbers Species from Karachi Coast-Northern Arabian Sea. Natural and Engineering Sciences, 3(3), 265-281. https://doi.org/10.28978/nesciences.468667
Ahmed., Q., Yousuf, F., Sarfraz, M., Bakar, N. K. A., Balkhour, M. A., And Ashraf, M. A. (2014). Seasonal Elemental Variations Of Fe, Mn, Cu and Zn and Conservational Management of Rastrelliger Kanagurta Fish from Karachi Fish Harbour, Pakistan. Journal of Food, Agriculture and Environment, 12(3,4), 405-414. https://doi.org/10.1234/4.2014.5420
Chaudhry, Q. Z. (2017). Climate Change Profile of Pakistan. ADB, 1-130.
Farombi, E. O., Afdelowo, O. A. and Ajimoko, Y. R., (2007). Biomarkers of Oxidative Stress And Heavy Metal Level as Indicators of Environmental Pollution in African Cat Fish (Clarias Gariepinus) from Nigeria Ogun River. Int. J. Environ. Res. Public Health, 4(2),158-165. https://doi.org/10.3390/ijerph2007040011
Farooqi, A. B., Khan, A. H., and Mir, H. (2005). Climate Change Perspective in Pakistan. Pakistan J. Meteorol. 2 : 11-21.
Forstner, U. and Wittmann, G. T. W. (1983). Metal Pollution in Aquatic Environment. Springer-Verlag, Berlin, Pp. 30-61.
GAWC World Cities Ranking List (2010). Diserio.Com. Archived From The Original On 22 February 2010.
Gungum, B., Unlu, E., Tez, Z. and Gulsun, Z. (1994). Heavy Metals Pollution In Water, Sediment and Fish from the Tigris River in Turkey. Chemosphere, 29,111-116. https://doi.org/10.1016/0045-6535(94)90094-9
Guven, K., Ozbay, C., Unlu, E. and Satar, A. (1999). Acute Lethal Toxicity and Accumulation of Copper in Gammarus Pulex (L.) (Amphipoda). Turkey Journal Biol. 23 :513-521.
Haq, B.U., Haq, S. M., Kullenberg, G., And Stel., J. H. (1997). Coastal Zone Management Imperative For Maritime Developing Nations. Coast. Syst. Cont. Marg. 3 : 319-332.
Ikem, A., Egiebor, N. O. (2005). Assessment of Trace Elements in Canned Fishes (Mackerel, Tuna, Salmon, Sardines And Herrings) Marketed in Georgia and Alabama (United States Of America). Journal of Food Composition and Analysis 18 ,771–787. https://doi.org/10.1016/j.jfca.2004.11.002
Karachi : The Backbone of Pakistan" (2020).
Karadede, H., Oymak, S. A. and Unlu, E. (2004). Heavy Metals in Mullet, Liza Abu, and Catfish, Silurus Triostegus, from The Ataturk Dam Lake (Euphrates). Turkey Environmental International 30 :183- 188. https://doi.org/10.1016/s0160-4120(03)00169-7
Khaled, A. (2004). Heavy metal concentrations in certain tissues of five commercially important fishes from El-Mex Bay, Alexandria, Egypt. Egyptian Journal of Aquatic Biology and Fisheries 8 :51-64.
Martinet, V., J. Peña-Torres, M. D. Lara, and H. C. Ramírez (2015). Risk and Sustainability Assessing Fishery Management Strategies. Environ. Resource Econ. 64 : 683–707.
Mckelvey, R., and Golubtsov, P. (2015). Restoration of a Depleted Transboundary Fishery Subject to Climate Change : A Dynamic Investment Under Uncertainty With Information Updates. Environ. Resource Econ. 61 : 19–35.
PIGJE. (2016). Pigje.com.pk. Archived from The Original on 30 September 2014.
Schneider, A., Hommel, G. and Blettner, M. (2010). Linear Regression Analysis: Part 14 of a Series on Evaluation of Scientific Publications. Dtsch Arztebl Int 2010 ; 107 :776-82. https://doi.org/10.3238/arztebl.2010.0776
Sea-Ex. (2017). Commercial Fishing and Seafood Industry Contacts : Pakistan, Bracken Ridge, Queensland, Australia: Sea-Ex.
Siddique, S., Ayub, Z. and Siddiqui, G. (2014). Length-Weight Relationship and Condition Factor in Holothuria Arenicola (Holothuroidea: Echinodermata) Found on Two Rocky Coasts of Karachi, Pakistan. Pakistan Journal of Marine Sciences, 23, (1and2), 51-63.
Vetter TR, (2017). Descriptive Statistics: Reporting the Answers To The 5 Basic Questions of Who, What, Why, When, Where, and A Sixth, So What? Anesthesia And Analgesia. 2017 Nov PMID : 28891910. 125(5),1797-1802.
WWF, (2014). Disaster Management Plan for Livestock and Fisheries Sectors of Sindh.
Wan, C. D., Chen, C. J. (2011). Supply Chain Risk And Its Control Strategy of Aquatic Product Processing Industry. Commerc. Res. 1, 17-21.
Welle, D. (2016). Pakistani Journalists Face Threats from Islamists.This All Happened in the Heart of Karachi – A Relatively Liberal City With a Population of More Than 15 Million.
Whitley, E., Ball, J., (2002). Statistics Review 1 : Presenting and Summarizing Data. Critical Care (London, England). 2002 Feb PMID : 11940268. 6(1),66-71.
|
|
 This work is licensed under a: Creative Commons Attribution 4.0 International License
© IJETMR 2014-2022. All Rights Reserved.