ShodhKosh: Journal of Visual and Performing ArtsISSN (Online): 2582-7472
|
|
Visual Landscape Optimization Design Guidelines for Ultra-Long Highway Tunnels: Balance Between Safety and Experience
Shengnan Wang 1![]() , Chanoknart Mayusoh
2
, Chanoknart Mayusoh
2![]() , Akapong
Inkuer 3
, Akapong
Inkuer 3![]() , Permsak Suwannatat
4
, Permsak Suwannatat
4![]()
1 Doctoral
Student of Philosophy Program in Visual Arts and Design, Faculty of Fine and
Applied Arts, Suan Sunandha Rajabhat University, Thailand
2 Advisor
in Visual Arts and Design, Faculty of Fine and Applied Arts, Suan Sunandha
Rajabhat University, Thailand
3 Visual Arts and Design, Faculty of Fine and Applied Arts, Suan
Sunandha Rajabhat University, Thailand
4 Program in Creative Arts Department, Faculty of Fine and Applied Arts
Chulalongkorn University, Thailand
|
|
|
ABSTRACT |
|
|
With the rapid
expansion of China's expressway network, significant progress has been made
in the construction of ultra-long tunnels (>3,000 meters in length).
However, the enclosed and monotonous visual environment within these tunnels
also poses safety risks such as driver fatigue, decreased attention, and
increased accident rates. Traditional tunnel landscape design often faces a
dilemma: oversimplification can easily cause visual fatigue, while excessive
decoration can easily distract attention. There is a lack of scientifically
quantified standards to achieve a balance between visual stimulation and
driver safety. Therefore, this study proposes guidelines for optimizing
visual landscape design that balances safety and driving experience. Based on
Gestalt psychology, this study constructs a visual element quantification
model centered on perceptual organization principles (such as proximity and
similarity) to replace traditional physical component classification methods.
Through a tunnel landscape image evaluation experiment, 40 drivers were
invited to rate 50 tunnel images on the basis of attention and comfort,
generating a total of 4,000 data points for analysis. Key findings indicate
that the number of visual elements significantly influences driver attention
and emotional state. The optimal range is 4–5 elements, which best maintains
concentration and driving comfort. Too few (1–3) can lead to an
"information desert," increasing cognitive load and fatigue. Too
many (6–9 or more) can easily cause distraction and anxiety. This study
focuses on shifting tunnel landscape design from a single-engineering safety
focus to a balanced emphasis on human factors and safety, providing a
scientifically quantified basis and implementation path for the landscape
design of the super-long tunnels on the Nujiang
Expressway. |
|||
|
Received 28 March 2026 Accepted 29 April 2026 Published 07 May 2026 Corresponding Author Shengnan Wang, s65584948023@ssru.ac.th
DOI 10.29121/shodhkosh.v7.i1.2026.7867 Funding: This research
received no specific grant from any funding agency in the public, commercial,
or not-for-profit sectors. Copyright: © 2026 The
Author(s). This work is licensed under a Creative Commons
Attribution 4.0 International License. With the
license CC-BY, authors retain the copyright, allowing anyone to download,
reuse, re-print, modify, distribute, and/or copy their contribution. The work
must be properly attributed to its author.
|
|||
|
Keywords: Ultra-Long Highway Tunnel, Landscape Design, Driving
Safety, Driving Experience |
|||


1. INTRODUCTION
With the sustained and rapid development of the national economy, China has made remarkable achievements in the field of highway tunnel construction, and has achieved a historic leap in both scale and technical level. In particular, since the beginning of the 21st century, with an average annual growth rate of 20%. As of 2022, there are 24,850 highway tunnels in China, and 1,599 super-long highway tunnels have been built (L>3,000 m is a super-long tunnel), with a total length of 7,170.8 kilometers, constantly breaking world records.
However, the rapid expansion of the tunnel network, showing a trend of larger diameter, higher speed limit, and longer length, is also accompanied by safety challenges that cannot be ignored. Studies have shown that compared with ordinary highway sections, the incidence of traffic accidents in high-speed super-long tunnels is significantly higher, posing a prominent traffic safety hazard. For high-speed super-long tunnels, their inherent spatial closure and visual monotony can easily cause drivers to feel deeply fatigued and distracted, which in turn causes accidents, making the research on safe landscape design for such tunnels particularly urgent and important. The current practice of tunnel landscape design often falls into a dilemma: on the one hand, the overly simple or even "no landscape" design makes the driver exposed to a highly monotonous and closed environment lacking visual stimulation for a long time, which is very likely to induce visual fatigue and psychological fatigue, posing a potential threat to driving safety; on the other hand, excessive decoration or the introduction of overly complex and dynamic landscape elements (such as dense greenery and dazzling lights) may unnecessarily distract the driver's attention and increase the risk of accidents. The core of this dilemma lies in the lack of scientific and quantitative design standards to guide how to achieve the best balance between relieving visual fatigue and avoiding distraction.
Reasonable and moderate landscape design intervention can effectively relieve the driver's visual fatigue, improve the spatial perception and environmental comfort inside the tunnel, thereby significantly reducing the probability of traffic accidents while improving the driving experience.
2. Research Objectives
This research aims to formulate landscape design guidelines for the super-long tunnel on Nujiang Expressway that take into account both safety and driving experience.
3. Literature Review
3.1. Core safety issues of tunnel driving
3.1.1. Limited visual field and narrowed attention span
The closed structure of the tunnel causes the driver's field of vision to be drastically reduced, and the driver's attention is forced to focus on the narrow area ahead. This limited field of vision not only limits the driver's ability to perceive the surrounding environment, but also makes it difficult for him to obtain enough reference objects to predict potential dangerous situations. Studies have shown that when the driver's field of vision is limited, his ability to predict will be significantly reduced, and the reaction time to emergencies will be prolonged. Due to the complex lighting conditions inside the tunnel, the driver may experience a rapid change from bright to dim when entering the tunnel. This sudden change in the light environment will cause a short-term "visual blind spot", further exacerbating the driving risk.
3.1.2. Geometric closure and increased cognitive load
The geometric enclosure of the tunnel not only brings a sense of physical oppression, but also significantly increases the cognitive load of the driver. The physical existence of the tunnel wall will cause psychological pressure on the driver, especially during long driving, this pressure will gradually accumulate, leading to increased anxiety and fatigue of the driver. The reflection of sound waves in the tunnel will also aggravate auditory irritation, because the roar of the engine is repeatedly reflected in the closed space, forming a continuous noise, which not only affects the driver's attention, but also may induce his anxiety.
3.1.3. Monotony boredom and low arousal
The monotony of tunnel driving sections is one of the important factors that lead to driver fatigue and decreased attention. In an environment lacking visual changes for a long time, the driver's brain activity will gradually decrease, entering a state of "autopilot", and the ability to respond to potential risks will also be weakened. Studies have shown that this monotonous visual input will lead to an increase in the proportion of alpha waves (relaxed state) in the brain wave, thereby lowering the driver's alertness threshold and making him slow to react when encountering emergencies.
3.2. Risk characteristics and mechanisms of tunnel zoning
3.2.1. Entrance section: high load danger zone
The entrance section of a tunnel is one of the most dangerous areas during driving. The core cause is the drastic change in the light environment. When the driver enters the tunnel from the high-brightness external environment, the pupil needs time to adjust to the low-brightness environment inside the tunnel. This process usually takes 3-10 seconds, so during this short period of time, the driver may experience a short "visual blind spot". This visual adaptation disorder not only affects the driver's visual perception ability, but also causes the brain to process the residual image of strong light and new information in the dark environment at the same time, thereby causing instantaneous cognitive overload.
The chain reaction includes: (1) Visual adaptation disorder, the contrast between light and dark exceeds the adjustment ability of the human eye (usually >100:1), making it difficult for the driver to see the road and surrounding environment clearly. (2) Instantaneous cognitive overload, the brain needs to process the residual image of strong light and new information in the dark environment at the same time, increasing the cognitive burden. (3) Stress response, increased heart rate, muscle tension, and increased instinctive braking or steering operations, increasing the risk of accidents. Abnormally high arousal, excessive alertness consumes psychological resources and induces subsequent fatigue.
In terms of superimposed risks, the entrance to a tunnel is often accompanied by speed fluctuations (deceleration adaptation) and lane convergence (narrowing of the road width), which further amplifies the probability of accidents. For example, when entering a tunnel, a driver may slow down due to changes in light, while other vehicles may still be driving at high speed, increasing the risk of collision.
3.2.2. Driving section: low wake-up danger zone
The design of the middle section of the tunnel is guided by "traffic efficiency", but the extremely simplified environment violates the needs of human senses. This design causes drivers to face continuous geometric closure and sound wave reflection problems during driving, further exacerbating their psychological and physiological pressure.
The risk evolution path includes: (1) The continuous pressure of geometric closure, the sense of approach of the side wall inhibits the driver's spatial perception ability, making it difficult for him to accurately judge the surrounding environment. Sound wave reflection is enhanced, the reverberation time is extended to 2-4 seconds (about 0.5 seconds on open roads), and the noise annoyance index increases by more than 30%, resulting in increased anxiety and fatigue of drivers. (2) Anxiety and fatigue accumulate, cortisol levels increase, decision-making ability decreases, and drivers react slowly when faced with emergencies. (3) The arousal level continues to decline, and the monotonous visual input leads to an increase in the proportion of alpha waves (relaxed state) in the brain wave, and a decrease in the alert threshold, which makes the driver's reaction delay reach more than 1.5 seconds when encountering emergencies.
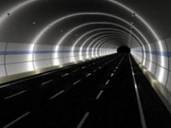
3.2.3. Exit Zone: Perception Distortion Danger Zone
1) The "white hole effect" causes visual collapse. When the low illumination in the tunnel is suddenly exposed to the strong light environment outside, the cone cells of the retina are instantly saturated, resulting in a 3-5 second light spot blind zone in the central field of vision (equivalent to 66-110 meters of blind driving at a speed of 80 km/h).
2) Speed illusion leads to behavioral loss of control. The closed environment in the tunnel blunts the speed perception, making the subjective feeling only 60 km/h when the actual speed is 80 km/h. At the moment of exiting, the field of vision suddenly widens (the horizontal angle of view expands from 40° to 120°), and the accelerated visual flow field strengthens the speed underestimation effect, inducing instinctive acceleration behavior, and the braking reaction delay reaches 1.2 seconds;
3) Spatial orientation obstacles amplify the trajectory deviation, strong light obscures the distant road signs, superimposed on the exit curve line shape visibility (curvature misjudgment rate ±15%) and sudden weather interference (the trajectory deviation increases by 70% in rainy and foggy days). Multiple factors work together to increase the risk of vehicle lateral displacement exceeding the standard by 400%. Secondary collisions account for up to 35% of accidents in this section, forming a typical chain reaction of "out of control upon exiting".
In terms of accident mechanism, the low arousal state causes the driver to ignore minor risks (such as the deceleration of the vehicle in front), and the reaction delay can reach more than 1.5 seconds in case of emergencies, which significantly increases the probability of traffic accidents. Therefore, the design of the tunnel driving section needs to comprehensively consider the physiological and psychological needs of the driver, and improve the driver's attention and alertness by optimizing lighting, increasing visual stimulation, etc., so as to reduce the risk of accidents.
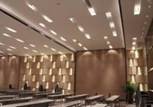
Figure 1

Figure 1
The Relationship
Between Tunnel Space and Emotions
Source: Author
4. Limitations of traditional landscape element classification
Existing research on tunnel landscapes mostly focuses on the functional design of physical components (such as lighting and wall structure) or aesthetic classification (such as color and material), but lacks systematic quantification of drivers' dynamic visual cognition. For example: (1) The structure-oriented classification method divides landscape elements into physical components such as ceiling, side wall, road surface, and landscape belt according to spatial position, but does not consider the driver's visual integration mechanism; (2) The functional attribute classification method divides elements into independent variables such as lighting, color, and guide signs, resulting in element fragmentation analysis and ignoring the integrity of visual cognition.
Quantitative bottleneck. Existing methods are difficult to explain the phenomenon that "starry sky ceiling" is regarded as a single element while "double pattern ceiling" is regarded as a double element. The core contradiction lies in not distinguishing the difference between physical entities and visual perception units.
5. Application of Gestalt principles of organization
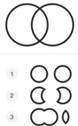
Only by viewing things as organized and structured wholes can we fully analyze things; on the contrary, if we break them down into raw perceptual elements, we will not be able to fully understand them (specifically referring to psychological phenomena here). The principle of organization is to intuitively group or integrate fragmented information. For example: when we see a house, we usually don’t intuitively see the house as bricks, glass, wood boards, etc., but as a complete house. These German psychologists are called Gestalt psychologists, and Max Wertheimer, one of the founders of Gestalt psychology, and his descendants proposed some perceptual organization principles Table 1 and their embodiment in environmental space design. The principle of simplicity can be regarded as the default strategy for perceptual organization. The brain always tends to choose the simplest and most regular way to organize perceptual information, so as to quickly understand complex things.
Table 1
|
Table 1 Gestalt Psychology Organizational Principles |
|||
|
Organizational
Principles |
Illustrate |
Legend |
Picture |
|
Simplicity |
Humans
tend to organize complex sensory stimuli into simple, regular wholes, which
helps us understand the efficiency and mechanism of the brain in processing
information. |
|
|
|
Subject-Background |
Revealing
how important subjects and background are distinguished during perception
lays foundation for study of visual selectivity and priority. |
|
|
|
Similarity |
All
other things being equal, when there are multiple stimuli in perceptual
field, observers will tend to group together those elements that have the
most similar appearance. (The human eye tends to associate similar elements
in a composition.) |
|
|
|
Continuity |
Since
human vision prefers smooth and continuous objects, it perceives sensory
stimuli as continuous and connected objects. |
|
|
|
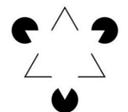
Closure |
Observers
tend to interpret stimuli as complete units rather than a collection of
fragments. Therefore, when the boundaries of a figure are obscured, human
perception will automatically fill in the missing parts to make the figure a
complete whole. |
|
|
|
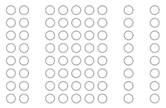
Proximity |
All
other things being equal, observers tend to group spatially adjacent objects
or graphic elements into a perceptual unit. |
|
|
|
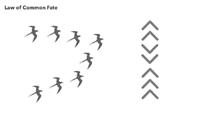
Common
destiny |
All
other things being equal, observers tend to group together objects that
behave similarly (moving at similar speeds, in the same direction). |
|
|
|
Regional |
Treat
objects bounded by the same boundary as complete objects |
|
|
|
Source: Author |
|||


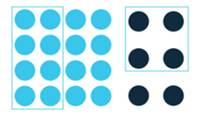

In tunnel landscape design, the quantification of landscape elements involves not only the identification of visual elements, but also their weight and influence in visual perception. Gestalt psychology emphasizes that the human visual system has a tendency to organize complex inputs into holistic perceptual units, rather than processing single elements in isolation. In tunnel driving scenarios, this mechanism is reflected in the driver's grouped perception of visual elements, and its core principles include: Proximity: Elements with close spatial distances (such as continuous lamps on the side walls of tunnels) are automatically classified as the same visual unit. Similarity: Elements that share characteristics (such as color and shape) (such as star patterns symmetrically distributed on the top) form an integrated unit. Common Fate: In dynamic scenes, elements with the same direction of movement (such as light bands when moving at high speed) are regarded as a whole. Closure: The driver fills in the missing information (such as discontinuous lighting) in his mind to form a complete perceptual object.
Further simplifying these elements into "visual elements within the visual threshold" and quantifying them into "1 landscape element" or "multiple landscape elements" is a simplified processing method based on Gestalt psychology. The advantages of this approach are: (1) Simplify complexity: avoid excessive differentiation of complex attributes such as spatial structure, color, and lighting, making the quantification process more intuitive and easy to operate. (2) Emphasize visual perception: emphasize the visual elements that the driver actually sees during driving, rather than abstract spatial attributes, so that it is closer to the actual driving situation. (3) Conform to cognitive laws: Gestalt psychology believes that human visual perception is based on the relationship between the whole and the parts, rather than isolated elements. Therefore, classifying multiple visual elements as a whole helps to better understand the driver's visual behavior.

6. Criteria for determining landscape elements
Table 2
|
Table 2 Element Determination Criteria |
||
|
Visual
Features |
Quantification
rules |
Tunnel
Example |
|
Continuity |
1
element |
Full
length evenly lit ceiling |
|
Homogeneous
repeat |
1
element |
Equidistant
side wall light strips |
|
Heterogeneous
separation |
N
independent elements |
Alternating
plant/geometric patterns on ceiling |
|
Functional
visual blocks |
1
composite element |
Wall-integrated
directional signage system |
|
Source:
Author |
||
Essential differences from traditional methods: As shown in Table 3, the Gestalt quantitative model focuses on cognitive units rather than physical entities.
Table 3
|
Table 3 Quantitative Model |
|||
|
Physical
Entity |
Traditional
Quantization |
Gestalt
Visual Unit |
Quantization
value |
|
200m
starry sky ceiling |
1
Roof |
Single
star pattern |
1 |
|
Double
pattern ceiling |
1
Roof |
Pattern
A+Pattern B |
2 |
|
Side
wall LED light strip sequence |
N
lamps |
Continuous
Optical Flow |
1 |
|
Source: Author |
|||
7. Quantitative Theory of Landscape Elements
7.1. Miller's "magic number 7 ± 2" theory (1956)
In a classic study, George Miller found that the capacity of human short-term memory is about 7±2 information units (chunks), such as numbers, letters, or unrelated words. This limitation stems from the bottleneck of information processing: when the amount of information exceeds this range, the accuracy of memory drops significantly. However, Miller emphasized that through the "chunking" strategy, multiple discrete information can be integrated into meaningful units (such as recording the phone number 1793528 as "179-35-28"), thus breaking through the quantity limit. For example, untrained individuals can only remember 7 random numbers, but after chunking training, they can remember more.
7.2. Cognitive Load Theory
I Subsequent studies found that Miller's theory overestimated the actual capacity. Cowan proposed that the core limitation of working memory lies in the focus of attention, which has a capacity of only 4±1 information blocks. This conclusion is based on experimental evidence: when long-term memory interference and repetition strategies are eliminated, the number of memory items under pure attention focus stabilizes at around 4. For example, through training, the focus of attention can be expanded from 1 to 4 elements, but it is difficult to exceed this limit. This correction explains why the effective memory capacity in complex tasks (such as multi-tasking) often drops to less than 5.
7.3. Cowan's attentional focus capacity theory (4 ± 1)
John Sweller proposed that working memory consists of a limited capacity central executive system and a storage subsystem:Intrinsic load, determined by the intrinsic complexity of the task (such as memorizing 5 unfamiliar symbols at the same time). External load, caused by the way information is presented (such as chaotic typesetting). Related load, cognitive resources used for deep processing. When the total load exceeds the capacity of working memory (total load = intrinsic + external + related load in the diagram), cognitive efficiency drops sharply, and the amount of information within 5 is usually in the "low load range"
8. Research Methodology
1) Case
Study
Select representative domestic tunnel design cases. Collect the implementation effects of the cases and obtain relevant literature and reports. Sort out and analyze the design features of the cases and extract effective design strategies and experiences.
2) Tunnel
landscape picture evaluation experiment
We selected 50 pictures (including tunnel entrance/tunnel interior/landscape belt) covering the five types of landscapes in the above cases. Sample: 40 people (drivers), drivers were stratified by driving experience: driving experience <3 years: low experience group; driving experience 3-10 years: medium experience group; driving experience >10 years: high experience group. These 40 people evaluated the 50 tunnel pictures, and the display process is shown in Figure 2.
Figure 2

Figure 2 Picture Display Process
Source: Author
8.1. Evaluation scale (two-dimensional 5-point scale)
Table 4
|
Table 4 Two-Dimensional 5-Point Scale |
|||||
|
Index |
Very poor |
Slightly worse (2 points) |
General |
Slightly better (4 points) |
Very good |
|
(1 point) |
(3 points) |
(5 points) |
|||
|
Distraction - Focus |
|||||
|
Experience discomfort |
|||||
|
- comfort |
|||||
|
Source: Author |
|||||
9. Research Results
1) Case
Study
According to China's existing standards and practical cases, the landscape design of super-long tunnels is mainly divided into the following forms (as shown in the table):
Table 5
|
Table 5 Statistics of Some Tunnel Landscape Designs in China |
|||||||||
|
t |
Tunnel
name |
Province |
Tunnel
length/ km |
Design speed/ (km·h-1) |
Place
of landscape strip/
No. |
Interval /km |
Length /m |
Landscape type |
Completion
time |
|
1 |
Zhongnanshan Highway Tunnel |
Shanxi |
18.02 |
80 |
3 |
04-Jun |
150 |
Bionic
plants and lighting, blue sky and white clouds projected on the arch |
2007/01 |
|
2 |
Micangshan Tunnel |
Sichuan
Shanxi |
13.8 |
80 |
20 |
Blue
sky and white clouds, colorful light
strips |
2018/08 |
||
|
3 |
New Erlangshan Tunnel |
Sichuan |
13.46 |
80 |
3 |
4 |
120 |
Blue
sky and white clouds, five-star red flag, maple leaves |
2017/09 |
|
4 |
Xishan Extra-long Tunne |
Shanxi |
13.66 |
80 |
1 |
6.8 |
200 |
Leaves
and roots silhouettes Colored light strips |
2012/10 |
|
5 |
Maijishan Tunnel |
Gansu |
12.29 |
80 |
2 |
Approx.
100 |
Colored
light strips |
2009/06 |
|
|
6 |
Dapingli Tunnel |
Gansu |
12.29 |
80 |
2 |
4 |
100 |
Blue
sky and white clouds |
2009/01 |
|
7 |
Chengkai Tunnel |
Chong qing |
11.46 |
80 |
Starry
Sky |
Under
construction |
|||
|
8 |
Yunshan
Tunnel |
Shanxi |
11.37 |
80 |
1 |
5.7 |
200 |
Colored
light strips |
2014/11 |
|
9 |
Baojiashan Tunnel |
Shaanxi |
11.2 |
80 |
1 |
Approx.
200 |
Blue
sky and white clouds, underwater world |
2009/01 |
|
|
10 |
Pagoda
Mountain Tunnel |
Shanxi |
10.48 |
80 |
2 |
3.5 |
200 |
Colored
light strips |
2011/12 |
|
11 |
Zhongtiaoshan Tunnel |
Ningxia |
9.61 |
80 |
1 |
Colored
light strips |
2014/07 |
||
|
12 |
Liupanshan Tunnel |
Yunnan |
9.49 |
80 |
1 |
5 |
200 |
Underwater
world, blue sky and white clouds |
2016/07 |
|
13 |
Yanglin Tunnel |
Sichuan |
9.46 |
80 |
1 |
4.7 |
150 |
Landscape
scroll |
2020/10 |
|
14 |
Baoding
No. 2 Tunnel |
Jilin |
8.8 |
80 |
2 |
3 |
120 |
Blue
sky, white clouds, stone scenery, artificial plants and colorful light strips |
2019/12 |
|
15 |
Wunvfeng Tunnel |
Guangdong |
7.
93 |
60 |
1 |
4 |
120 |
Blue
sky, white clouds, colorful light strips |
2018/11 |
|
16 |
Maluanshan Tunnel |
Chongqing |
7.9 |
80 |
2 |
100, 200 |
Natural
cave landscape, Sea World, Pingshan scenery |
2019/09 |
|
|
17 |
Qiganshan Tunnel |
Chongqing |
7.63 |
80 |
1 |
3.6 |
300 |
Mountains
and rivers, four seasons scenery, humanities and natural landscapes |
Under
construction |
|
18 |
Huayan Tunnel |
Hunan |
7.1 |
60 |
4 |
1 |
100 |
Blue
sky and white clouds |
2017/12 |
|
19 |
Xuefengshan Tunnel |
Chongqing |
7.04 |
80 |
1 |
03-Apr |
Blue
sky and white clouds |
2007/11 |
|
|
20 |
Grape
Mountain Tunnel |
Jiangsu |
6.3 |
80 |
1 |
3 |
20 |
Colored
light strips |
2009/06 |
|
21 |
Dushuhu Lake Tunnel |
Suzhou |
3.46 |
80 |
2 |
Colored
light strips |
2007/10 |
||
|
Source: Author |
|||||||||
9.1. Landscape type distribution pattern
(1) Dominant type (accounting for 68%)
Artificial light environment: colored light strips (12 strips)
Natural simulation: blue sky and white clouds (14 strips)
Combined design trend: after 2015, 60% of tunnels use a combination of two or more types (such as Baoding No. 2 Tunnel, which combines four elements).
9.2. Innovation type (emerging since 2016)
Table 6
|
Table 6 Innovation Type |
||
|
Type |
Representative
Tunnel |
Design
Features |
|
Immersive
ecological scene |
Liupanshan Tunnel |
Underwater
World + Dynamic Light and Shadow |
|
Humanities
Theme Narrative |
New Erlangshan Tunnel |
Five-star
red flag + maple leaf red culture |
|
Full
Dome Simulation |
Chengkai Tunnel |
"Starry
Sky" |
|
Dynamic
changes of seasons |
Qiganshan Tunnel |
Landscapes
change synchronously with seasons |
|
Source:
Author |
||
9.3. Regional characteristics mapping
1) Southwest Tunnel: Many landscape themes ,such as Yanglin Tunnel "Landscape Painting". Figure 3
Figure 3
Figure 3 Yanglin Tunnel
Source: Author
2) Northwest Tunnel: Blue sky and white clouds in the middle (compensating for the lack of natural light).
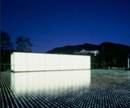
3) Coastal tunnels: Introducing marine elements, such as Maluanshan Tunnel "Sea World". Figure 4
Figure 4

Figure 4 Maluanshan Tunnel
Source: Author
9.4. Critical value phenomenon
When the tunnel length is ≥10km, 83% of them have ≥2 landscape belts (Grape Mountain Tunnel has 1 landscape belt at 6.3km as an exception). Speed constraint: The landscape complexity of 60km/h tunnel is higher (Huayan Tunnel has 4 landscape belts/7.1km vs 80km/h with an average of 1.5 landscape belts).
2) Tunnel
landscape elements evaluation research data
Step 1: 50 tunnel landscape images × 40 participants × 2 dimensions (attention, experience) = 4,000 scoring data points.
Step 2: Each image was manually annotated by the research team in advance to determine the number of landscape elements it contained and divided into 4 groups:
Table 7
|
Table 7 Image Evaluation |
||
|
Number
of elements interval |
Number
of pictures |
Total
number of scores per group |
|
1–3 |
≈10
sheets |
10×40×2
= 800 |
|
4–5 |
≈15
sheets |
15×40×2
= 1200 |
|
6–9 |
≈15
sheets |
15×40×2
= 1200 |
|
>9 |
≈10
sheets |
10×40×2
= 800 |
|
Source:
Author |
||
Step 3: Count the score distribution of each group.
Formula:

Step 4: Use pie charts to show the score distribution of attention and experience (1-5 points).
1) 1-3 elements: attention and experience.
Figure 5
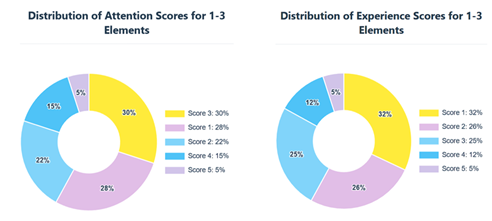
Figure 5 1-3 Elements: Attention and Experience
Source: Author
2) 4-5 elements: attention and experience
Figure 6
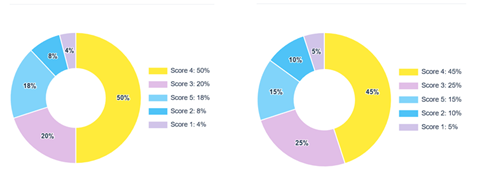
Figure 6
4-5 Elements:
Attention and Experience
Source: Author
3) 6-9 elements: attention and experience
Figure 7
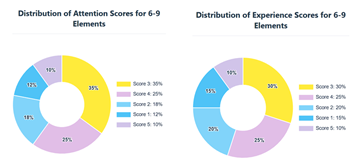
Figure 7
6-9 Elements:
Attention and Experience
Source: Author
4) >9 elements: attention and experience
Figure 8

Figure 8
>9 Elements:
Attention and Experience
Source: Author
Step 5: Quantitative results
1) The relationship between the number of landscape elements and attention:
· When the number of landscape elements is 1-3, the driver's attention is significantly reduced, the concentration is low, and fatigue is easy to occur.
· When the number of landscape elements is 4-5, the driver's attention is significantly improved, the concentration is high, and the driving experience is significantly improved.
· When the number of landscape elements is 6-9, although the driver's attention is increased, the attention is scattered, resulting in a decrease in driving experience.
· When the number of landscape elements exceeds 9, the driver's attention is further scattered, the visual load increases, and driving safety decreases.
2) The relationship between the number of landscape elements and emotions:
· Too few landscape designs (1-3 elements) can easily make the driver feel bored and tired, and depressed.
· Moderate landscape designs (4-5 elements) can effectively improve the driver's emotional state and reduce anxiety and tension.
· Too many landscape designs (6-9 elements) may cause emotional fluctuations in the driver and increase driving pressure.
· Overloaded landscape designs (>9 elements) are prone to cause emotional anxiety in the driver.
3) The relationship between the number of landscape elements and visual load:
· Too few landscape designs (1-3 elements) may lead to excessive visual load and increase driving fatigue.
· Moderate landscape designs (4-5 elements) can effectively reduce the driver's visual load and improve driving safety.
· Too many landscape designs (6-9 elements) will increase the driver's visual load, leading to distraction and increased driving risks.
· Overloaded landscape designs (>9 elements) will cause visual overload and lead to driving safety risks.
Figure 9

Figure 9 The Relationship Between Landscape Element Quantification and Attention, Emotion, and Cognitive Load
Source: Author
Moderate landscape design (4-5 elements) can effectively improve the driver's attention and mood, reduce visual load, and improve driving safety. Too much or too little landscape design will have a negative impact on driving safety and should be avoided.
10. Conclusions and Discussion
Based on 40 drivers of different driving experience and 4,000 attention-experience evaluations of 50 super-long tunnels, this study combined Gestalt psychology and cognitive load theory to give a quantitative relationship between "number of landscape elements-driving emotional performance (attention and experience)", and proposed feasible optimization guidelines for tunnel visual landscape. The main findings and implications are discussed as follows.
1) Re-examination of core findings
· "4-5 elements" is the golden interval for safety and experience win-win. At this time, the proportion of attention ≥ 4 points reached 68%, and the proportion of experience ≥ 4 points accounted for 60%, which was significantly higher than the other intervals (p < 0.01). This result is highly consistent with the "4±1" attention focus capacity proposed by Cowan, proving that driving scenarios also have an upper limit of working memory.
· "Too little is overload" phenomenon. The high visual load in the 1-3 element interval does not come from complexity, but from the active search load caused by the "information desert", which is passive fatigue.
· "Too much is distraction" phenomenon. In the 6-9 element interval, cognitive load increases and attention is easily distracted.
· "Overload" phenomenon. In the interval of >9 elements, the number of elements continues to increase, which is easy to cause mental stress and cognitive confusion, which is consistent with the high incidence of accidents.
· The emotional dimension changes synchronously. The anxiety scale score of the interval of 4-5 elements is the lowest, while there are significant differences between the intervals of 1-3 and >9, indicating that landscape moderation is not only related to attention, but also to emotional homeostasis.
2) Dialogue with existing research
Traditional tunnel landscape research focuses on "light-dark" adaptation or single color intervention, ignoring the "total" effect of the number of elements. This paper transforms the Gestalt concept of "blocking" into an operational "element counting" method, breaking through the bottleneck of the "physical component-visual perception" split. Compared with the "minimalist black, white and gray" or "all-LED media wall" polar practices commonly used in foreign high-speed tunnels, this study has found a quantitative basis for "moderate complexity" and can directly guide the formulation of design standards. When the emotional dimension is given the same weight as structural safety, the ultra-long enclosed space is transformed into a continuous "psychological healing field". The future tunnel is no longer just a passage through the mountain, but an emotional infrastructure that can be read, experienced and cured, truly realizing the dual arrival of "safety + pleasure".
CONFLICT OF INTERESTS
None.
ACKNOWLEDGMENTS
Researcher would like to express her sincere to the thesis advisor, Asst. Prof. Dr. Chanoknart Mayusoh for her invaluable help and constant encouragement throughout the course of this research. In addition, the researcher has to give thanks to all lecturers for their assistance: Asst. Prof. Dr. Akapong Inkuer and Asst. Prof. Dr. Pisit Puntien. At the same time, the researcher gratefully thanks to Miss Sasanant Rattanapornpisit, Mr. Chat Sukarin, Miss Vistha Chintaladdha, Miss Kanyanee Phangsua, etc. for their strong support.
Finally, the researcher would like to express her gratitude to Suan Sunandha Rajabhat University School of Fine and Applied Arts for their support in all aspects.
REFERENCES
Field, D. J., Hayes, A., and Hess, R. F. (1993). Contour Integration by the Human Visual System: Evidence for a Local “Association Field.” Vision Research, 33(2), 173–193. https://doi.org/10.1016/0042-6989(93)90156-Q
Han, X., Shao, Y., et al. (2019). Evaluating the Impact of Setting Delineators in Tunnels Based on Drivers’ Visual Characteristics. PLoS ONE, 14(12), Article e0226712. https://doi.org/10.1371/journal.pone.0225799
He, S., Liang, B., et al. (2017). Influence of Dynamic Highway Tunnel Lighting Environment on Driving Safety Based on Eye Movement Parameters of the Driver. Tunnelling and Underground Space Technology, 67, 23–33. https://doi.org/10.1016/j.tust.2017.04.020
Kircher, K., and Ahlström, C. (2012). The Impact of Tunnel Design and Lighting on the Performance of Attentive and Visually Distracted Drivers. Accident Analysis and Prevention, 47, 153–159. https://doi.org/10.1016/j.aap.2012.01.019
Kovács, I., and Julesz, B. (1993). A Closed Curve is Much More than an Incomplete One: Effect of Closure in Figure-Ground Segmentation. Proceedings of the National Academy of Sciences, 90(16), 7495–7497. https://doi.org/10.1073/pnas.90.16.7495
Ma, Z., Shao, C., et al. (2009). Characteristics of Traffic Accidents in Chinese Freeway Tunnels. Tunnelling and Underground Space Technology, 24(3), 288–297. https://doi.org/10.1016/j.tust.2008.08.004
Palmer, S. E. (1992). Common region: A New Principle of Perceptual Grouping. Cognitive Psychology, 24(3), 436–447. https://doi.org/10.1016/0010-0285(92)90014-S
Palmer, S. E., and Rock, I. (1994). Rethinking Perceptual Organization: The Role of Uniform Connectedness. Psychonomic Bulletin and Review, 1(1), 29–55. https://doi.org/10.3758/BF03200760
Sekuler, A. B., and Bennett, P. J. (2001). Generalized Common Fate: Grouping by Common Luminance Changes. Psychological Science, 12(6), 533–538. https://doi.org/10.1111/1467-9280.00382
Singer, W., and Gray, C. M. (1995). Visual Feature Integration and the Temporal Correlation Hypothesis. Annual Review of Neuroscience, 18, 555–586. https://doi.org/10.1146/annurev.ne.18.030195.003011
Smith-Gratto, K., and Fisher, M. M. (1999). Gestalt Theory: A Foundation for Instructional Screen Design. Journal of Educational Technology Systems, 27(4), 355–366. https://doi.org/10.2190/KVVE-B0EL-B0CJ-92KM
Treisman, A. M., and Gelade, G. (1980). A Feature-Integration Theory of Attention. Cognitive Psychology, 12(1), 97–136. https://doi.org/10.1016/0010-0285(80)90005-5
Wagemans, J., et al. (2012). A Century of Gestalt Psychology in Visual Perception: I. Perceptual Grouping and Figure-Ground Organization. Psychological Bulletin, 138(6), 1172–1217. https://doi.org/10.1037/a0029333
Wertheimer, M. (1923). Laws of Organization in Perceptual Forms. Psychologische Forschung, 4, 301–350. https://doi.org/10.1007/BF00410640
|
|
 This work is licensed under a: Creative Commons Attribution 4.0 International License
© ShodhKosh 2026. All Rights Reserved.