ShodhKosh: Journal of Visual and Performing ArtsISSN (Online): 2582-7472
|
|
Climate Change as Visual Discourse: An Interdisciplinary Study of Newspaper Representation and Audience Perception in Himachal Pradesh
Aditi Sharma
2![]() , Dr. Vinod 3
, Dr. Vinod 3![]()
1 Research
Scholar, University Institute of Media Studies, Chandigarh University, Mohali,
Punjab, India
2 Associate Professor, University
Institute of Media Studies, Chandigarh University, Mohali, Punjab, India
|
|
|
ABSTRACT |
|
|
Climate change
has become a significant issue of global concern and it has become important
to employ effective communication strategies to increase the awareness and
participation of people. In different media outlets, the newspapers still
have a major role to play in terms of spreading environmental information
especially in places where the print media still hold sway. This paper
explores climate change as a visual discourse through an examination of
visual representations of climate change in newspaper images and how such
representations are perceived by the audience in Himachal Pradesh which is a
climate-sensitive area within the Indian Himalayan ecosystem. The study
assumes the mixed-method approach, which involves visual content analysis of
the chosen newspapers and the analysis of audience perception through
surveys. The results indicate that the newspaper coverage is mainly
characterized with disaster oriented images, including floods, landslides and
forest fires that highlight the immediate effects of climate change. Although
these images are helpful in attracting attention and creating emotional
appeal, they can be rather shallow and cannot convey the processes and
solutions to climate in the long-term perspective. Audience analysis shows
that there is a high level of awareness and emotional response with a high
correlation between visual perception and exposure to visuals. Nevertheless,
the study also finds out that there is a disconnection between awareness and
behavior change, since more awareness does not necessarily lead to
sustainable environmental behavior. The paper highlights the need to have a
more balanced visual representation that incorporates informative as well as
solution-oriented visuals to increase the level of knowledge and encourage
people to act. The work is an interdisciplinary contribution as it combines
the ideas of the media studies, environmental science, and social psychology.
It also provides valuable information to policy makers, environmental
communicators and journalists to enhance effective communication of climate
change. This study underlines the significance of strategic media
representation in the context of tackling one of the most urgent issues of
our days by focusing on the role of visual discourse. |
|||
|
Received 24 January 2026 Accepted 13 March
2026 Published 11 April 2026 Corresponding Author Aditi
Sharma, aditi303@yahoo.in DOI 10.29121/shodhkosh.v7.i4s.2026.7604 Funding: This research
received no specific grant from any funding agency in the public, commercial,
or not-for-profit sectors. Copyright: © 2026 The
Author(s). This work is licensed under a Creative Commons
Attribution 4.0 International License. With the
license CC-BY, authors retain the copyright, allowing anyone to download,
reuse, re-print, modify, distribute, and/or copy their contribution. The work
must be properly attributed to its author.
|
|||
|
Keywords: Climate Change Communication, Visual Discourse,
Newspaper Representation, Audience Perception, Environmental Media, Himachal
Pradesh, Visual Framing, Media Influence, Environmental Awareness, Climate
Communication Strategies |
|||


1. INTRODUCTION
Climate change has become one of the most topical problems of the 21st century on the planet affecting the ecosystem, economy, and human society at different levels. Over the past few decades, the sense of urgency has risen as climate discourse is enhanced by a growing number of indicators of rising temperatures, unpredictable weather, and biodiversity loss. As scientific communities are still generating large amounts of empirical data, it is through media representation that the knowledge can be translated into popular knowledge. Newspapers are still an important means of transmitting information, especially in places such as Himachal Pradesh where the print media is still culturally and informational relevant Bogl et al. (2013). The visualization of climate change in newspapers is a vital component in how the populace perceives it, how it affects awareness and ultimately may facilitate behavioral change.
The concept of visual discourse is not limited to textual communication, since it may include images, graphics, symbols, and layouts, which have a meaning. The visual means of storytelling, such as the pictures of melting glaciers, deforestation, floods and human suffering, may be employed when it comes to climate change. Such images tend to be emotional, thus making complicated scientific processes easier to relate to and comprehend by lay people. Visual representations in areas such as Himachal Pradesh, which are environmentally sensitive and directly affected by climate changes, may have a great impact on how people perceive the environmental hazards and duties Chae et al. (2012). The interdisciplinary nature of the visual discourse that is grounded on media studies, environmental science, sociology and the communication theory provides a complete array of what can be analyzed in terms of how the climate narratives are framed and understood.
Of particular concern is the role of newspaper in environmental communication which is more pronounced in semi-urban and rural areas where there may be differences in digital penetration. The newspapers are not just agents of information dissemination, but also agents of agenda setting, and bring to the fore some issues more than others. This subtle influence on the discourse of the population can be achieved by the inclusion, omission, or framing of visuals related to climate. As an example, the recurring visuals of natural disasters can produce the illusion of climate change being a pressing problem, but the lack of a local context can alienate the readers to the problem Gao et al. (2014). In Himachal Pradesh, where natural resources like forests, rivers and agriculture are closely intertwined with communities, informational and socio-cultural implications of covering climate change in newspapers are evident.
Although the literature on communication about climate change has been increasing, a significant gap in the knowledge about the presence of the visual discourse in regional newspapers, especially in the Indian Himalayan setting, still exists. The majority of the literature available is oriented towards textual analysis or global trends in the media, with little focus on localized stories or interpretation by the audience. Moreover, the visual representation and perception by the audience is complicated, and depends on the education, socio-economic status, cultural beliefs and previous environmental awareness Bryant (2019). This paper seeks to fill this gap by looking at the visual representations of climate change in newspapers as well as the perceptions of the same by the audience in Himachal Pradesh.
The main aim of the present study is to examine climate change as a visual discourse in newspaper media and to assess the effects that it has to the perception of the audience. In particular, the research aims to determine the nature of the visual content employed in climate coverage, the nature of framing employed by newspapers and how the readers perceive and react to such visuals.
2. Literature Review
Climate change communication is a field of study that has changed in many ways in the last 20 years, drawing the knowledge of environmental science, media studies, sociology, and cognitive psychology. With the growing visibility of climate change in the general discourse, the importance of the media, and especially visual media in informing and influencing the audience response to environmental concerns has become more visible. This part will cover relevant theoretical and empirical literature related to climate change communication, visual framing, newspaper representation and audience perception, and determine gaps in the literature to the context of Himachal Pradesh.
2.1. Climate Change
Communication Theories
The communication of climate change is based on a number of theoretical frameworks which describe how information is spread and construed. According to the Agenda-Setting Theory, the media determines the issues that the citizens attach importance to by dictating the number of times they are covered and the treatment given to the coverage. Newspapers that regularly feature environmental concerns (particularly, with effective visuals) can bring the issue of climate change to the attention of a broader audience and increase their concern McLaughlin et al. (2017). The other notable theory is the Framing Theory, which focuses on the impact of presentation of information on the interpretation by the audience. Climate change may be discussed as a scientific problem, political discussion, economic problem or a humanitarian crisis. The visual aspects of framing are significant as they support a particular narrative - such as flood images can be used to frame climate change as a disaster, whereas images of policymakers can be used to frame climate change as a governance problem.
The Cultivation Theory, furthermore, assumes that over the long-term, the perception of the reality of people is influenced by their exposure to media content. Repeated view of climate-related images in newspapers can foster a sense of increased risk of environmental danger or, vice versa, become desensitized when the images become repeated without actionable context.
2.2. Visual Framing
and Media Representation
Visual framing goes beyond narrative and textual discourse by using imagery, layout and symbolism to create meaning. Research has indicated that pictures are better and quicker to process than the text and are more powerful emotionally, which makes them a powerful method of communicating a complex problem such as climate change. Visual evidence of environmental degradation is often in the form of photographs of melting glaciers, forest fires and displaced communities Panicker and Gayathri (2019).
As an example, the international media tends to cover significant disasters, but local newspapers can emphasize local effects, i.e. landslides or water shortage. In Himachal Pradesh, as the territory is mountainous, and climate-sensitive, images referring to glacial melting, flash floods, and deforestation are of specific interest. Nonetheless, little is known about how well these images can be considered a reflection of the overall climate story Poongodi et al. (2021).
2.3. Role of
Newspapers in Environmental Reporting
Although the digital media has emerged, newspapers still have a crucial role to play in the information sharing of the environment, particularly in areas with little access to internet Bodha et al. (2020). Information presented in newspapers is curated and has a relative degree of credibility, and can be used to shape the opinion of the masses and policy debate. The environmental reporting in the newspapers comprises both written and visual information in terms of text and visual elements like photographs, info graphics and editorial cartoons.
Studies have shown that newspapers tend to focus on episodic reporting (i.e. on a particular event such as floods or heatwaves) rather than on thematic reporting which describes the long-term patterns in climate. Such episodic attention may restrain the general knowledge about climate change as a systemic problem. Moreover, the position of images (front page and inside pages) and their size could influence their appearance and influence greatly.
2.4. Audience
Perception and Media Influence
The perception of the audience is formed by the complex of media exposure, their personal experience and social-cultural influences. Images are very important in shaping the perception of viewers towards climate change. Research indicates that emotionally evoking pictures can help raise awareness and concern and also, can cause fear or helplessness unless they are complemented with constructive remedies Sahoo (2022).
Within the setting of Himachal Pradesh, perception of the audience would be based on the immediate experience of environmental changes like unpredictable rainfall, landslides, and altering agricultural patterns. The communication of lived experiences and media representation forms distinct perception frames. Nonetheless, little is known about the interpretation by the audience in this region of newspaper images, in particular.
2.5. Interdisciplinary
Approaches to Visual Discourse
Visual discourse analysis is an interdisciplinary process which involves the combination of various aspects. Media studies give the means of representation and framing analysis and environmental science may give information about the correctness and topicality of visuals related to climate. Sociology and psychology help to comprehend the behavior and perception of an audience Venkatanaresh and Kullayamma (2022).
Other contemporary approaches that have been used to study visual discourse include content analysis, semiotic analysis and survey of the audiences. Content analysis is concerned with quantifying the visual components whereas semiotic analysis is concerned with the meaning of images. Integrating these methods will make it possible to have a holistic view of the effect of the visuals in presenting the climate stories and how they impact audiences.
Table 1
|
Table 1 Summary of Key Literature on Climate Change Communication and Visual Discourse |
|||
|
Focus Area |
Methodology |
Key Findings |
Research Gap Identified |
|
Climate Communication Bodha et al. (2020) |
Content Analysis |
Media influences public awareness of climate
issues |
Limited focus on visual elements |
|
Visual Framing Sahoo (2022) |
Experimental Study |
Images evoke stronger emotional responses than
text |
Lack of regional context |
|
Newspaper Reporting Venkatanaresh
and Kullayamma (2022) |
Comparative Analysis |
Newspapers emphasize episodic events |
Weak coverage of long-term climate trends |
|
Audience Perception Kumar et al. (2023) |
Survey-Based Study |
Visuals increase engagement and recall |
No focus on Himalayan regions |
|
Environmental Media Rani et al. (2023) |
Case Study |
Local media reflects regional environmental
issues |
Limited integration of visual discourse analysis |
2.6. Identified
Research Gaps
Despite the useful information available in the existing literature, there are a number of gaps. To begin with, the specific study of the region is missing in terms of region-specific studies on the Indian Himalayan context, especially, Himachal Pradesh. Second, the majority of the research is focused on textual analysis and the visual discourse is not given much attention. Third, there is a lack of literature on relationships between visual representation and audience perception, particularly in regional media contexts.
This paper fills in these gaps by orienting the studies on newspaper images as one of the most common ways of communicating climate and analyzing their effects on how the populations in a given geographical location perceive them.
3. Research Methodology
This chapter describes the research design that will be
used to explore the issue of climate change as a visual presentation in
newspapers and its ability to shape the perceptions of the audience in Himachal
Pradesh. Since the study is interdisciplinary, a mixed-methods approach is
used, combining the methods of qualitative and quantitative research. This will
make it possible to understand comprehensively, how climate-related visuals are
being portrayed in newspapers as well as how they are perceived by different
audiences.
3.1. Research Design
and Approach
The current research paper is descriptive and analytical in nature as it critically analyzes climate change as a visual discourse and its effects on perception by the audience. The descriptive aspect aims at the discovery of patterns, frequency and features of climate related images in newspapers, whereas the analytical aspect examines the connection between such depiction and interpretations among the audience. A mixed method design is adopted, which combines the qualitative methods (thematic and semiotic analysis) with the quantitative methods (survey data statistical analysis). The research is based on a cross-sectional design as it captures the information that is available at a specific time frame to understand the latest trends in media practices and perception by the society. This type of approach is especially appropriate in the case of interdisciplinary research in which measurable patterns and interpretative insights are needed.
Figure 1
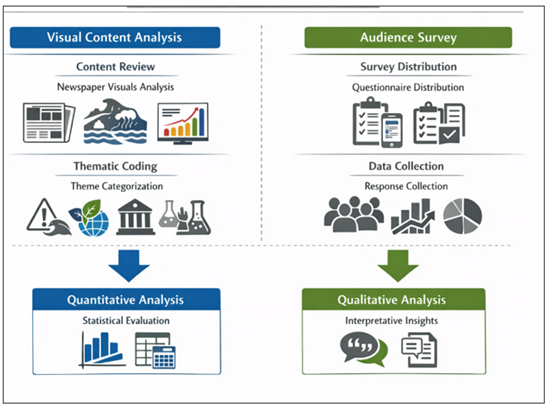
Figure 1 Research Design Framework Integrating Visual Content Analysis and Audience Survey
The research design presented in Figure 1 is the structured one used in this research that combines two complementary analytical elements: the visual content analysis and the analysis of the perception of the audience. The left part is the systematic analysis of newspaper images, such as a content analysis and thematic coding of these images, which allows identifying patterns, frames, and thematic allocation of climate change images. The right side shows the audience survey procedure, which includes passing questionnaires and collecting information to get the perceptions and interpretations of the readers. The two elements are united into quantitative and qualitative analysis, which guarantees a thorough analysis of the impact of the media. Quantitative analysis will give us statistical information on the trends and relationships, whereas qualitative analysis will give us interpretative information on the audience performances. This cohesive framework gives methodological rigor and enables a holistic examination of how visual discourse in the newspapers informs some concepts about how the public awareness, emotional involvement and environmental attitude can be influenced in the case of climate change.
3.2. Study Area:
Himachal Pradesh Context
Himachal Pradesh is chosen as the study area of focus because it is an ecologically sensitive area and constantly becoming susceptible to the effects of climate change. The mountainous nature of the state, relying on naturally found resources and facing threats of the environment like landslides, flash floods and glacial retreats, make it a very important area to study climate discourse. Also, the socio-economic setup of the area in which agriculture, tourism, and forestry are the main sources of livelihood, contributes even more to the topicality of climate communication. The newspapers still have a crucial role in delivering the information in the urban and rural regions of the state, and thus, they would be a suitable source of analysis. The peculiar interaction of the environmental vulnerability and the dependence on the media offer a good contextual background to examine the images of the climate change in terms of their representation and perception in the region.
3.3. Data Sources
The research will be based on both primary and secondary data so that a triangulated analysis is achieved. Structured questionnaires and semi-structured interviews with newspaper readers are used to collect primary data allowing to capture first-hand perceptions and interpretations of the visual content. To determine the trends in visual representation, secondary data will entail archived editions of the selected newspapers, over a given period. These archives are sources of photographs, infographics, and editorial images concerning climate change. Also, reports of government, environmental research and previous research publications are analyzed to provide a context to the findings. The combination of the various sources of data contributes to the reliability and validity of the study as the results received can be cross-verified and a balanced picture of the media content and reactions of the audience can be perceived.
3.4. Sampling
Techniques
A multi-stage sampling method is followed to make sure that media content as well as data on the audience is both representative and non-partisan. The selection of the newspapers in the first stage relies on the circulation, the relevance of the newspaper to the region, and also the diversity of languages both English and regional newspapers. The second stage involves sampling of climate-related visuals in newspaper editions during a specified time period, to cover various seasons and events. The third stage involves stratified sampling where the respondents are grouped together according to their age, education level, occupation and geographic location. This makes certain that different points of view are considered in the analysis. The size of the sample will be decided to ensure statistical significance, which is usually 100-300 respondents. This stratified method of sampling increases the generalizability of the results and allows methodological rigor.
3.5. Tools and
Techniques for Visual Content Analysis
The systematic approach to coding newspaper visuals involves visual content analysis through a set of codes that classify and measure different attributes of newspaper visuals. Every visual item is assessed on the basis of certain parameters, which include: type (photograph, infographic, cartoon), thematic focus (disaster, awareness, policy, human impact), positioning in the newspaper and emotional tone used. A coding sheet is created to bring about consistency and objectivity in the classification.
3.6. Methods for
Audience Perception Analysis
The perception of the audience is analyzed using both a quantitative study of surveys and interpretation of the results in a qualitative manner. Variables like awareness, emotional response, perceived credibility and behavioral intention are measured using structured questionnaires with Likert-scale items. Statistical analysis involving mean, standard deviation, correlation analysis are used to determine relationships between exposure to visuals and audience perception.
3.7. Ethical
Considerations
The study is done in line with the set ethical criteria so that the credibility and integrity of the study is ensured. The informed consent serves to notify the research participants of the purpose of the research and make them participate in the research willingly. The confidentiality and anonymity are highly upheld, and no personal identifiers are revealed in the analysis and reporting. Data collected is strictly used in academia and is kept in a safe place, to prevent unauthorized data access. In order to minimize bias, there is an effort to adopt unbiased methods of data collection and analysis. Moreover, the attention is paid to such aspects as the need to properly reference visual materials being employed in the study and the inability to infringe copyright standards. Such ethics considerations render the study more valid and promote academic responsibility.
4. Analysis of Newspaper Visual Representation
This section holds an in-depth examination of the visuals of climate change in the selected newspapers in terms of patterns, framing tactics, thematic allocation, and comparative understandings. It is a synthesis of quantitative measures of frequency to a qualitative analysis that will understand the ways in which visual discourse generates climate discourses in Himachal Pradesh.
4.1. Types of Visual
Content
This analysis shows that newspapers typically employ photographic images as the main tool of presenting the climate change followed by info graphics and a small number of editorial cartoons. Photographs are also event oriented in the sense that they are taken during real time disasters such as floods, landslides, forest fires and the like. Complex environmental information (e.g. increase in temperature or change in rainfall) is simplified with info graphics and critical commentary on policy and governance questions is created with cartoons. The prevalence of photographs comments on the inclination to reality and immediacy, which enhance the engagement of feelings in the readers. The comparatively few info graphics, however, tells us that there is a gap in visual communication of explanations, which can be bridged to explain the overall climate trends to the people better.
4.2. Framing of
Climate Change Narratives
The idea of visual framing is incredibly important in the way climate change is perceived. The paper has found three prevailing frames, disaster-oriented, human-impact, and policy-related frames. The most common disaster-themed visuals include disaster infrastructure (ex: waterlogged areas or broken roads) and highlight the seriousness and urgency of climate change. The pictures of human-impact underline the pain of the impacted populations, thus creating compassion and worry. Images of government meetings or environmental campaigns are less common but relevant to the visuals in terms of policy relevance. Disaster framing can be advantageous as it can create greater awareness but can also result in a sense of inevitability and powerlessness unless it is countered by visuals that are more solution-focused.
4.3. Frequency and
Placement of Climate-related Visuals
The frequency analysis shows that the visuals connected with climate are more frequent on the days of extreme weather conditions and season change. The majority of the visuals lie on inner pages, with very little of them on the front page, which may indicate that not much emphasis was put on editorial hierarchy. The position plays a crucial role in terms of visibility and reader interactions, and images on the first page are likely to be noticed at a glance. Also, bigger images will be more linked to big events whereas smaller images will be used to accompany day-to-day reporting. This trend indicates intermittent nature of climate stories, whereby coverage of the crisis is most intense when there is a crisis, and reduces when all is stable.
Table 2
|
Table 2 Distribution of Visual Themes in Newspapers |
||
|
Theme |
Number of Visuals |
Percentage (%) |
|
Natural Disasters |
85 |
34% |
|
Environmental Awareness |
60 |
24% |
|
Human Impact |
50 |
20% |
|
Policy & Governance |
35 |
14% |
|
Scientific Data |
20 |
8% |
A thematic distribution Table 2 indicates that the
visuals of natural disasters prevail (34), then the awareness-related visuals
(24). Human impact visuals represent 20% which means that there is a moderate
focus on social consequences. The number of policy related visuals and scientific
representations is lower in comparison which shows a gap in conveying long term
strategies and data-driven insights.
Figure 2

Figure 2 Thematic Distribution of Climate Change Visuals
The Figure 2 demonstrates how much the visuals of disasters prevailed in the newspapers. It is evident in the bar/pie chart that the most attention is paid to the events that immediately happen and are visually striking, and scientific and policy-related visuals are underrepresented. Such imbalance implies that newspapers emphasize on attention grabbing information rather than the informative or solution based communication. These trends can contribute to an overall perception of the population in that they raise awareness of short-term risks instead of creating action and understanding in the long term.
Table 3
|
Table 3 Comparative Visual Representation Across Newspapers |
||||
|
Newspaper Type |
Disaster (%) |
Awareness (%) |
Policy (%) |
Scientific (%) |
|
National Daily |
30 |
25 |
20 |
15 |
|
Regional Daily |
38 |
22 |
12 |
8 |
|
Local Newspaper |
42 |
20 |
10 |
5 |
Comparison shows that the local newspapers dwell more on disaster pictures (42%), as they are oriented towards real-time local concerns presented in Table 3. The coverage offered by national dailies, policy and scientific visuals, is relatively balanced, whereas the coverage offered by regional newspapers lies in between. This means that the magnitude and the readership of newspapers determine the kind of visual discourse that is given out.
Figure 3
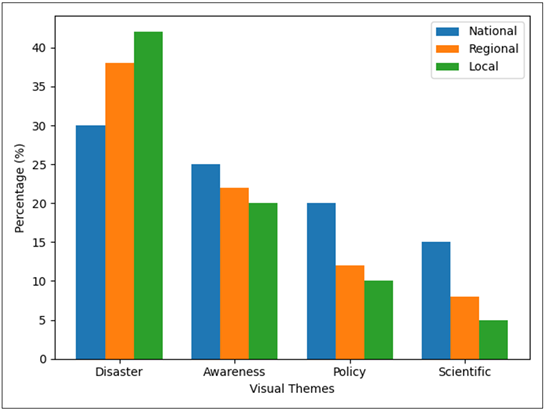
Figure 3 Comparative Analysis of Newspaper Categories
The comparison presented in Figure 3 reveals that there are differences in visual representation among the various categories of newspapers. The local newspapers focus on disaster-related images as they are closer to the regions of disaster whereas the national newspapers contain more policy and scientific coverage. This difference implies that the visual discourse is greatly informed by the expectations of the audience and editorial priorities. The results also show that the local media must be open to adding more awareness and solution-oriented images to offset the narrative.
In general, the discussion shows that newspaper imagery in Himachal Pradesh is strongly biased towards a disaster-focused approach, and there is a weak representation of scientific and policy views. This bias creates a perception on the part of the masses by emphasizing short-term dangers and overlooking long-term remedies. The following section looks at how the audiences decipher these images and to what degree they can affect awareness and action.
5. Audience Perception and Interpretation
This part explores the meaning and perception of climate change images as perceived by readers in Himachal Pradesh that are featured in newspapers. The analysis combines both data on surveys and qualitative data to examine the level of awareness, emotional reactions, patterns of interpretation, and behavioral implications. The results offer an essential connection to media representation and general comprehension about how well visual discourse can communicate climate-related information and its weaknesses.
5.1. Demographic
Profile of Respondents
It has a varied sample of respondents which is based on age, education, occupation and geographic location. Most of the respondents are between the age of 18 and 35 and then those in the middle age (36-55) but few senior citizens. Levels of education are secondary school and post-graduate to guarantee different levels of interpretative skills. Students, professionals, farmers, and government employees are also occupational groups which represent the socio-economic diversity of Himachal Pradesh. This demographic heterogeneity is critical to comprehending the perception and response of various groups to visuals related to climatic conditions because the interpretation usually depends on individual experiences and the level of knowledge.
5.2. Awareness
Levels of Climate Change
Table 4
|
Table 4 Awareness Levels Among Respondents |
||
|
Awareness Level |
Number of Respondents |
Percentage (%) |
|
High Awareness |
95 |
38% |
|
Moderate Awareness |
110 |
44% |
|
Low Awareness |
45 |
18% |
The data shows that most of the respondents (82 percent) have moderate awareness about climate change, 38 percent of whom showed high awareness as shown in Table 4. This indicates that the information presented in the newspapers (including graphics) plays a vital role in aiding people to know. Nevertheless, the fact that 18% of the respondents were low-awareness shows that it is necessary to develop more effective communication plans, especially in rural or the less-educated groups.
Figure 4

Figure 4 Awareness Distribution Among Respondents
Figure 4 indicates that moderate awareness is predominant among the respondents after which there is high awareness. The fact that the percentage of the low-awareness groups is relatively small suggests that the discussion of the climate has become widespread. The distribution is, however, also indicative of the idea that the awareness is not always equally deep, so it is necessary to increase clarity and accessibility in visual communication.
5.3. Interpretation
of Newspaper Visuals
Climate change visuals are perceived by the respondents mostly using emotional and experience interpreters. The images connected to disasters are usually accompanied by fear and the urgency, whereas the images of degraded nature lead to the feeling of concern and responsibility. The infographics are viewed as informative, and are not remembered as often as photographs, which shows that the impact of emotional engagement is more prominent than mental processing. Besides, more educated people are more critical in the way they interpret visuals, seeing the reasons behind it, and the consequences in the long term, others are more interested in the immediate visual effect. Such a difference highlights the need to create graphics that are captivating and educational.
Table 5
|
Table 5 Impact of Visuals on Public Opinion |
||||
|
Impact Type |
Strongly Agree (%) |
Agree (%) |
Neutral (%) |
Disagree (%) |
|
Increases Awareness |
45 |
35 |
10 |
10 |
|
Creates Emotional Impact |
50 |
30 |
10 |
10 |
|
Influences Opinion |
40 |
38 |
12 |
10 |
|
Encourages Discussion |
35 |
40 |
15 |
10 |
The findings suggest that a good number of the respondents think that images enhance awareness and cause emotion. About three-quarters (78) of them said that they are affected by visuals in their views, three-quarters (75) said that they are motivated to talk about climate change in the visuals in Table 5. These results underscore the influence of visual media in the formation of the discourse of people.
Figure 5
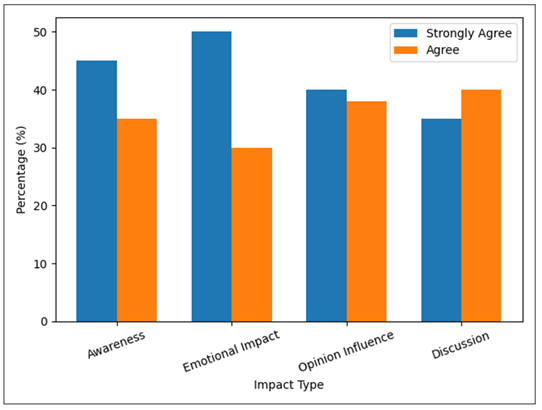
Figure 5 Impact of Visual Content on Public Opinion
Figure 5 illustrates that emotional influence and creation of awareness are the most notable impacts of visual material. The fact that the levels of agreement are quite high in all of the categories proves that visuals are an important element of shaping the opinion of the masses. Nonetheless, the neutral responses indicate that not everything is as effective in visual and design, and communication is not same across the board.
6. Conclusion and Future Directions
The current paper has discussed climate change as a visual discourse in newspaper media and the effect it has on the audience perception in Himachal Pradesh. The study offers a thorough explanation of the construction of climate narrative, communication and interpretation processes by combining visual content analysis and audience-based empirical insights. These results underscore that newspapers still have a crucial role in influencing the discourse of the people, especially in the areas where newspapers are still a reliable and easily available source of information. Among the main findings of this paper is the prevailing nature of disaster-related images in newspapers. Most images that are related to climate show floods, landslides, forest fire and other extreme events. Though these types of representations are useful in attracting attention and creating a sense of urgency, they are more likely to focus on short-term effects and not on the long-term climate processes. This bias in representation can cause the perception of climate change as a set of individual events, as opposed to a systematic and continuous process. Also, the comparatively small presence of scientific illustrations and policy-driven visuals are indicative of a lack of explanatory and solution-oriented communication. In terms of perception by the audience, the study demonstrates that the visual content is very effective in creating awareness and emotional appeal. A high percentage of the respondents said that the visuals in the newspaper made them feel they have a better understanding of climate change and the local impacts of climate change. Disaster related images were also found to be more likely to evoke emotions like concern, fear and empathy, which is an indication of the power of visual media. Nevertheless, the results also demonstrate a significant weakness: on the one hand, visuals are effective in raising awareness and attitudes, on the other hand, their effects on the actual change in behavior are moderate. This disconnection between perception and action implies that awareness is not enough to lead to sustainable environmental practices. The interdisciplinary nature of the approach that this research took highlights the significance of integrating knowledge of media studies, environmental science, and social psychology in the analysis of climate communication. The article adds to the literature in the field by focusing on visual discourse, which in most cases has been under-researched in preference to textual analysis. Moreover, through the target of a given geographical context, Himachal Pradesh, the study fulfills a major gap in the literature of the region especially in the Indian Himalayan ecosystem. Besides its contributions, the study has some limitations. The discussion is limited to a few chosen newspapers, and a narrow period of time, which might not be representative of the long-term trends in media reporting. Moreover, the perception of the audience is also conditioned by a variety of external factors, including education, socio-economic conditions, personal experiences, which are not entirely covered in the framework of this study. The limitations of the research can be overcome in future through the introduction of longitudinal analysis, geographical coverage, and the use of digital media like social media and online news portals.
CONFLICT OF INTERESTS
None.
ACKNOWLEDGMENTS
None.
REFERENCES
Bodha, K. D., Yadav, V. K., and Mukherjee, V. (2020). Formulation and Application of Quantum-Inspired Tidal Firefly Technique for Multiple-Objective Mixed Cost-Effective Emission Dispatch. Neural Computing and Applications, 32, 9217–9232. https://doi.org/10.1007/s00521-019-04433-0
Bogl, M., Aigner, W., Filzmoser, P., Lammarsch, T., Miksch, S., and Rind, A. (2013). Visual Analytics for Model Selection in Time Series Analysis. IEEE Transactions on Visualization and Computer Graphics, 19(12), 2237–2246. https://doi.org/10.1109/TVCG.2013.222
Bryant, R. A. (2019). Post-Traumatic Stress Disorder: A State-of-the-Art Review of Evidence and Challenges. World Psychiatry, 18(3), 259–269. https://doi.org/10.1002/wps.20656
Chae, J., Thom, D., Bosch, H., Jang, Y., Maciejewski, R., Ebert, D. S., and Ertl, T. (2012). Spatiotemporal Social Media Analytics for Abnormal Event Detection and Examination Using Seasonal-Trend Decomposition. In Proceedings of IEEE Conference on Visual Analytics Science and Technology (VAST) (143–152). IEEE. https://doi.org/10.1109/VAST.2012.6400557
Gao, T., Hullman, J. R., Adar, E., Hecht, B., and Diakopoulos, N. (2014). Newsviews: An Automated Pipeline for Creating Custom Geovisualizations for News. In Proceedings of the 32nd Annual ACM Conference on Human Factors in Computing Systems (3005–3014). ACM. https://doi.org/10.1145/2556288.2557228
Kumar, S., Rani, S., Jain, A., Kumar, M., and Jaglan, P. (2023). Automatic Face Mask Detection Using Deep Learning-Based Mobilenet Architecture. In Proceedings of IC3I 2023 (1075–1080). IEEE. https://doi.org/10.1109/IC3I59117.2023.10397772
McLaughlin, K. A., Koenen, K. C., Bromet, E. J., Karam, E. G., Liu, H., Petukhova, M., Ruscio, A. M., Sampson, N. A., Stein, D. J., Aguilar-Gaxiola, S., Alonso, J., and others. (2017). Childhood Adversities and Posttraumatic Stress Disorder: Evidence for Stress Sensitisation in the World Mental Health Surveys. The British Journal of Psychiatry, 211(5), 280–288. https://doi.org/10.1192/bjp.bp.116.197640
Panicker, S. S., and Gayathri, P. (2019). A Survey of Machine Learning Techniques in Physiology-Based Mental Stress Detection Systems. Biocybernetics and Biomedical Engineering, 39(2), 444–469. https://doi.org/10.1016/j.bbe.2019.01.004
Poongodi, M., Sharma, A., Hamdi, M., Maode, M., and Chilamkurti, N. (2021). Smart Healthcare in Smart Cities: Wireless Patient Monitoring System Using IOT. The Journal of Supercomputing, 77(11), 12230–12255. https://doi.org/10.1007/s11227-021-03765-w
Rani, S., Lakhwani, K., and Kumar, S. (2023). Knowledge Vector Representation of Three-Dimensional Convex Polyhedrons and Reconstruction of Medical Images Using Knowledge Vector. Multimedia Tools and Applications, 82, 36449–36477. https://doi.org/10.1007/s11042-023-14894-0
Sahoo, S. (2022). Artificial Deep Neural Network in Hybrid PV System for Controlling the Power Management. International Journal of Photoenergy, 2022, 1–12. https://doi.org/10.1155/2022/9353470
Venkatanaresh, M., and Kullayamma, I. (2022). A New Approach for Crop Type Mapping in Satellite Images Using Hybrid Deep Capsule Auto Encoder. Knowledge-Based Systems, 256, 109881. https://doi.org/10.1016/j.knosys.2022.109881
|
|
 This work is licensed under a: Creative Commons Attribution 4.0 International License
© ShodhKosh 2026. All Rights Reserved.