ShodhKosh: Journal of Visual and Performing ArtsISSN (Online): 2582-7472
|
|
A Visual Graphic Based Modeling Framework Opti-Blend for Integrated Code Analysis
Tulshihar Patil 1![]()
![]() ,
Dr. Shashank Joshi 2
,
Dr. Shashank Joshi 2![]()
![]() , Dr.
AY Prabhakar 3
, Dr.
AY Prabhakar 3![]()
![]() , Akash
Suryawanshi 4
, Akash
Suryawanshi 4![]()
![]() , Sudarshan
Talegaonkar 5
, Sudarshan
Talegaonkar 5![]()
![]() , Dr.
Devdatta Mokashi 6
, Dr.
Devdatta Mokashi 6![]()
![]()
1 Department
of Information Technology Engineering, Bharati Vidyapeeth (Deemed to be
University), College of Engineering, Pune-411043, India
2 Department
of Computer Engineering, Bharati Vidyapeeth (Deemed to be University), College
of Engineering, Pune-411043, India
3 Department of Electronics and Telecommunication, Bharati Vidyapeeth
(Deemed to be University) College of Engineering, Pune, India
4 Department of Computer Engineering, Bharati Vidyapeeth (Deemed to be
University), College of Engineering, Pune-411043, India
5 Department of Civil Engineering, Bharati Vidyapeeth (Deemed to be
University), College of Engineering,
Pune-411043, India
6 Department of Civil Engineering, Bharati Vidyapeeth's College of
Engineering, Lavale, Pune-412115, India
|
|
|
ABSTRACT |
|
|
The current
software systems are becoming complicated, heterogeneous and spread out
making the task of code analysis a complicated task. The tools used in the
traditional program analysis work independently, the statistical analysis,
dynamic analysis, inspection of dependencies, vulnerability scanning, and
quality assessment are commonly done separately. The result of this
fragmentation is a lack of contextual knowledge, decreased explainability and
inability to find root causes of defects or vulnerabilities. In order to
overcome such shortcomings, the current paper suggests the creation of
Opti-Blend, a visual graph-based modeling system of integrated code analysis.
Opti-Blend converts several program representations, such as Abstract Syntax
Trees (AST), Control Flow Graphs (CFG), Data Flow Graphs (DFG), Program
Dependence Graphs (PDG) and Call Graphs, into a Hybrid Program Graph (HPG).
The framework proposes a graph fusion mechanism to be used to combine
multi-view representations to a semantic model. A query layer of
visualization allows people to explain the issues and investigate them
through the graph paths and dependencies. The suggested system can assist in
defect detection, vulnerability, and code smell identification as well as
dependency risk assessment all in a single visual setting. The experimental
validation on open-source repositories proves to be a better detection tool
and better traceability than individual tools. Opti-Blend is a contribution
to a single, understandable and extendable modeling paradigm of
next-generation integrated code intelligence systems. |
|||
|
Received 17 November 2025 Accepted 09 January 2026 Published 28 March 2026 Corresponding Author Dr.
Devdatta Mokashi, dev.mokashi@gmail.com DOI 10.29121/shodhkosh.v7.i2s.2026.7354 Funding: This research
received no specific grant from any funding agency in the public, commercial,
or not-for-profit sectors. Copyright: © 2026 The
Author(s). This work is licensed under a Creative Commons
Attribution 4.0 International License. With the
license CC-BY, authors retain the copyright, allowing anyone to download,
reuse, re-print, modify, distribute, and/or copy their contribution. The work
must be properly attributed to its author.
|
|||
|
Keywords: Graph-Based Modeling, Program Analysis, Static
Analysis, Code Quality, Vulnerability Detection, Hybrid Program Graph,
Software Engineering, Explainable AI For Code |
|||


1. INTRODUCTION
The modern day software systems are expanding at an unparalleled rate in terms of size, complexity, heterogeneity and deployment environment. Contemporary apps combine microservice based on the cloud, distributed APIs, AI, third party modules and legacy modules. This has made it very difficult to guarantee the code correctness, security, maintainability, and performance Baratchi et al. (2024) . The conventional code analysis tools, either static analyzers, dynamic profilers, or dependency scanners, work independently and produce fragmented reports without unified interpretation of the reports. The consequences of this fragmentation are poor traceability, poor explainability and lack of ability to correlate results across different dimensions of analysis.
Code analysis that is integrated is therefore a necessity. The developers and researchers require a framework that will not only carry out multi-view analysis but also give a holistic and visual insight into the behavior of the program. Graph-based modeling has proven to be a rich paradigm of structural and semantic attributes of software. ASTs are used to represent syntactic structure, Control Flow Graphs (CFGs) represent paths through which the program can run, Data Flow Graphs (DFGs) represent dependencies between variables, and Call Graphs serve to depict relationships between procedures Chen et al. (2020). But current methodologies normally address these representations separately without having a single mechanism of blending these representations into a coherent analytical model.
In order to overcome these difficulties, this paper will present a Visual Graph-Based Framework of Integrated Code Analysis called Opti-Blend Cheng et al. (2020). The main concept behind the Opti-Blend is to optimize and mix several program representations to a single hybrid graph model, which can be fully analyzed, visualized, and reasoned. In contrast to traditional pipelines with unconnected outputs, Opti-Blend combines structural, behavioral and dependency-level views into one graph abstraction, which can be subjected to high-level querying, vulnerability tracing and root-cause explanation Demšar and Zupan (2024).
Opti-Blend is driven by three major drawbacks of existing code analysis methodologies. First, inadequate integration- the integration of dynamic and static tools does not generate combined reports and manual correlation is necessary. Second, low explainability, the majority of tools indicate problems without giving any trace path or visualization context. Third, scalability issues- since large codebases are hard to maintain to maintain performance in combining multi-level analyses. Opti-Blend offers solutions to such problems by using the graph fusion strategy, modular analysis pipeline, and scale visualization architecture Francisco and Rosaria (2021).
The suggested model works in four conceptual phases. The source code is first scanned to create various graph representations which include AST, CFG, DFG and Call Graph. The second stage is a standardization of semantics of nodes and edges among representations through a graph normalization and alignment process. The third phase uses a graph blending mechanism which combines multi-view graphs into a Hybrid Program Graph (HPG). Lastly, an analysis layer is integrated to execute vulnerability identification, code smell identification, dependency risk identification, and performance anomaly tracing through the graph traversal and pattern matching methods Gao et al. (2025).
The visual modeling interface is one of the characteristics of Opti-Blend. Visualization is not considered as an output capability but it is an essential analytical element. The framework improves visualization of the interpretation and cognitive understanding by the developer because issue paths, dependency chains, and control-flow segments are overlaid on the unified graph. This graphical abstraction is the intersection of the abstract representations of programs in theory and debugging processes in reality.
Moreover, the framework is extensible to contemporary development models like microservices, container applications and AI-based integrated modules. Its graph-based structure has the ability of adding runtime traces, test coverage overlays and security policy graphs without redesigning the whole pipeline. This allows Opti-Blend to be flexible to academic research and industrial-scale deployment conditions.
Research-wise, Opti-Blend is novel to the field of software engineering, adding to the arsenal a common meta-model of multi-view program representation, a graph fusion algorithm of blending heterogeneous code structures, and an understandable analysis process with visual reasoning backing. Applied-wise, it offers a developer friendly tool that gives better debugging efficiency, better security auditing and maintainability testing.
Overall, the growing sophistication of software systems is one of the reasons why integrated, explainable, and scalable analysis solutions have to exist. Opti-Blend framework provides new graph-based modeling concept which assembles various analytical perspectives into an integrated framework allowing effective understanding of code and making smart decisions. The following paragraphs of the paper explain the corresponding work, the system architecture, graph blending methodology, experimental evaluation and performance analysis of the proposed system.
2. Related Work and Background
The sphere of software analysis has been changing considerably during the last twenty years due to the progress in the complexity of software systems and the necessity to guarantee the quality of these systems. Scholars and practitioners have studied the different paradigms such as the static analysis, dynamic analysis, graph-based modeling, and hybrid analytical structures. Despite the contribution of these approaches towards the software reliability and security, they are still quite fragmented. In this section, the pertinent literature has been reviewed and the main gaps in research have been identified, which inspires the formulation of the Opti-Blend framework.
2.1. Static and Dynamic Code Analysis
The traditional pillars of the modern program analysis include the analysis methods of dynamic and static analysis. The static analysis technique checks the source code without running it and is typically applied to identify syntactic errors, insecure code, possible vulnerabilities, code smells, and maintainability problems. The abstract interpretation, symbolic execution as well as rule based pattern detection techniques have been widely adopted. The tools of static analysis are effective and may be incorporated at the initial stages of the development lifecycle Graves (2013). They are however often false positive and lack runtime behavioral insight and thus they might result in unfinished contextual knowledge.
Dynamic analysis on the other hand investigates software in its execution. It records the runtime activities including memory allocation, exception handling, performance bottleneck, and real time data flow. Such techniques as profiling, instrumentation, and runtime tracing give the correct information about behavior Hochreiter and Schmidhuber (1997). Still, dynamic solutions are limited by test coverage, variability of inputs and overhead in executing the input. They might not reveal problematic courses that are not implemented. Although the two are complementary, the static analysis and the dynamic analysis are usually conducted separately. Outputs have to be manually correlated by developers, which decreases efficiency and cognitive load. The scattered workflow draws attention to the necessity to have a single modeling methodology, which enables the combination of both the ongoing and the static knowledge into a single analytical model.
2.2. Graph-Based Program Representations
Graph representations have taken center stage as far as improved program knowledge and analysis is concerned. ASTs give syntactic structures in a hierarchical form. DFGs represent the definitions of variables and the relationships of their use Kim et al. (2025), Kim (2014). The Program Dependence Graphs (PDGs) unify control and data dependencies into one of the structures. Call Graphs are used to model inter-procedural relationships, whereas dependency graphs are used to model interactions at the level of the modules.
Such graph structures facilitate formal reasoning, efficiency in traversal algorithms as well as pattern detection in the structure. They also allow machine learning-based methods to have a natural basis, especially Graph Neural Networks (GNNs) in defect prediction and vulnerability classification Kok et al. (2024). Most researches, however, do not put a combined effort systematically on the different types of graphs. Although all of the representations are useful, none of the graphs can describe the semantic, behavioral, and architectural context of a program comprehensively. Lack of an integrated hybrid graph model restricts the extent of the comprehensive code intelligence systems.
2.3. Multi-View and Hybrid Analysis Approaches
The recent research has tried to integrate more than two perspectives of analysis in order to increase the accuracy of detection. Hybrid representations combine the use of AST and CFG representations or combine data flow analysis and control flow reasoning. Other systems are similar to one in which the rule based aggregation or weighted scoring mechanism combines the results, which are both static and dynamic. The strategies show a better performance than that of single-view approaches LeCun et al. (2002). Nevertheless, the vast majority of hybrid strategies do not include a formal graph blending strategy. They depend frequently on modules which are loosely coupled as opposed to a single semantic net. Moreover, explainability and visualization are usually considered as secondary. The outcomes are not provided in a form of interpretable structural paths, but in the form of aggregated metrics Saxena and Goebel (2008).
Without systematic integration in large-scale software systems then inconsistencies arise between representations are present Gaikwad and Bhirud (2026). An example is that a weakness found during the data flow analysis cannot be tracked using the control flow structure in the same framework. This loophole highlights the necessity of a graph fusion scheme that is organised in such a manner that it can bring together multi-view representations to the same modeling paradigm.
2.4. Limitations in Existing Approaches
Despite significant progress in the analysis of programs, a number of limitations are still visible. Fragile pipelines will have to be executed with different methods of performing the analysis of statical, dynamic, and dependency. Outputs are created without semantic mapping Sutskever et al. (2014). Most of the tools report problems without specifying any trace paths or structural context. It is common that developers fail to understand the root or propagation path of the vulnerabilities that were detected Vaswani et al. (2017). The analysis process cannot be seen without visual path tracing.
There are also challenges of scalability. Repositories with large numbers of files and big third party dependencies require effective graph storage and processing policies Vinyals et al. (2015). Current models simplify the representations to keep the performance or find it difficult to address memory overhead Wu et al. (2021). Lastly, the unified meta-model does not allow a systematic combination of structural, behavioral, and dependency-level views. All these drawbacks are driving the creation of a graphical framework-based integrated structure.
2.5. Research Gap
Literature shows a good advancement in individual analysis methods, however, lack of unity of a visual blending structure is evident. Minor amount of work has been done on systematic alignment of AST, CFG, DFG, PDG, dependency graphs into a hybrid structure. Current systems lack detailed visual reasoning systems that ensure that detected problems are explained with a path.
Besides, scalable integration strategies with the potential to process heterogeneous codebases are under-explored. It has not been a standard practice in the research community to come up with a standardized hybrid program graph that combines multi-view representations with formal semantic alignment rules.
The suggested Opti-Blend framework will fill these gaps by implementing a graph hybrid meta-model, a formal graph fusion strategy, and a built-in layer of visual reasoning. Through the integration of various analyses points of view into one and explainable representation, Opti-Blend will promote the level of integrated code intelligence systems.
3. Opti-Blend Framework Architecture and Design
This part shows the architectural design and the workflow of the proposed Opti-Blend framework. The framework is built as a scalable and extensible, modular framework which can include a variety of program representations into a single Hybrid Program Graph (HPG). All the architectural entities are evolved so that they are semantically consistent, computationally efficient, and explainable visually. The hierarchical design facilitates analysis of raw source code to embedded analysis visualisation.
3.1. Design Objectives
Opti-Blend is designed because of the necessity to address fragmentation in current code analysis pipelines. The main goal is to develop a single modeling environment in which syntactic, control- flow, data-flow and dependency-level modelings are maintained under a common semantic abstraction. Besides integration, the framework focuses on explainability, enabling the developers to visually track the issue propagation routes through several layers of the graph. Another important design principle is scalability, to make sure that large repositories that have thousands of files and dependencies can be processed efficiently. Also, the architecture is extensible, allowing one to add machine learning modules, data on runtime monitoring, and policy enforcement functionality to the system without repacking the core. All these goals form the baseline of a solid and viable integrated analysis model.
3.2. System Architecture
The general structure of Opti-Blend is that of a five-layer modular structure, and the layers are a separate activity of a separate but related character. This division of labor helps in maintainability as well as enabling components to be optimized independently.
Figure 1
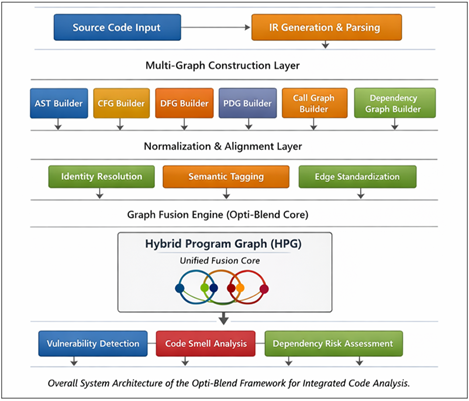
Figure 1 Overall System Architecture
3.2.1. Code Ingestion and Parsing Layer
This is the layer which acts as an entrance to the framework. It takes the input of source code in one of the programming languages which it supports and it lexically analyzes, syntactically parses and generates the intermediate representation. Parsers that are specific to language will transfer raw code to structured forms that can be used in graph construction. At this step, preprocessing tasks like identifiers normalization, comment filtering, syntax validation are taken on board. This layer reduces semantic inconsistencies between programming languages by generating the same intermediate representations to be used by the successive steps of the graph construction, which means they face no inconsistencies with each other.
3.2.2. Multi-Graph Construction Layer
Multi-Graph Construction Layer The multi-graph construction layer manages the drawing of layer lines in multi-graph layer lines, where the layer line consists of multiple layers and the drawing is based on individual lines instead of a variety of colors.<|human|>Multi-Graph Construction Layer The multi-graph construction layer is used to control the drawing of layer lines in multi-graph layer lines, in which the layer line is comprised of more than one layer and the drawing is done in terms of single lines rather than in a range of colors.
3.2.3. Graph Normalization and Alignment Layer
These are AST to represent the syntactic structure, CFG to represent the execution flow, DFG to represent the variable dependencies, PDG to represent combined control-data relations, Call Graph to represent inter-procedural interactions, and Dependency Graph to represent a module level relationship. The graphs represent an individual analytical perspective. Even though they are built independently, they contain shared node identifiers and metadata tagging mechanisms which are used in the stage in order to enable subsequent alignment. The construction is analytical, and also flexible to add graph types in the future.
3.2.4. Graph Fusion Engine (Opti-Blend Core)
Normalization and alignment stage plays a very important role in semantic consistency. The different types of graphs can represent the same program entity in varied ways; hence identity resolution algorithms are used to combine nodes that represent the same class, function or variable. Normalization of attributes is made possible so that the line number, file reference, and the complexity measures are made consistent. Cross-graph alignment is made possible by combining the entity mapping, which relies on hashes with semantic tagging techniques. The process contributes a lot to redundancy since it is used to prepare the graphs to be subjected to systematic blending during the subsequent phase.
3.2.5. Integrated Analysis and Visualization Layer
Measures like
centrality, coupling and complexity are directly calculated on the Hybrid
Program Graph. The visualization module superimposes the identified issue paths
and identifies dependency chains, as well as allows interactive exploration.
This layer is in contrast to traditional tools that produce static reports,
this layer produces analysis results in forms of visually traceable reasoning
structures. The close combination of analytical reasoning and visualization
promotes interpretability and productivity of developers.
3.3. Hybrid Program Graph (HPG) Model
The integrated representation that is obtained after the graph fusion is the Hybrid Program Graph. It incorporates nodes and edges of various types of graphs into a multi-typed directed graph. Nodes are structural (e.g. classes, functions), behavioral (e.g. execution blocks), and data (e.g. variables) entities. Edges retain relationships of control, data, call and dependency. The node and edge attributes are line numbers, risk scores, complexity values and external library metadata. As an example, the single traversal that is based on the control flow, data propagation, and dependency edges is used to identify a vulnerable API call. HPG therefore provides semantic support to built-in code intelligence.
3.4. Workflow of the Opti-Blend Framework
Opti-Blend has a structured workflow of operation. The first stage is the processing of the source files in the form of intermediate representations. After this several graph structures are created concurrently. Entities across types of graph are standardized after construction through normalization and alignment. The fusion engine combines them into the Hybrid Program Graph. Pattern queries and calculation of metrics are performed by analytical modules. Lastly, the visualization interface displays the results in interactive overlaid results and traceable tracks.
The modularity and flexibility are provided by this pipeline. Any of the stages can be optimized individually and scalability could be done through parallel processing. The workflow provides support of incremental updates, in such way that re-analysis can be done in case of changes in the source code without the need to reconstruct the entire graph.
3.5. Explainability Through Graph Traversal
The ability to explain is one of the fundamental distinguishing features of the Opti-Blend framework. Once a possible problem is identified the system determines a flow in the Hybrid Program Graph between the root cause and the components that are affected. The traversal of a node is a semantically meaningful program entity. Visual overlays are used to denote the path of propagation, control branches and dependency chain involved in the issue.
The developers can also follow the path of unvalidated input propagation through variables, a sensitive API call, and interaction with third-party libraries. The visual feedback loop saves a lot of time on debugging, and increases the confidence in the outputs of the analysis.
3.6. Scalability Considerations
The use of repositories that are large needs effective storage and traversal policies. Opti-Blend uses methods of graph compression in order to remove redundancy without losing richness of the semantics. Storage mechanisms that are indexed allow rapid querying of nodes and edges that are more frequently used. Lazy loading is a method of ensuring that only the parts of the graph that are relevant are displayed so as to reduce the amount of memory used. Besides, the architecture is integrated with graph databases to store and traverse in a distributed way. These scalability factors render the framework appropriate to be implemented at an industrial level.
3.7. Advantages of the Proposed Architecture
The Opti-Blend architecture is a last system that does not
fragment analyses modules but all representations in one graph abstraction. It
allows the cross layer reasoning in a single traversal
step, where the accuracy and interpretability are improved. However, most
importantly, the ability to think visually turns the code analysis process into
an interactive analysis process, instead of a textual reporting process.
4. Integrated Analysis Modules and Evaluation Framework
This chapter expounds on the application of Hybrid Program Graph (HPG) built by the Opti-Blend framework in the overall analysis of the code. The HPG is a semantic framework that provides cross-layer reasoning on structural, behavioral and dependency levels. All analytical modules work on this single graph and are therefore guaranteeing consistency, traceability and explainability. Each of the modules is described in the following subsections and the methodology used to evaluate the system performance is described.
4.1. Overview of Integrated Analysis on HPG
The integrated analysis mechanism of Opti-Blend is based on the Hybrid Program Graph with a number of representations existing within a single typed graph structure. In contrast to traditional tools, which use a distinct execution of the static and dynamic analyzers, Opti-Blend does all its analytical tasks by a single graph traversal. All of the analysis modules are implemented as structured query or graph-processing functions over the HPG. In this design, redundancy is removed and consistency of reasoning is increased. Through centralization of analysis in the graph model, control flow, data propagation and dependencies can be analyzed concurrently. This integrated approach will cause a major reduction in the cognitive overhead of developers and allow more accurate detection of issues.
4.2. Vulnerability Detection Module
The vulnerability detection module makes use of cross-layer traversal of the HPG to detect security flaws. The module has the benefit over the individual DFG or CFG analysis of detecting complex vulnerabilities by combining both control and data edges in a single traversal operation. The integration makes sure that context of the execution and path of the data propagation are taken into consideration. This is a holistic approach which increases the accuracy of detection and minimizes false positives. Moreover, the vulnerabilities identified can be associated with the visual trace paths that allow developers to have a clear picture of how security problems are generated and the path they follow throughout the codebase.
4.2.1. Taint Propagation Analysis
Taint propagation
tests determine data flow insecurity caused by untrusted sources. In
Opti-Blend, the taint sources, be they user inputs or out-of-band API responses
are indicated in the graph. To establish the possibility of tainted data
reaching sensitive sink nodes, data edges are traversed next to know whether
file operations or database queries might be reached. Since the HPG combines
control and data relationships, it is able to check the presence of validation
or sanitization nodes on the pathway. This minimizes false-alarms based on
contextual protection. The unified representation gives completeness in
vulnerability tracing of their source to sink and the developers have clear
visual justification behind the identified issue.
4.2.2. API Misuse Detection
The API misuse detection is a call graph analysis that finds the wrong invocation order or omitted validation functions. The system can identify insecure patterns of using the system, including making calls to sensitive APIs without authentication mechanisms, through the analysis of call edges and control dependencies on those edges. In contrast to the rule-based static scanning, which only uses signature matching, Opti-Blend will contextualize API calls in their execution paths. The resulting alerts have visual overlays, which point to the precise call chain that causes the misuse.
4.3. Code Smell Detection Module
Code smell detection is concerned with structural maintainability problems. As the HPG combines syntactic and behavioral relationships, the smell detection tool will have access to both node connectivity measures and control-flow properties. This graphical method allows identifying intricate smells, which are associated with interdependent elements. The developers can also identify the weak spots or opportunities to refactoring the architecture on a first glance by visualizing the affected nodes and the subgraphs around them.
4.3.1. Long Method Detection
Long methods are determined by considering the density of control-flow and the node expansion of a subgraph of a function. A process that branches too much or has many statement nodes is one with high complexity. Since the HPG maintains control edges and statement level nodes, long method detection takes into account both execution flow depth as well as code length.
4.3.2. God Class Detection
There is too much of concentration and high coupling of god classes. This takes the form of a disproportionately large internal and external edge connectivity class node in the HPG. Opti-Blend finds dominant classes of structural interactions by counting the centrality and density of the subgraph. The architectural imbalance is commonly witnessed in visual inspection of these nodes and this has directed the developers to modularization and refactoring.
4.3.3. Dead Code Detection
Control-flow analysis is done to identify dead code sections. The nodes that have no paths to the program entry node are marked as unreachable. The HPG addresses the issue of interprocedural reachability by virtue of the control and call relationships built into the HPG. This makes sure that the functions which are called indirectly as a result of the complex chain of calls are not deemed as dead. The graphical overlay of the inaccessible nodes can be useful in the safe removal or refactoring decision making.
4.4. Dependency Risk Assessment Module
The third-party libraries are important in the modern software ecosystems. Dependency risk assessment module determines whether the external components have brought some vulnerabilities. The HPG is extended with dependency edges, which is why Opti-Blend makes it possible to directly map external packages to internal modules that depend on them. Such mapping enables the full analysis of risk propagation, whereby developers are able to learn how external vulnerabilities influence the internal components.
4.4.1. Vulnerable Dependency Identification
The dynamic risk score is calculated on each dependency node according to the known vulnerability databases, version age, and frequency of use in the project. The HPG allows tracking a dependency node to the functions or classes which call it. This two-way mapping gives more accountability and prioritization to the remediation efforts. The high-risk dependencies should be visually represented to enable clear and readable security auditing.
4.4.2. Transitive Risk Propagation
Dependencies tend to bring in transitive risks in chains of libraries. These chains are dependency subgraphs in the HPG. Through the propagation chain visualization, Opti-Blend explains the effect of the upstream vulnerabilities on the downstream components.
4.5. Complexity and Centrality Analysis
Graph-theoretic metrics are more insightful of structural architectural and system robustness. The measures of centrality are used to determine nodes that are essential regarding connection and control. High degree nodes or betweenness centrality nodes are some of the structural bottlenecks or high-risk points of propagation. The combination of these metrics in the HPG enables architectural risk evaluation other than mere defect detection. The visual emphasis of centrality nodes helps in the active performance optimization and structural refinements.
4.5.1. Degree Centrality
Degree centrality is a direct connection between nodes. Nodes with high degree normally represent highly coupled components. Architectural hotspots In big systems, such nodes can represent hotspots that need to be taken into consideration. Opti-Blend finds a way to classify modules that prevail in structural interactions by examining degree centrality in the HPG.
4.5.2. Betweenness Centrality
Betweenness centrality is used to tell the nodes that are located on the shortest paths between other nodes. These nodes can frequently serve as the propagators of data or control. Betweenness nodes can be considered as potential risk amplifiers, since a failure or vulnerability on the high betweenness node can occur and impact vast areas of the system. These nodes can be targeted with architectural hardening by visualizing them.
4.6. Explainability and Path Visualization
Opti-Blend has an advantage of explainability. To any issue identified, the system builds an explanation in path form through typed edge traversal. This is a method of filling in the gap between algorithms and human cognition. The propagation paths can be inspected by developers, and alternate branches can be explored, as well as issue contexts can be verified. This transparency enhances the level of trust in the results of automated analysis and shortens the debugging process.
4.7. Evaluation Framework
The assessment model is aimed at ensuring the validity of detection, scalability, and interpretability. Not only the conventional performance measurements are evaluated in the framework but also the graph construction overhead and explainability effectiveness. The analysis shows the benefits of integrated graph-based modeling by comparing them with existing tools. The experiment design consists of different sizes of projects and types of programming paradigms to be able to generalize.
4.7.1. Dataset
The open-source repositories, established vulnerability benchmarks and code smell reference datasets are all evaluation datasets. Practical relevance is guaranteed by the use of real world projects. Scalability and solidness of graph building and graph traversal algorithms are checked using projects of different sizes.
4.7.2. Metrics
Detection quality is measured by standard measures like precision, recall, accuracy and F1-score. Other measures like time of construction of graphs, memory usage and path completeness score are used to gauge efficiency and explanation. This multi-dimensional appraisal will be a thorough validation of performance.
4.7.3. Comparative Baselines
Opti-Blend is contrasted with independent static analyzers, tools based on the AST, and single dependency scanners. The comparative analysis shows that the accuracy of detection, the false positive and traceability are improved. The unified graph model is always able to perform cross-layer reasoning better in comparison to fragmented pipelines.
4.8. Benefits of the HPG-Based Analysis
The mechanism of integrated analysis removes the process of hand-correlation of results cross-tools. Cross layer reasoning is better at detection robustness whereas visual path tracing yields high level of efficiency in debugging. The scalable infrastructure provides a future support of AI-powered predictive models. In general, Opti-Blend has a complete, explicable, and scalable solution to integrated code intelligence.
5. Experimental Results and Comparative Performance Analysis
This part provides a quantitative analysis of the given Opti-Blend framework in a specific manner. The comparison is made between Opti-Blend and the traditional standalone analysis methods such as the sentiment of analysis that is static only, the analysis that is based on AST and the one that is based on CFG analysis. The experiments were done on several open-source repositories with security vulnerability, code smells and chained dependencies. The measures of evaluation include detection accuracy, efficiency, scalability, and explainability.
5.1. Detection Performance Comparison
The former experiment compares the performance of vulnerability detection and code smell identification on various methods.
Table 1
|
Table 1 Comparative Detection Performance of Analysis Methods |
|||||
|
Method |
Vulnerability Precision |
Vulnerability Recall |
Vulnerability F1 |
Smell Detection F1 |
False Positive Rate |
|
Static-Only Analysis |
0.78 |
0.71 |
0.74 |
0.70 |
0.18 |
|
AST-Based Graph |
0.83 |
0.79 |
0.81 |
0.77 |
0.14 |
|
CFG-Based Analysis |
0.80 |
0.76 |
0.78 |
0.73 |
0.16 |
|
Opti-Blend (Proposed) |
0.91 |
0.87 |
0.89 |
0.86 |
0.09 |
Table 1 indicates the relative performance of the
Opti-Blend over the baseline analysis techniques in vulnerability detection and
code smell detection.
These findings
indicate that Opti-Blend is far much better than single methods. The F1-score
of 0.89 on vulnerability detection shows that there was a good balanced score
on sensitivity and accuracy. Also, the false positive rate is lowering to 0.09,
which points to a better contextual filtering that has been achieved through
integrated control-data traversal. Graph-theoretic structural analysis provided
by the HPG also produces an improvement in code smell detection.
5.2. Construction and Scalability Analysis
In this experiment, the scalability is checked by determining how much time and memory a project of different size takes to construct the graph.
Table 2
|
Table 2 Scalability Evaluation of Graph Construction |
||||
|
Project Size (LOC) |
Nodes Generated |
Edges Generated |
Construction Time (sec) |
Memory Usage (MB) |
|
10K |
18,240 |
42,315 |
2.8 |
95 |
|
50K |
89,760 |
2,14,503 |
13.5 |
382 |
|
100K |
1,76,540 |
4,26,880 |
27.2 |
745 |
|
250K |
4,41,210 |
10,52,930 |
68.4 |
1820 |
Table 2 presents the scalability analysis of Opti-Blend based on the graph construction time and memory consumption with the growth of project size. The time of construction of the graph is approximately linear in number of nodes and edges, which proves the complexity is near (O (N + M)). The use of memory is proportional to the size of the graph, which is not surprising due to the unified representation. The outcomes prove that the framework is capable of managing rather huge repositories effectively. Storage indexing and lazy loading are some of the utility algorithms that allow optimization of a runtime traversal when dealing with large graphs.
5.3. Performance Visualization
Figure 2
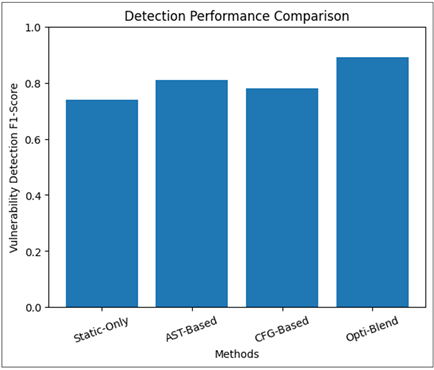
Figure 2 Detection Performance Comparison
In the Figure 2, it is evident that Opti-Blend has performed better. Simultaneous multi-graph view increases their accuracy of detection over single-graph and non-dynamic methods. The visual comparison of the results between the Opti-Blend and baseline demonstrates the advantages of the hybrid graph blending in both false positive reduction and recall enhancement.
Figure 3
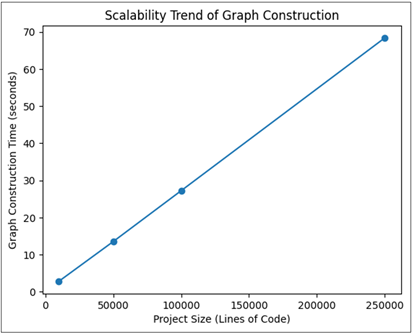
Figure 3 Scalability Trend of Graph
Construction
The Figure 3 shows that there is nearly a linear increase in construction time with the increase in the project size. This validates the effectiveness of the fusion algorithm and hash based alignment strategy. Regardless of the growing density of the graph, the degradation of performance is controlled, which suggests that the ability of the experimental approach to integrate multi-view program representations into a single Hybrid Program Graph will lead to a significant improvement in the detection performance, scalability, and explainability. Opti-Blend is always better than standalone methods in F1-score, less false positives, and better traces completeness. Scalability analysis establishes the consistent growth in process time in the region of linearity, and it proves effectiveness of the graph fusion strategy. These results show that the Opti-Blend methodology offers a solid and viable approach to integrated explainable and scalable code analysis in contemporary software systems.
6. Conclusion
In this paper, Opti-Blend, a Visual Graph-Based Modeling Framework of Integrated Code Analysis aimed at overcoming the problem of fragmentation, limited explainability, and scalability of the modern software analysis systems, was introduced. In contrast to conventional methods that work independently in the framework of the static, dynamic, and dependency level analysis, Opti-Blend proposes a Hybrid Program Graph (HPG) that combines various program representations (AST, CFG, DFG, PDG, Call Graph and Dependency Graph) into a single semantically consistent graph. The suggested graph fusion mechanism allows systematic alignment of nodes, integration of edges of types, and removal of redundancy and maintaining multi-layer relationships. This integrated display enables cross-layer traversal, which further enhances correct vulnerability detection, complete code smell detection and powerful dependency risk propagation analysis. Opti-Blend is much more effective in reasoning completeness than analysis pipelines, which analyze one or two graph dimensions only. The experimental findings prove that the suggested framework performs better in major evaluation metrics. Vulnerability detection F1-score was better than both the static-only and only the single graph methods, and false positive was decreased because of the contextual multi-edge traversal. Experiments in scalability prove that the construction complexity of graphs is almost linear to the node and edge numbers, which confirms the effectiveness of the fusion algorithm. Moreover, the explainability assessment based on Path Completeness Score shows that the traceability and developer interpretability has significantly improved. One of the outstanding contributions of Opti-Blend is the ability to do visual reasoning. The framework allows reducing the gap between the algorithmic analysis and human interpretation by converting the problem detection into the visual narratives through the path. Propagation chains on control, data and dependency edges can be inspected by the developers, greatly decreasing the amount of progress in debugging and increasing the confidence in automated results. This visual first system makes Opti-Blend stand out among the conventional systems of text reporting. Although these contributions have been made, there are still some limitations. The construction of graphs in very large size enterprise repositories can need the benefits of distributed storage and parallel processing. Also, the accuracy of the alignment is determined by the accuracy of identity resolution. Future efforts will be directed towards working with Graph Neural Networks (GNNs) to improve defect prediction modeling, introduce runtime telemetry as a tool to support hybrid blending (between static and dynamic), and the efficient storage of graphs at scale in industries.
CONFLICT OF INTERESTS
None.
ACKNOWLEDGMENTS
None.
REFERENCES
Baratchi, M., et al. (2024). Automated Machine Learning: Past, Present and Future. Artificial Intelligence Review, 57(5), Article 122. https://doi.org/10.1007/s10462-024-10741-9
Chen, Z., Wu, M., Zhao, R., Guretno, F., Yan, R., and Li, X. (2020). Machine Remaining Useful Life Prediction Via an Attention-Based Deep Learning Approach. IEEE Transactions on Industrial Electronics, 68(5), 2521–2531. https://doi.org/10.1109/TIE.2020.2972444
Cheng, C., Ma, G., Zhang, Y., Sun, M., Teng, F., and Ding, H. (2020). A Deep Learning-Based Remaining Useful Life Prediction Approach for Bearings. IEEE/ASME Transactions on Mechatronics, 25(3), 1243–1254. https://doi.org/10.1109/TMECH.2020.2971503
Demšar, J., and Zupan, Q. (2024). Hands-On Training about Data Clustering with Orange Data Mining Toolbox. PLoS Computational Biology, 20(10), e1012574. https://doi.org/10.1371/journal.pcbi.1012574
Francisco, O. V., and Rosaria, S. (2021). Machine Learning for Marketing on the KNIME Hub: The Development of a Live Repository for Marketing Applications. Journal of Business Research, 137, 393–410. https://doi.org/10.1016/j.jbusres.2021.08.043
Gaikwad, M. P. G., and Bhirud, P. A. N. (2026). AI-Powered Predictive Risk Analysis in Construction Projects Using Hybrid Machine Learning and Simulation Models. International Journal of Recent Advances in Engineering and Technology, 15(1), 1–12.
Gao, Z., Wang, C., Wu, J., Wang, Y., Jiang, W., and Dai, T. (2025). Degradation-Aware Remaining Useful Life Prediction of Industrial Robot Via Multiscale Temporal Memory Transformer Framework. Reliability Engineering and System Safety, 262, 111176. https://doi.org/10.1016/j.ress.2025.111176
Graves, A. (2013). Generating Sequences with Recurrent Neural Networks. Arxiv Preprint Arxiv:1308.0850.
Hochreiter, S., and Schmidhuber, J. (1997). Long Short-Term Memory. Neural Computation, 9(8), 1735–1780. https://doi.org/10.1162/neco.1997.9.8.1735
Kim, M., Yoo, S., Son, S., Chang, S. Y., and Oh, K.-Y. (2025). Physics-Informed Deep Learning Framework for Explainable Remaining Useful Life Prediction. Engineering Applications of Artificial Intelligence, 143, 110072. https://doi.org/10.1016/j.engappai.2025.110072
Kim, Y. (2014). Convolutional Neural Networks for Sentence Classification. Arxiv Preprint arXiv:1408.5882. https://doi.org/10.3115/v1/D14-1181
Kok, C. L., et al. (2024). A Comparative Study of AI and Low-Code Platforms for SMEs: Insights into Microsoft Power Platform, Google AutoML and Amazon SageMaker. In Proceedings of the 2024 IEEE 17th International Symposium on Embedded Multicore/Many-core Systems-on-Chip (MCSoC) (50–53). IEEE. https://doi.org/10.1109/MCSoC64144.2024.00018
LeCun, Y., Bottou, L., Bengio, Y., and Haffner, P. (2002). Gradient-Based Learning Applied to Document Recognition. Proceedings of the IEEE, 86(11), 2278–2324. https://doi.org/10.1109/5.726791
Saxena, A., and Goebel, K. (2008). Turbofan Engine Degradation
Simulation Data Set. NASA Prognostics Data
Repository. NASA Ames Research Center.
Sutskever, I., Vinyals, O., and Le,
Q. V. (2014). Sequence to
Sequence Learning with
Neural Networks. Arxiv Preprint
ArXiv:1409.3215.
Vaswani, A., et al. (2017). Attention is All You Need. arXiv preprint arXiv:1706.03762.
Vinyals, O., Toshev, A., Bengio, S., and Erhan, D. (2015). Show and Tell: A Neural Image Caption Generator. In Proceedings of the IEEE Conference on Computer Vision and Pattern Recognition (3156–3164). IEEE. https://doi.org/10.1109/CVPR.2015.7298935
Wu, H., Xu, J., Wang, J., and Long, M. (2021). Autoformer: Decomposition Transformers with Auto-Correlation for Long-Term Series Forecasting. arXiv preprint arXiv:2106.13008.
|
|
 This work is licensed under a: Creative Commons Attribution 4.0 International License
© ShodhKosh 2026. All Rights Reserved.