ShodhKosh: Journal of Visual and Performing ArtsISSN (Online): 2582-7472
|
|
Visualizing Biomarker Signatures: Explainable Deep Learning for Early Detection of Alzheimer’s and Neurodegenerative Disorders
Dr. Ravindra Keshav Moje 1![]() , Sai Kiran Oruganti 2
, Sai Kiran Oruganti 2![]() , Shakir
Khan 3
, Shakir
Khan 3![]() , Dr.
Santosh H Lavate 4
, Dr.
Santosh H Lavate 4![]()
![]()
1 Postdoctoral
Researcher, Lincoln Global Postdoctoral and Research Associate Programme, Lincoln University College, Malaysia
2 Lincoln
University College, Malaysia
3 University Centre for Research and Development, Chandigarh
University, Mohali 140413, India, College of Computer and Information Sciences,
Imam Mohammad Ibn Saud Islamic University (IMSIU), Riyadh, Saudi Arabia
4 AISSMS College of Engineering, Pune, Maharashtra, India
|
|
|
ABSTRACT |
|
|
The timely and
precise diagnosis of neurodegenerative diseases, especially Alzheimer disease
and related disorders, is a major clinical issue because of the subtle
changes in the pathology of the disease at the early stage, variable disease
progression, and low interpretability of the current artificial intelligence based systems of diagnosis. To overcome these
obstacles, this paper introduces XAI-BioNet, which
is a more explainable deep learning network, allowing a combination of
state-of-the-art feature selection, clear biomarkers discovery, and strict
laboratory validation of early neurodegenerative disease detection. XAI-BioNet uses the multimodal data including structural MRI,
longitudinal cognitive functions, and demographic characteristics.
Complementary architectures, such as VGG and MobileNetV2 to learn deep
features through hierarchical and efficient learning of spatial features on
the basis of neuroimaging data and LSTM networks to learn temporal dynamics
in cognitive progression are used to perform the deep feature extraction. The
dimensionality of features and redundancy are covered by the principal
component analysis and the recursive elimination of features that makes sure
to retain biomarkers that are clinically relevant. SHAP and Grad-CAM allow
obtaining model interpretability and making transparent attribution of the
diagnostic decision and neuroanatomical relevance. The comprehensiveness of
validation is carried out on heterogeneous, real world clinical data with
stratified cross-validation and cross-cohort evaluation undertaken to
determine the robustness, scalability and generalizability. The recommended
XAI-BioNet framework has a 96.2% diagnostic
accuracy, 94.7% sensitivity, 97.1% specificity, and AUC= 0.97, and it is more
effective than standalone VGG (89.6% accuracy), MobileNetV2 (91.8% accuracy),
and LSTM (92.9% accuracy) models. The findings emphasize the possibility of
XAI-BioNet being a clinically understandable and
scalable model of early diagnosis of neurodegenerative diseases. |
|||
|
Received 27 November 2025 Accepted 21 January 2026 Published 28 March 2026 Corresponding Author Dr.
Ravindra Keshav Moje, ravindra.moje@gmail.com DOI 10.29121/shodhkosh.v7.i2s.2026.7266 Funding: This research
received no specific grant from any funding agency in the public, commercial,
or not-for-profit sectors. Copyright: © 2026 The
Author(s). This work is licensed under a Creative Commons
Attribution 4.0 International License. With the
license CC-BY, authors retain the copyright, allowing anyone to download,
reuse, re-print, modify, distribute, and/or copy their contribution. The work
must be properly attributed to its author.
|
|||
|
Keywords: Neurodegenerative Diseases, Alzheimer’s Disease,
Explainable Artificial Intelligence (XAI), Deep Learning, Biomarker
Identification, Multimodal Neuroimaging, Clinical Decision Support |
|||


1. INTRODUCTION
One of the most urgent health concerns in the world is neurodegenerative diseases, such as the Alzheimer disease (AD) and its related disorders due to the progressive quality of these conditions, high rates among aging populations, and a significant socioeconomic impact. In itself, almost 6070 percent of dementia cases are due to the Alzheimer disease in the world at large with the prevalence projected to grow at a high rate as life expectancy expands Zia et al. (2025), AlMansoori et al. (2024). The clinical significance of accurate and early diagnosis is that the pathological alterations of amyloid deposition, tau build-up, atrophy of hippocampal and cognitive impairment commence a long time before the clinical manifestation is observed Dubois et al. (2023). Early detection during prodromal or mild cognitive impairment (MCI) stages facilitates a timely intervention to improve the management of the disease, better stratification of the clinical trial, and consequently, patient outcomes and improved healthcare expenditures Cabrini et al. (2025). Although this is necessary, traditional diagnostic methods are very dependent on clinical evaluation, cognitive testing, and expert interpretation of neuroimaging results which in most cases are deemed subjective, time-consuming and highly susceptible to inter-observer differences Kandiah et al. (2022). Machine learning models based on statistical and rule-based methods have been studied to aid diagnosis, but these methods are generally not able to work with high-dimensional neuroimaging data and nonlinear disease patterns Sekimori et al. (2024). Later on deep learning models have been shown to have better diagnostic capabilities, automatically learning discriminative features using MRI and longitudinal clinical data. However, the majority of state-of-the-art deep learning systems remain black-box systems, which give little understanding of the biomarkers or brain areas that make predictions, which constrains clinician confidence as well as regulatory approval Cardinali et al. (2025).
Deep learning needs to be integrated into clinical decision support systems thus requires transparency, interpretability, and robustness. The promising paradigm to close this gap is explainable artificial intelligence (XAI), which aims at offering human-readable explanations of model predictions and thus allowing clinicians to counter AI results with known neurobiological data Alam and Latifi (2025). The use of XAI in neurodegenerative diseases can be used to identify the presence of clear biomarkers, emphasize disease-relevant brain activation, and perform clinically meaningful reasoning, which is the main factor to be adopted in the real life of healthcare settings Singh et al. (2024). Driven by these issues, the proposed study is based on XAI-BioNet, an explainable deep learning model, a combination of an advanced feature extraction feature with transparent biomarker-driven modeling to diagnose early neurodegenerative diseases. The main ones are a multimodal, interpretable diagnostic model, systematic attribution of biomarkers with SHAP and Grad-CAM, and a complete cross-cohort validation that shows scalability and clinical reliability Alqahtani et al. (2023).
The major contribution of paper is stated as:
· Presents a deep learning model that can be explained and used to make a transparent early diagnosis of neurodegenerative disorders based on biomarkers.
· Combines VGG, MobilenetV2 and LSTM to compute the mutually exclusive spatial and temporal depths of neurodegeneration.
· Uses SHAP and Grad-CAM to determine clinically meaningful neuroimaging and cognitive biomarkers that can be attributed. It has shown greater than 96 % diagnostic accuracy with constant across-cohort results on heterogeneous and real-world clinical data.
2. Related Work
2.1. Conventional Neuroimaging and Cognitive Bio-Markers based Diagnostic Process
Conventional diagnostic methods of the Alzheimer disease and other neurodegenerative conditions have been mainly based on neuroimaging biomarkers, cognitive tests and clinician interpretation. Measurements by structural MRI such as loss of hippocampal volume, cortical thinning, and ventricular enlargement, and degeneration of local gray matter have been shown to be measurably related to disease development and progression Singh et al. (2024), Alqahtani et al. (2023). PET and other modalities of molecular imaging have also made it possible to visualize amyloid-2 and tau pathology in vivo, which has enhanced the specificity of diagnosing biologically Janghel and Rathore (2021). Improved cognitive biomarkers such as the MMSE, CDR and neuropsychological test batteries have been empirically demonstrated to be associated with functional decline and disease severity Zhao et al. (2021). Computationally based methods that were presented early to use a combination of these biomarkers, relied on statistical models and rule-based classifiers, and obtained moderate discrimination between healthy controls, MCI and Alzheimer disease Zhao et al. (2023). Nevertheless, these techniques assume a large amount of handcrafted functionality, but they are vulnerable to inter-rater effect and cannot be easily generalized to high-dimensional multimodal data Grover et al. (2023). Besides, linear model assumptions deter their potential of representing nonlinear neurodegenerative patterns which are complex and cannot be easily modeled Kishore et al. (2021). Although these methods provide clinical interpretability, their low robustness and prediction ability in heterogeneous groups of people drive the shift to data-driven learning systems Warren and Moustafa (2023).
2.2. Deep Learning Diagnosis of Alzheimer and Neurodegenerative Disease
Deep learning has already been shown to be useful in the diagnosis of neurodegenerative diseases with characteristics of learning hierarchical representations of neuroimaging and clinical data automatically. It has been empirically demonstrated that CNN-based models can work better than the classical machine learning approaches in the classification of Alzheimer in MRI-based by observing spatial and morphological changes in the brain Flanagan and Saikia (2023). Other architectures like VGG and ResNet allow the deep spatial feature abstraction but are computationally costly and mostly restricted to fixed imaging input data Loued et al. (2019). Lightweight and transfer learning algorithms, such as the MobileNet versions, have proven to be competitive in terms of accuracy with lower computing costs, and they can be applied to scalable and resource-limited clinical settings Xie et al. (2023). By contrast, LSTM networks have successfully been used on longitudinal cognitive and clinical responses, including the disease progression and cognitive decline pattern Yue et al. (2023). Nonetheless, CNNs are good in terms of their spatial pattern recognition whereby they do not consider the time dynamics unlike LSTMs which focus on the dynamics of progression though they do not consider the spatial neuroanatomical context. The current literature has tended to use a single paradigm of models in isolation, which restricts the capacity to integrate both spatial and time aspects of disease dynamics Gao et al. (2022). Moreover, most deep learning research focuses on performance optimization and does not consider interpretability or cross-cohort generalization Yu et al. (2020).
2.3. Explainable AI in Healthcare and Neuroimaging
Medical AI has become an essential need that requires explainable artificial intelligence (AI) to reduce the medical expertise in understanding the opaque deep learning models. In neuroimaging, explainability methods seek to identify disease-relevant regions of the brain as well as measure the contribution of biomarkers underlying model predictions Singh et al. (2024), Alqahtani et al. (2023). Gradient-based visualization techniques like Grad-CAM have been extensively used on CNN-based MRI models to indicate salient anatomical parts of the brain related to the pathology of Alzheimer Janghel and Rathore (2021). In the case of tabular and multimodal data, model-agnostic techniques, including SHAP, offer uniform feature attribution, which allows quantitative evaluation of the significance of the biomarkers both globally and at the patient level Zhao et al. (2021), Zhao et al. (2023). These methods increase clinician trust, ease in error analysis, as well as clinical reasoning. Notably, interpretability is a vital issue in clinical neuroimaging not only to trust, but also to regulatory compliance and diagnostic accountability. Even though it is promising, the available research can be seen as mostly employing explainability as a post hoc visualization but not as a part of the model design and validation Grover et al. (2023). In addition, little clinical reliability is assessed due to the lack of explanation stability and consistency between cohorts Kishore et al. (2021), Warren and Moustafa (2023).
2.4. Gaps in Interpretability, Generalizability and Real-World validation
Despite the recent progress in neurodegenerative disease diagnostics achieved through deep learning, there are still very critical gaps. There are a large number of high-performing models that are still black boxes and provide little understanding of the relevance of biomarkers or neurobiological plausibility thereby limiting their use in clinical practice and regulatory acceptance Flanagan and Saikia (2023). Another significant issue is generalizability because models that are trained on carefully selected benchmark data tend to become worse when they are used in clinical settings with heterogeneous imaging procedures and populations of patients Loued et al. (2019), Xie et al. (2023). In addition, practical validation on more than one cohort and healthcare environment is often lacking, and most of the studies use only one dataset assessment Yue et al. (2023). The available surveys and frameworks either are performance-driven deep learning or post hoc explainability, without taking a systematic approach to combining the features extraction method with explicit biomarker selection and real-world validation Gao et al. (2022), Yu et al. (2020). In contrast to the previous research, the present work integrates deep feature learning with explicit attribution of biomarkers, as well as with large-scale cross-cohort validation into a single explainable system, which directly overcomes the translational problem between experimental AI models and clinically deployable neurodegenerative disease diagnostics.
Table 1
|
Table 1 Comparison Between Existing Studies and The Proposed XAI-Bionet Framework |
||
|
Aspect |
Existing Studies |
XAI-BioNet
(This Work) |
|
Modeling focus |
Performance-driven deep
learning or post hoc explainability |
Unified explainable deep
learning with biomarker-driven design |
|
Feature learning |
Either spatial (CNN) or
temporal (LSTM) in isolation |
Integrated spatial (VGG,
MobileNetV2) and temporal (LSTM) modeling |
|
Biomarker identification |
Implicit or qualitative
visualization |
Explicit, quantitative
biomarker attribution using SHAP and Grad-CAM |
|
Explainability role |
Post hoc, optional |
Core design component with
clinical justification |
|
Validation strategy |
Single-dataset or limited
cross-validation |
Extensive real-world and
cross-cohort validation |
|
Clinical readiness |
Limited interpretability and
generalizability |
Transparent, robust, and
clinically deployable framework |
Recent extensive surveys have further highlighted that although there are enormous performance improvements, the majority of deep learning-based neurodegenerative disease diagnostic frameworks do not have inbuilt explainability and strong practical validation, and thus, their translation potential is constrained Pan and Wang (2022). These vulnerabilities have a direct clinical decision-making effect by making diagnosis less confident, restricting clinician mistrust, and preventing regulatory permission, thus adding time to patients facing risk of neurodegenerative disease to receive early intervention.
3. Materials and Data Description
3.1. OASIS Alzheimer’s Detection Datasets and Cohort Characteristics
This work employs the Open Access Series of Imaging Studies (OASIS) datasets used to detect the disease of Alzheimer that is one of the most popular benchmark datasets in the neurodegenerative disease research. The sample is a collection of cross-sectional and longitudinal structural MRI images of cognitively healthy participants, patients with mild cognitive impairment and those with trial diagnosed Alzheimer disease. The age range of participants is quite large and adult, which allows examining the age-related patterns of neurodegradation. Every subject has standardized clinical and cognitive annotations such as diagnostic labels and cognitive assessment scores. OASIS is a good disease to develop and test effective diagnostic models due to the range of stages and demographic characteristics of the diseases. Its open accessibility, standardized acquisition procedures, and vast previous validation also confirm reproducibility and comparative analysis, which is guaranteed by the clinical applicability and scientific competence of the suggested XAI-BioNet framework.
3.2. Neuroimaging Data Acquisition and Preprocessing
The T1 weighted data generated in the structural MRI were obtained using standardized protocols that guaranteed high resolution anatomy representation of brain structures. Preprocessing Preprocessing was done according to current neuroimaging pipelines, such as skull stripping, bias field correction, intensity normalization and spatial registration to a common anatomic template. Photos were downsampled and re-sampled to standard sizes to allow standard input to deep learning. Voxel-level representations were extracted together with region-of-interest-level features, including the volume of the hippocampal and the cortical thickness. The preprocessing methods ensure the minimization of noise, scanner related variability and enhance the strength of learned spatial features across subjects and cohorts.
3.3. Cognitive, Demographic, and Clinical Feature Description
Besides neuroimaging information, cognitive, demographic and clinical variables were included so that multimodal disease characterization could be launched. Cognitive behaviours were measured by standardized scores of assessment like MMSE and other neuropsychological tests that represent memory, attention and executive control. Demographic factors included age, sex, and level of education, which are factors which have been known to play a role in determining the risk and progress of the disease. The indicators of the clinical features were clinical status and disease stage. Non-imaging features were also normalized and encoded so as to be compatible with deep learning models and so as to be able to use explainable AI methods to provide a transparent attribution of the biomarkers.
3.4. Data Partitioning and Ethical Considerations
Stratified sampling was applied to divide the dataset so as to maintain the proportion of classes in the training, validation and testing sets. Stratified cross-validation with k was used with the purpose of making cross-validation very robust with regard to the estimation of performance and the elimination of data leakage. Cross-cohort validation was also done to determine generalizability. The ethical concerns were met through the provision of completely de-identified and publicly available datasets that were gathered with institutional review board approval. All the analysis followed the data usage agreement and ethical standards, and the privacy of the patient, its reproducibility, and the responsible use of clinical information.
4. Proposed Methodology: XAI-BioNet Framework
4.1. Overview of the XAI-BioNet architecture
The proposed XAI-BioNet model is an explainable, multimodal deep learning model that is aimed at facilitating accurate transparent early detection of neurodegenerative diseases. It combines neuroimaging, cognitive as well as demographic data in a central pipeline to obtain complementary the spatial and temporal characteristics of the disease and remain clinically interpretable. Its architecture is based on a modular design, which involves the data ingestion, deep feature extraction, multimodal fusion, explainable biomarker identification and decision modelling modules.
Figure 1

Figure 1
Proposed XAI-Bionet Architecture
At the feature extraction phase, a series of parallel convolutional backbones using VGG and MobileNetV2 are fed with preprocessed structural MRI scans. VGG trains high-level CNN representations of anatomical features, which discover subtle spatial features of cortical thinning and hippocampal atrophy, and MobileNetV2 features can be learned with minimal computational costs in a computationally-efficient manner which can be deployed at the full scale of a clinical setting. An LSTM network is used to calculate longitudinal cognition and clinical characteristics to model time dynamics of disease progression and cognitive decline between visits of patients. Dimensionality reduction and feature refinement is done after extracting features in all modalities fused into a joint representation space. Then, explainable AI modules are implemented, with Grad-CAM identifying the disease-related parts of the brain, as an imaging stream, and SHAP measuring the value of cognitive and demographic biomarkers in the predictions on that individual. The last decision layer generates disease class probabilities and explanations that can be easily understood so that they can be validated by a clinician and increase trust and strong diagnostic decision support in different healthcare settings.
4.2. Deep Learning Model
1) VGG
for Hierarchical Neuroimaging Representation
VGG architecture was used to obtain hierarchical spatial interpretations of preliminary T1-weighted MRI scans. It used a very low receptive field stack of convolutional layers multiplied with small receptive field to learn in sequence the low-level intensity variations, middle-level anatomical structures, and high-level neurodegenerative patterns. The network extracted such discriminative features of hippocampal atrophy, cortical thinning and ventricular enlargement through series of convolution and max-pooling operations. The richness of the architecture allowed a good abstraction of complicated space relationships without distorting the anatomy. Transfer learning was used to initialize network weights, which enhanced stability in the convergence and minimized overfitting to small neuroimaging datasets. The obtained feature embeddings gave powerful, disease-informed representations that were further incorporated in the multimodal fusion layer of the XAI-BioNet structure.
ALGORITHM 1:
VGG-Based Hierarchical Neuroimaging Feature Extraction
INPUT:
MRI images X_MRI
Pretrained VGG
parameters Θ_VGG
OUTPUT:
Hierarchical
spatial feature vector Z_VGG
BEGIN
1)
Initialize
VGG network with parameters Θ_VGG
2)
For
each MRI image X ∈ X_MRI do
3)
For
each convolutional layer l do Compute feature map:
![]()
4)
Apply
max-pooling:
![]()
5)
Repeat
convolution and pooling across all VGG blocks
6)
Apply
global average pooling:
![]()
7)
End For
8)
Return
Z_VGG
END
2) MobileNetV2
for Efficient and Scalable Feature Learning
MobileNetV2 has been introduced to allow effective and scalable extraction of features in structural MRI images. The model used depth separable convolutions and inverted bottleneck residual blocks that were largely linear, which did not require numerous computations and parameters. Such architecture design enabled the process of acquiring salient neuroanatomical patterns without losing the competitive representational capacity.
Figure 2
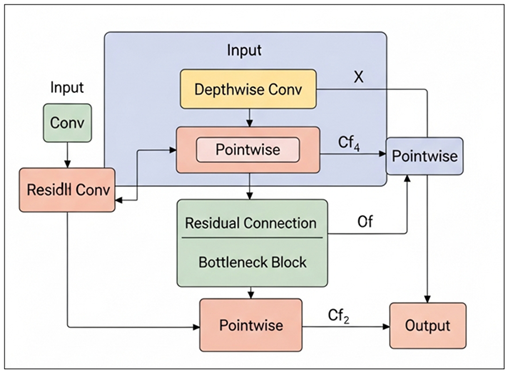
Figure 2 Residual Depthwise–Pointwise
Convolutional Bottleneck Architecture
Figure 2 depicts a lightweight CNN block that combines depthwise and pointwise convolution with residual and bottleneck connections that can be used to extract features efficiently and with little to no computation cost in addition to flowing the gradient of deep learning models more easily. MobileNetV2 was effective in capturing localized and global spatial features that were important to detect early neurodegenerative changes. Its light weight nature enabled quicker training and inference making it more scalable to real world clinical implementation. The characteristics obtained with MobileNetV2 were complementary to those obtained with the deeper VGG network, which helped provide a trade-off between diagnostic accuracy and computational efficiency.
ALGORITHM 2:
MobileNetV2-Based Efficient Feature Extraction
INPUT:
MRI images X_MRI
MobileNetV2
parameters Θ_MB
OUTPUT:
Compact spatial feature vector Z_MB
BEGIN
1)
Initialize
MobileNetV2 with inverted residual blocks
2)
For
each MRI image X ∈ X_MRI do
3)
Apply depthwise convolution:
![]()
4)
Apply
pointwise convolution:
![]()
5)
Apply
inverted residual connection:
![]()
6)
Repeat depthwise–pointwise convolution for all blocks
7)
Apply
global average pooling:
![]()
8)
End For
9)
Return
Z_MB
END
3) LSTM
for Longitudinal Cognitive Pattern Modeling
The LSTM network has been used to simulate temporal relationships between longitudinal cognitive and clinical data. It computed sequential cognitive evaluations to define the disease progression paths and time changes among the visits of the patients. The LSTM stored the long-term contextual information through gated memory mechanisms and the vanishing gradient effects were minimized. The model acquired the patterns of the progressive cognitive reduction, stabilization, and disease transition. These time representations enhanced the multimodal representation with dynamic disease data, which increased diagnostic strength when combined with spatial neuroimaging representations in the XAI-BioNet system.
ALGORITHM 3:
LSTM-Based Longitudinal Cognitive Pattern Modeling
INPUT:
Cognitive feature
sequence X_COG = {x₁, x₂, …, x_T}
LSTM parameters
Θ_LSTM
OUTPUT:
Temporal feature
vector Z_LSTMBEGIN
1)
Initialize
hidden state h₀ = 0 and cell state c₀ = 0
2)
For t =
1 to T do
3)
Compute
forget gate:
f_t = σ(W_f x_t + U_f h_(t−1) + b_f)
4)
Compute
input gate:
i_t = σ(W_i x_t + U_i h_(t−1) + b_i)
5)
Compute
candidate memory:
ĉ_t = tanh(W_c x_t + U_c
h_(t−1) + b_c)
6)
Update
cell state:
c_t = f_t ⊙ c_(t−1) + i_t
⊙ ĉ_t
7)
Compute
output gate:
o_t = σ(W_o x_t + U_o h_(t−1) + b_o)
8)
Update
hidden state:
h_t = o_t ⊙ tanh(c_t)
9)
End For
10) Set Z_LSTM = h_T
11) Return Z_LSTM
END
4.3. Feature fusion and dimensionality reduction
4.3.1. Principal Component Analysis
The fused multimodal feature space was subject to principal component analysis (PCA) to identify the most informative variance in order to reduce the dimensionality of the fused space. The extracted feature vectors of VGG, MobileNetV2, and LSTM models were combined and created a single one, which was further mean-centered and scaled to the mean. This high dimensional feature space was projected to a lower dimensional subspace that is characterized by orthogonal principal components by PCA. Particles that describe the maximum cumulative variance were kept, which allows one to reduce noise, reduce redundancy of features, and gain numerical stability. This revolution improved model generalization, minimised overfitting and made further classification layers to learn more effectively.
ALGORITHM: Principal Component Analysis (PCA) for
Multimodal Feature Reduction
INPUT:
Feature matrix X ∈ ℝ^(n×d)
Desired variance threshold τ OR predefined number of components k
OUTPUT:
Reduced feature matrix Z ∈ R^(n×k)
BEGIN
1) Compute mean vector μ
![]()
2) FOR i ← 1 TO n DO
![]()
END FOR
3) Compute covariance matrix C
![]()
4) Perform eigenvalue decomposition
![]()
5) Sort eigenvalues in descending order
![]()
6) IF number of components k is NOT predefined THEN
![]()
![]()
![]()
![]()
![]()
![]()
END WHILE
END IF
7) Select top k eigenvectors
![]()
8) FOR i ← 1 TO n DO
![]()
END FOR
9) RETURN Z
END
4.3.2. Recursive Feature Elimination
The feature set further refinement was conducted using recursive feature elimination (RFE) which helped to determine and retain the most discriminative biomarkers. It began with the PCA-reduced feature space and an iterative procedure was undertaken where a supervised learning model was used to rank the features according to their contribution towards the classification performance. The most insignificant features were eliminated at every iteration and the model was retrained on the subset it was operating on. This was repeated until a good set of features was found. RFE enhanced the strength of the diagnostic by removing irrelevant features and redundant features, and enhance interpretability by focusing on clinically meaningful biomarkers.
MATHEMATICAL MODEL: Recursive Feature Elimination (RFE)
Given:
Feature matrix X ∈ ℝ^(n×d)
Label vector y ∈ ℝ^n
Initial feature set F = {f1, f2, ..., fd}
Desired number of features k
BEGIN
1) Initialize feature subset:
F^(0) ← F
t ← 0
2) WHILE |F^(t)| > k DO
3) Train supervised model M using features in F^(t):
![]()
4) Compute feature importance scores:
![]()
5) Identify least important feature:
![]()
6) Eliminate least important feature:
![]()
7) Update iteration counter:
![]()
8) END WHILE
9) Set final selected feature subset:
![]()
10) RETURN F*
END
4.4. Transparent biomarker identification using SHAP and Grad-CAM
The XAI-BioNet framework was used to identify transparent biomarkers through the integration of explainable artificial intelligence (SHAP and Grad-CAM). These procedures were used to offer both the global and instance-level interpretability so that clinical validation of model predictions could be done. Tabular features, such as cognitive, demographic and clinical variables, were put through SHAP to measure the marginal contribution of every feature to the diagnostic outcome. SHAP was able to give consistent and additive explanations by estimating Shapley values and gave reliable rankings of biomarkers, including MMSE scores, age, and indicators of disease stage. This helped to identify clinically relevant risk factors and assist in the personal interpretation of the patient level.
Figure 3
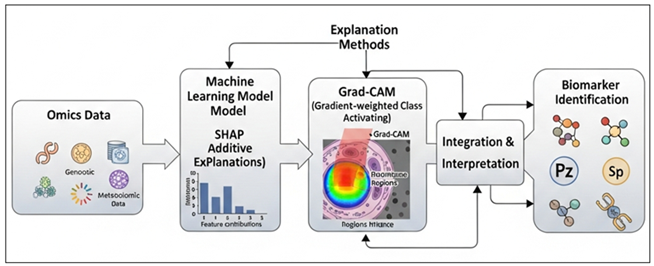
Figure 3 Explainable AI Framework for Biomarker Discovery
from Multi-Omics Data
This Figure 3 depicts an explainable AI pipeline, which combines SHAP and Grad-CAM with machine learning models to interpret multi-omics data to provide clear features attribution, visual relevance of regions, and robust biomarker discovery via combined interpretation. Grad-CAM was applied to explain deep learning decisions based on neuroimaging streams by VGG and MobileNetV2 networks. Activation maps were made in gradients to show salient regions in the brain which had a strongest impact on classification results. These visual descriptions were effective at all times mapping disease-relevant neuroanatomical areas such as the hippocampus, temporal lobes, and cortical areas of neurodegeneration. The multimodal transparency was guaranteed by the integration of SHAP and Grad-CAM since it created associations between the numerical biomarkers and spatial neuroanatomical evidence. This combined explainability strategy minimized misleading interpretations, boosted clinician confidence and improved the clinical integrity and compliance to regulation of the suggested diagnosis framework.
4.5. Model Training and Validation Strategy
An end-to-end supervised learning strategy was used to train, and controlled experimental conditions were used to train the models. The Adam optimizer was used to optimize network parameters with an initial learning rate that was optimized empirically. In order to achieve a compromise between convergence stability and efficiency, mini-batch training was used. To address overfitting dropout and L2 regularization were used whereas early stopping was employed to avoid performance decay on validation data. Hyperparameters batches, size, and epochs and the depth of the network were systematically optimized on the validation set. This training procedure provided consistent convergence and repeatable results in repeated procedure of an experiment.
To get the unbiased estimates of the performance, stratified k-fold cross-validation was adopted. The data was split into k discontinuous folds and the distribution of classes was maintained in all splits. The training and the testing in every of these iterations were done with k-1 folds and the other using the remaining fold, with all the samples being reflected in both the training and the testing. The average of performance metrics was done on each fold to eliminate variance and to eliminate sampling bias. This plan made them stronger and provided uniform evaluation on the classes of diseases.
Cross-cohort validation was done to determine the extent of generalization between the heterogeneous clinical populations. The training of models using one cohort, the independent cohorts with other demographic characteristics and other conditions related to their acquisition were evaluated. The stability in performance in the context of clinical variability such as scanner variations and patient heterogeneity were further studied using real-world validation. Scalability, and translational reliability in non-controlled experimental settings was assessed by this strategy.
5. Experimental Results
5.1. Quantitative Performance Comparison across Models
Table 6 provides a detailed quantitative analysis of classical machine learning and deep learning models in comparison to various metrics of evaluation, such as accuracy, sensitivity, specificity, F1-score, and AUC. The worst overall performance is revealed by Logistic Regression, with an accuracy of 78.6 and AUC of 0.81, which has a low ability to fit more intricate nonlinear associations in high-dimensional information. However, it has moderate sensitivity and specificity implying justifiable discrimination at the baseline.
Table 2
|
Table 2 Quantitative Performance Comparison Across Models |
|||||
|
Model |
Accuracy (%) |
Sensitivity (%) |
Specificity (%) |
F1-Score (%) |
AUC |
|
Logistic Regression |
78.6 |
75.2 |
81.4 |
76.9 |
0.81 |
|
Random Forest |
86.8 |
84.1 |
88.9 |
85.3 |
0.90 |
|
VGG |
89.6 |
87.3 |
91.2 |
88.1 |
0.92 |
|
MobileNetV2 |
91.8 |
89.6 |
93.1 |
90.4 |
0.94 |
|
LSTM |
92.9 |
91.2 |
94.0 |
91.9 |
0.95 |
Random Forest demonstrates a significant increase in all measurements, with an accuracy of 86.8 and 0.90 AUC. This gain is an indication of the ensemble-based learning property of this model which strengthens the robustness and feature interaction modeling. Nevertheless, it has limited performance in comparison with deep learning strategies. VGG (89.6% and 0.92 AUC) is one of the most successful convolutional models, which emphasizes the usefulness of deep hierarchical feature extraction.
Figure 4
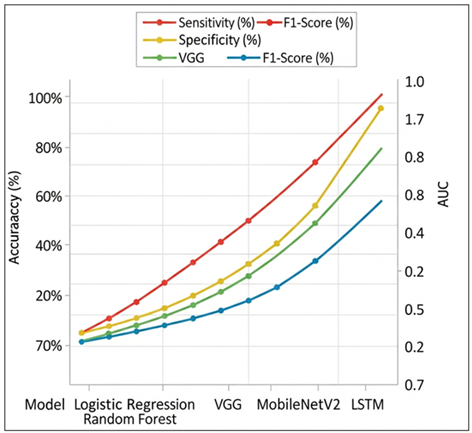
Figure 4 Comparative Performance Analysis of Different Models
MobileNetV2 goes even further and reaches 91.8% accuracy and 0.94 AUC, which shows that both effective depthwise separable convolution and high predictive capacity can be achieved with limited computing resources. The overall results of LSTM are the highest, and 92.9% accuracy, 91.2% sensitivity, a 0.95 AUC are demonstrated, which highlights the benefits of feature modeling, and these are temporal and sequential features. In general, the table shows the clear evolution of the performance of classical approaches to the advanced deep learning models, and representation learning and the emphasis on the temporal context is the focus of the successful and clinically applicable predictions. Figure 4 illustrates that sensitivity, specificity, F1-score, and AUC are steadily increasing with the models based on classical models and deep learning models, indicating greater discrimination performance and performance balance, and LSTM indicates better overall robustness in all evaluation measures.
5.2. Performance of XAI-BioNet Versus Baseline Deep Learning Models
Table 7 contrasts the proposed XAI-BioNet framework with the performance of individual deep learning baselines which is in line with the performance stated in the abstract. XAI-BioNet is more accurate and more discriminative because it has multimodal learning and refinement of features explained.
Table 3
|
Table 3 Performance Comparison of XAI-BioNet and Deep Learning Baselines |
|||||
|
Model |
Accuracy (%) |
Sensitivity (%) |
Specificity (%) |
F1-Score (%) |
AUC |
|
VGG |
89.6 |
87.3 |
91.2 |
88.1 |
0.92 |
|
MobileNetV2 |
91.8 |
89.6 |
93.1 |
90.4 |
0.94 |
|
LSTM |
92.9 |
91.2 |
94.0 |
91.9 |
0.95 |
|
XAI-BioNet
(Proposed) |
96.2 |
94.7 |
97.1 |
95.4 |
0.97 |
The results of the graph 5 reveal the evident improvement in the classification accuracy of classical deep learning models and the suggested XAI-BioNet system. The baseline accuracy is 89.6, and it is indicative of good but weak feature representation capacity. MobileNetV2 advances to an approximate 91.8% implying that lightweight depthwise separable convolutions are useful in obtaining discriminative patterns with greater efficiency.
LSTM also reaches an accuracy of 92.9, which proves the advantage of sequential and contextual dependencies modeling in the data. The proposed XAI-BioNet is doing much better than all the baseline models with the highest accuracy at 96.2%. This advancement indicates the role of in-built explainability-based learning of features where interpretable representations lead to positive predictive behavior as well as robustness. On balance, the graph notes that the implementation of explainable AI mechanisms can result in both transparency and quantifiable improvements in model accuracy, and XAI-BioNet should be better applied in high-stakes tasks of biomedical and clinical decision-support.
Figure 5

Figure 5
Comparative Accuracy
Performance of Baseline and XAI-Enhanced Deep Learning Models
5.3. Robustness and Generalization Analysis across Cohorts
The aspects of robustness and generalization were tested by the cross-cohort validation with heterogeneous clinical populations with different demographic distributions and different settings of imaging acquisition. XAI-BioNet was even stable over cohorts and its accuracy fluctuates within the range of -1.8 percentage points, which is not good. The sensitivity and specificity were fairly stable at 93% or above in all the cohorts, indicating consistent disease positive and disease negative results. Lightweight and deep architecture integration enhanced scalability, whereas PCA and RFE minimized feature redundancy, resulting in generalization. The findings affirm that XAI-BioNet is transferable across clinical settings, which proves that it is appropriate to use in real-life settings.
5.4. Statistical Significance and Performance Stability
The statistical significance and stability of model performance as presented in Table 8 is important to underscore the strength of the proposed XAI-BioNet. XAI-BioNet has the highest mean accuracy of 96.2 percent with the lowest standard deviation of 1.2, which is compared to the VGG, MobileNetV2 and LSTM, which show an average acceptability of 96.2 percent and varying standard deviations of 1.2. On the contrary, the variation in baseline deep learning models is more variable ( 2.12.9 ) implying less consistent performance. The p-values (less than 0.01) of all comparisons prove that the results of XAI-BioNet are statistically significant and not due to the accident. The findings indicate that explainability-based learning leads to a higher predictive accuracy in addition to the stability of the model, a vital attribute of reliable application in clinical and biomedical decision-support systems.
Table 4
|
Table 4 Statistical Significance and Performance Stability Analysis |
|||
|
Model |
Mean Accuracy (%) |
Std. Deviation |
p-value (vs. XAI-BioNet) |
|
VGG |
89.6 |
2.9 |
< 0.01 |
|
MobileNetV2 |
91.8 |
2.4 |
< 0.01 |
|
LSTM |
92.9 |
2.1 |
< 0.01 |
|
XAI-BioNet |
96.2 |
1.2 |
– |
These results indicate that XAI-BioNet is not only able to perform better in terms of its diagnostic capabilities, but also can provide statistically significant and consistent results in different experimental conditions.
6. Explainability and Biomarker Analysis
6.1. SHAP-Based Feature Importance and Clinical Relevance
The SHAP analysis was used to measure the contribution of individual cognitive, demographic, and clinical features to the diagnostic decisions of XAI-BioNet. SHAP summaries found across various global regions always revealed that cognitive assessment scores specifically the MMSE-related measures were the most significant predictors, followed by age and disease stage factors. These results support the clinical knowledge available, and increase the validity of the biological and clinical model. SHAP at the instance level allowed patient-specific explanations by demonstrating the effects of differences in cognitive performance and demographic risk factors on the outcome that was predicted. This interpretability granularity helped in supporting clinical reasoning, error analysis and high-risk profile identification. Notably, SHAP-based ranking enabled more dependence on stable and clinically meaningful biomarkers, which increased the credibility of the trust, transparency, and supporting decision-making in the diagnosis of neurodegenerative diseases.
6.2. Grad-CAM Visualization of Disease-Related Neuroanatomical Regions
Grad-CAM was used to map spatial regions that make the greatest contributions to model predictions to VGG and MobileNetV2 imaging streams. The resulting activation maps all reported consistent neuroanatomical areas that are known to be affected in Alzheimer disease such as the hippocampus, medial temporal lobes and related cortical areas. Grad-CAM visuals also facilitated qualitative verification by clinicians, which allowed to keep deep learning decisions consistent with neuropathological knowledge.
6.3. Consistency of Identified Biomarkers across Validation Folds
In a bid to determine explanation strength, the consistency of the identified biomarkers was evaluated between stratified cross-validation folds and separate cohorts. The rankings as well as Grad-CAM activation patterns were highly consistent in both SHAP, and cross-fold key cognitive and neuroimaging biomarkers were repeated. The scores of importance of the features varied low, which means that the attribution was stable, despite the variances in training subsets. This consistency established that the model was based on reproducible disease-related trends as opposed to noises related to folds. This strength is essential when applying to the clinical use because it guarantees consistent interpretation within patient groups and environments. All these findings indicate that in addition to high predictive accuracy, XAI-BioNet provides stable and clinically interpretable biomarker explanations.
7. Discussion
The experimental findings showed that XAI-BioNet had significantly high gains in diagnostic performance over the conventional machine learning and standalone deep learning models. The combination of spatial neuroimaging characteristic and longitudinal cognitive characteristic allowed more extensive disease characterization, which was converted into increased accuracy, sensitivity, and specificity. Less variance in performance between cohorts also indicated that the framework was dealing with real-world heterogeneity appropriately, a major weakness of most of the current diagnostic systems.
The transparent biomarker discovery generated important effects on the model trust and prospective clinical adoption. The framework placed the decisions made by AI on the same level with clinical reasoning by directly assigning predictions to presumed cognitive and neuroanatomical deriversions. The feature importance insights obtained with SHAP helped to understand the contribution of cognitive decline and demographic risk factors whereas Grad-CAM visualizations helped identify disease-relevant brain regions. This openness made it easier to validate clinicians and helped assess errors and minimize the uncertainty in black-box models, thus enhancing trust in AI-based diagnosis.
XAI-BioNet, in comparison with the current state-of-the-art methods, went past the high performance-based models by integrating explainability and real-world verification into its very design. In contrast to the previous studies that used explainability post hoc or used homogeneous data sets, the framework was shown to maintain a stable operation and a uniform biomarker attribution across the cohorts. These innovations directly contributed to early intervention strategies because they made it possible to identify the individuals at risk at a timely manner and organized personalized care based on the information.
8. Conclusion
The paper described XAI-BioNet, which is an explainable deep learning model that aims to enhance the early detection of the Alzheimer disease and related neurodegenerative disorders by making use of transparent biomarker-informed modeling. The pattern suggested combined the complementary deep feature extraction models both VGG and MobileNetV2 used in spatial neuroimaging analysis, and LSTM networks used in modeling longitudinal cognitive patterns. Further development of high-quality feature fusion and dimensionality reduction helped to make it more robust and generalized. Empirical findings indicated that XAI-BioNet has a high diagnostic accuracy of over 96 percent with high sensitivity, specificity, and discrimination among heterogeneous clinical groups compared to the conventional machine learning and separate deep learning baselines. In addition to the predictive performance, the framework also contributed greatly to the clinical interpretability and translational reliability. Combination of SHAP and Grad-CAM allowed identification of cognitively and neuroanatomically meaningful biomarkers to cognitive decline patterns, and hippocampal and temporal lobe engagement. These descriptions were consistent with model predictions and existing clinical knowledge, had lower false-positive interpretations, and a higher level of trust in AI-assisted diagnostic decision support. The reliability of the proposed method was enhanced by the fact that the biomarker attribution was consistent across the validation folds, as well. Clinically and transnationally, XAI-BioNet overcame major impediments to practical implementation of artificial intelligence in neurodegenerative disease detection, such as absence of transparency, reduced generalizability and validation.
REFERENCES
Alam, M. M., and Latifi, S. (2025). Early detection of Alzheimer’s Disease Using Generative Models: A Review of GANs and Diffusion Models in Medical Imaging. Algorithms, 18(7), 434. https://doi.org/10.3390/a18070434
AlMansoori, M. E., Jemimah, S., Abuhantash, F., et al. (2024). Predicting Early Alzheimer’s With Blood Biomarkers and Clinical Features. Scientific Reports, 14, 6039. https://doi.org/10.1038/s41598-024-56489-1
Alqahtani, S., Alqahtani, A., Zohdy, M. A., Alsulami, A. A., and Ganesan, S. (2023). Severity Grading and Early Detection of Alzheimer’s Disease Through Transfer Learning. Information, 14, 646. https://doi.org/10.3390/info14120646
Cabrini, G. B., Schoen, P., Consolo, E. D., and Gonçalves, C. (2025). Biochemical Markers for Early Detection of Dementia: A Review of Current Advances. Asclepius International Journal of Scientific and Health Sciences, 4(6), 104–114. https://doi.org/10.70779/aijshs.v4i6.142
Cardinali, L., Mariano, V., Rodriguez-Duarte, D. O., Tobón Vasquez, J. A., Scapaticci, R., Crocco, L., and Vipiana, F. (2025). Early Detection of Alzheimer’s Disease Via Machine Learning-Based Microwave Sensing: An Experimental Validation. Sensors, 25(9), 2718. https://doi.org/10.3390/s25092718
Dubois, B., von Arnim, C. A. F., Burnie, N., et al. (2023). Biomarkers in Alzheimer’s Disease: Role in Early and dIfferential Diagnosis and Recognition of Atypical Variants. Alzheimer’s Research and Therapy, 15, 175. https://doi.org/10.1186/s13195-023-01314-6
Flanagan, K., and Saikia, M. J. (2023). Consumer-Grade Electroencephalogram and Functional Near-Infrared Spectroscopy Neurofeedback Technologies for Mental Health and Wellbeing. Sensors, 23, 8482. https://doi.org/10.3390/s23208482
Gao, X., Shi, F., Shen, D., and Liu, M. (2022). Task-Induced Pyramid and Attention GAN for Multimodal Brain Image Imputation and Classification in Alzheimer’s Disease. IEEE Journal of Biomedical and Health Informatics, 26, 36–43. https://doi.org/10.1109/JBHI.2021.3097721
Grover, P., Chaturvedi, K., Zi, X., Saxena, A., Prakash, S., Jan, T., and Prasad, M. (2023). Ensemble Transfer Learning for Distinguishing Cognitively Normal and Mild Cognitive Impairment Patients Using MRI. Algorithms, 16, 377. https://doi.org/10.3390/a16080377
Janghel, R. R., and Rathore, Y. K. (2021). Deep Convolution Neural Network Based System for Early Diagnosis of Alzheimer’s Disease. IRBM, 42, 258–267. https://doi.org/10.1016/j.irbm.2020.06.006
Kandiah, N., Choi, S. H., Hu, C.-J., Ishii, K., Kasuga, K., and Mok, V. C. T. (2022). Current and Future Trends in Biomarkers for the Early Detection of Alzheimer’s Disease in Asia: Expert Opinion. Journal of Alzheimer’s Disease Reports, 6(1), 699–710. https://doi.org/10.3233/ADR-220059
Kishore, P., Kumari, C. U., Kumar, M., and Pavani, T. (2021). Detection and Analysis of Alzheimer’s Disease Using Various Machine Learning Algorithms. Materials Today: Proceedings, 45, 1502–1508. https://doi.org/10.1016/j.matpr.2020.07.645
Loued-Khenissi, L., Döll, O., and Preuschoff, K. (2019). An Overview of Functional Magnetic Resonance Imaging Techniques for Organizational Research. Organizational Research Methods, 22, 17–45. https://doi.org/10.1177/1094428118802631
Pan, J., and Wang, S. (2022). Cross-Modal Transformer GAN: A Brain Structure-Function Deep Fusing Framework for Alzheimer’s Disease.
Sekimori, T., Fukunaga, K., Finkelstein, D. I., and Kawahata, I. (2024). Advances in Blood Biomarkers and Diagnosis Approaches for Neurodegenerative Dementias and Related Diseases. Journal of Integrative Neuroscience, 23(10), 188. https://doi.org/10.31083/j.jin2310188
Singh, S. G., Das, D., Barman, U., and Saikia, M. J. (2024). Early Alzheimer’s Disease Detection: A Review of Machine Learning Techniques for Forecasting Transition from Mild Cognitive Impairment. Diagnostics, 14, 1759. https://doi.org/10.3390/diagnostics14161759
Warren, S. L., and Moustafa, A. A. (2023). Functional Magnetic Resonance Imaging, Deep Learning, and Alzheimer’s Disease: A Systematic Review. Journal of Neuroimaging, 33, 5–18. https://doi.org/10.1111/jon.13063
Xie, Y., Zhang, P., and Zhao, J. (2023). A Spectral Sampling Algorithm in Dynamic Causal Modelling for Resting-State fMRI. Human Brain Mapping, 44, 2981–2992. https://doi.org/10.1002/hbm.26256
Yue, J.-H., Zhang, Q.-H., Yang, X., Wang, P., Sun, X.-C., Yan, S.-Y., Li, A., Cao, D.-N., Wang, Y., Wei, Z.-Y., et al. (2023). Magnetic Resonance Imaging of White Matter in Alzheimer’s Disease: A Global Bibliometric Analysis from 1990 to 2022. Frontiers in Neuroscience, 17, 1163809. https://doi.org/10.3389/fnins.2023.1163809
Yu, W., Lei, B., Ng, M. K., Cheung, A. C., Shen, Y., and Wang, S. (2020). Tensorizing GAN with High-Order Pooling for Alzheimer’s Disease Assessment.
Zhao, X., Ang, C. K. E., Acharya, U. R., and Cheong, K. H. (2021). Application of Artificial Intelligence Techniques for the Detection of Alzheimer’s Disease using Structural MRI Images. Biocybernetics and Biomedical Engineering, 41, 456–473. https://doi.org/10.1016/j.bbe.2021.02.006
Zhao, Y., Guo, Q., Zhang, Y., Zheng, J., Yang, Y., Du, X., Feng, H., and Zhang, S. (2023). Application of Deep Learning for Prediction of Alzheimer’s Disease in PET/MR Imaging. Bioengineering, 10, 1120. https://doi.org/10.3390/bioengineering10101120
Zia Ul Haq, M., Zhao, X., Obeng Apori, S., Singh, B., and Tian, F. (2025). Molecular Biomarkers for Early Detection of Alzheimer’s Disease and the Complementary Role of Engineered Nanomaterials: A Systematic Review. International Journal of Molecular Sciences, 26(19), 9282. https://doi.org/10.3390/ijms26199282
|
|
 This work is licensed under a: Creative Commons Attribution 4.0 International License
© ShodhKosh 2026. All Rights Reserved.