ShodhKosh: Journal of Visual and Performing ArtsISSN (Online): 2582-7472
|
|
Digital Darbars: Spectacle, Stagecraft, and Viral Falsehoods in Rajasthan’s Electoral Campaigns
Priyanka Maheshwari
1![]() , Dr. Amit Verma 2
, Dr. Amit Verma 2 ![]()
![]() ,
Dr. Sana Absar 3
,
Dr. Sana Absar 3![]() , Dr.
Preeti Singh 4
, Dr.
Preeti Singh 4![]() , Dr.
Rajiv Pratap Singh 5
, Dr.
Rajiv Pratap Singh 5![]()
![]() ,
,
Dr. Shriprakash Pal 6![]()
![]() , Dr.
Chanchal Sachdeva Suri 7
, Dr.
Chanchal Sachdeva Suri 7![]()
![]()
1 Research
Scholar, Department of Media, Communication and Fine Arts, Manipal University
Jaipur, India
2 Associate Professor, Journalism and Mass Communication, Centre for
Distance and Online Education, Manipal University Jaipur, India
3 Assistant
Professor, Department of Mass Communication, Guru Nanak Dev University,
Amritsar, Punjab, India
4 Associate Professor, Amity University, Greater Noida, India
5 Assistant Professor, A.J.K. Mass Communication Research Centre, Jamia
Millia Islamia, New Delhi, India
6 Assistant Professor and Coordinator, Department of Mass Communication
and Journalism, Kargil Campus, University of Ladakh, India
7 Professor, University Institute of Media Studies, Chandigarh
University, India
|
|
|
ABSTRACT |
|
|
The electronic
media has revolutionized electoral campaigning because the campaigning
process can propagate the political narratives at the same speed by using
highly interactive and visual communication methods. Modern-day campaigns are
utilizing more and more of digital stagecraft, multimedia narratives, and
algorithm facilitated amplification to influence voter perception and
mobilize political action. An electoral campaign in the state of Rajasthan
serves as a good example of this change study since the traditional forms of
political performances are being dragged round in the virtual world. In this
paper, the Digital Darbars framework is a model
that explains how a political spectacle, the production of the media and
amplification of social media inter-relate to create viral political
narratives in modern political campaigns. The analysis that examined the
content of the campaign pages of the social media on the most popular
platforms like Facebook, X (Twitter), Instagram, and YouTube. The trends of
digital political communication were analyzed in the measures of quantitative
engagement, content classification and sentiment analysis. Results also
indicate that content associated with spectacle (rally videos and symbolic
imagery and meme-centric narratives) will have a far more significant
engagement than policy-focused messages do. The interaction dynamic with a
growing importance of multimedia narrative is observed in visual medium to
date in the political campaign. The misinformation is also demonstrated in
the analysis to contribute to digital campaign ecosystems. It is easier to
convert the media information and viral political memes and reach more people
as opposed to the verified campaign messages, which will create more
polarization of the audience. As the campaign events go through the Digital
Darbar Ecosystem Model suggested, they are converted into viral narratives as
they go through the media capture, platform amplification and audience
interpretation stages. These findings imply that effective mitigation
techniques of misinformation, effective platform regulation, and effective
digital literacy ought to be adopted to secure democratic communication. |
|||
|
Received 10 December 2025 Accepted 16 March 2026 Published 27 March 2026 Corresponding Author Dr. Sana Absar,
sana.mass@gndu.ac.in DOI 10.29121/shodhkosh.v7.i2s.2026.7256 Funding: This research
received no specific grant from any funding agency in the public, commercial,
or not-for-profit sectors. Copyright: © 2026 The
Author(s). This work is licensed under a Creative Commons
Attribution 4.0 International License. With the
license CC-BY, authors retain the copyright, allowing anyone to download,
reuse, re-print, modify, distribute, and/or copy their contribution. The work
must be properly attributed to its author.
|
|||
|
Keywords: Digital Political Communication, Electoral
Campaigns, Social Media Engagement, Digital Darbars,
Political Spectacle, Viral Misinformation, Algorithmic Amplification,
Audience Polarization, Online Political Narratives, Election Communication
Analytics |
|||


1. INTRODUCTION
In India, internet penetration, mobile technology and social media sites have greatly distorted the manner in which political discourses are shaped, being spread and being ingested by voters. The electoral campaigns in Rajasthan exemplify a vivid example of such a change in which political rallies, speeches, and symbolic performances have not been confined to the physical meetings but are planned and executed strategically and enhanced using the digital media ecosystems Sernani et al. (2025). This effect can be theorized as Digital Darbars, which are the traditional types of political spectacle that are intertwined with modern technologies of digital communications. Digital Darbar, is an aspect of the meeting of the past political traditions with the new media practices. Traditionally, rulers used the royal courts or darbars as the arena where they could exhibit their power and govern the people König (2020). The modern politics campaigns can be compared to similar performative arrangements, whereas digital technologies expand the scope of such performances to enormous distances. Campaign events, restructured into a form of viral content through livestreams, edited video clips, memes, and other short-form content, can then change the perception of the masses in widespread fashion Grover et al. (2019).
Figure 1
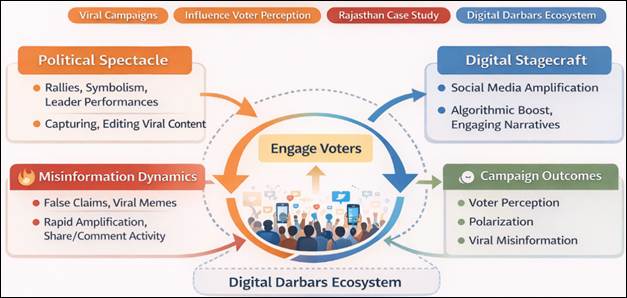
Figure 1 Digital Political Communication and Viral Narrative
Dynamics
Although digital platforms allow a broader audience to be involved in democracy and engage politically in real-time, they also provide conditions that allow the spread of misinformation and viral fictions. Viral content travels quickly through networks and most of the times, out of context. It is important to understand the processes that drive such digital political spectacles so as to assess their role in the democratic procedures as shown in Figure 1. The study is an analysis of the interaction of spectacle, stagecraft and misinformation in the electoral campaigns in Rajasthan. Through social data analysis and campaign message messaging strategies and the circulation of viral content, the study will help create an insight into the nature of the political communication that is becoming increasingly digitally mediated in the electoral environments. The results can be used in the bigger argument about the concept of digital democracy, media manipulation, and the effect of technology on the development of modern political rhetoric Finn et al. (2024).
2. Background and Related Work
This interaction of digital media and political communication has become one of the primary interdisciplinary topics of study especially as the electoral campaigns have turned to online sources to mobilize voters and to influence public opinion. Researchers studying digital political communication have pointed at the fact that social media sites alter the old-fashioned campaign approaches by allowing political participants and voters to interact directly Puggioni (2024). Social media, like Facebook, X (previously Twitter), Instagram, and YouTube make it easy to circulate content about political campaigns quickly, and the campaigns avoid the traditional media gatekeepers of the old media. A study of political spectacle and media performance is a significant theoretical basis of the contemporary campaign strategies. Symbolic gestures, dramatic stories, and well-orchestrated events are commonly used by the political leaders to develop the focus of the population and strengthen the images of leaders Islam et al. (2024). According to media scholars, these practices are termed as performative politics, in which political communication is more emotionally appealing, identities are represented, and the framing of narratives than is focused on policy-driven discourse only. These performances gain superpower in the digital era with the help of algorithmic distribution systems that privilege visual impressiveness and emotional appeal Vlados (2024). The other important line of research is concerned with misinformation and its effect on democracy Irfan et al. (2024). The research on digital misinformation emphasizes the spread of misleading or false information via social networks as an example of how it can quickly disseminate compared to factual information, and it can become more effective in terms of reach and engagement.
Figure 2
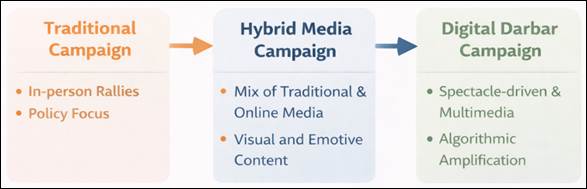
Figure 2 Evolution of Electoral Campaigns
Some of the factors which contribute to this phenomenon are algorithmic amplification, confirmation bias among users and campaigns that aim to disseminate manipulated or fabricated content. Electoral settings are also susceptible to misinformation since politically charged stories used by political actors and their supporters often involve emotional appeals that motivate easy dissemination as shown in Figure 2. In spite of the fact that there is a significant amount of research on national-level digital campaigns, comparatively less research is conducted on regional politics in states like Rajasthan. Local elections are normally characterized by distinctive cultural images, language stories, and localized politics which define the production and interpretation of digital contents. The study of the electoral campaigns in Rajasthan will thus be a chance to find out the ways in which the traditional political symbolism is interacting with the contemporary digital communication infrastructures Campos et al. (2021). The current research is an extension of the current literature as it examines the interaction of spectacle politics, digital stagecraft, and misinformation in a local electoral setting.
3. Conceptual Framework: Digital Darbars and Political Spectacle
The political campaigning nowadays is more of a premeditated performance that is supposed to draw attention and generate an emotional response in the minds of the electorate. In order to develop in this regard, the concept of the Digital Darbars is the concept which allows to realize how the old modes of political power demonstration can be intertwined with the recent digital means of communication Gholap et al. (2025). The model theorizes electoral campaigns as multi-layered communicative spaces in which political spectacle, media spectacle and audience mediation converge to intervene to create viral political narratives. The primary role in the development of political communication is played by spectacle. It is the political rallies, such symbolic gestures, the mention of culture, dramatic visual pictures, which are slated to influence people in an emotionally strong way. These performances are usually inclined to regional background, historical symbols and cultural heritage to generate stories that would gain appeal to some categories of voters. Majority of the campaign efforts in Rajasthan entail conventional outfits, folk songs and local motifs, and help to enhance the idea of genuine culture and local expression Wu et al. (2023). Political campaigns plan the visual environments, speech scripts, and media interactions scrupulously so that the possibility to capture important moments and be able to re-use them in the digital sphere. The camera angles, the light structure, the banners in the background of the audience and the audience choreography contribute to the creation of the visually effective content. Such staged activities that have been captured are then sliced into short media pieces that are shareable and optimized by the social media. These performances transform to interactive systems of communication on the online platforms Fiaz et al. (2024). The viewers do not only observe political affairs and happenings, but also they participate in the recurring of the campaign stories through sharing, commenting and remixing information. Memes, whether it be reaction videos or even parody material, are the ones that extend the existence of political messages and in the process, reform the meaning. In other cases, such participatory environment results in a fast spread of the misinformation as altered or inaccurate information about the campaign turns viral regardless of the sources of such information Micha and Shah (2020). Digital Darbar system, therefore, focuses on the association between the performance of politics, infrastructural setting of digital media and audience engagement. The aggregate analysis of these factors provides a systematic approach to the research regarding the understanding of the possibilities of electoral campaigns in the modern world to form viral politics and influence the fundamental assumptions of the population.
4. Data Sources and Methodology
The current research is based on the mixed-method research design which is a combination of social media data analysis, respective content classification methods, and diffusion analysis through the networks. This method allows studying the processes of the spread of political spectacle and fake information in digital communication systems in a comprehensive manner. The main data will be publicly available content about campaigns which will be gathered on major social media platforms, such as Facebook, X (previously Twitter) and Instagram as well as on YouTube. These are the most effective digital platforms that are used to communicate politically in India especially during election times where the campaigns organizations actively create and disseminate multimedia information. The list of posts will include the posts made by the official political parties accounts, candidate profiles, media companies, and independent digital influencers actively commenting on politics. The target data collection area is a specific campaign period of the state elections in Rajasthan. Relevant posts that contained campaign-related content and had a search query on keywords and hashtags in this regard were located and included in organized data. Each post also had metadata such as timestamps, engagement numbers, and the number of interactions with the user recorded, which can be quantitatively analyzed. The process of content classification was used to sort posts collected based on thematic characteristics. There are official campaign messages, visual spectacle messages, meme-based propaganda, policy-referential messaging, and misinformation messages. The guidelines on annotation were formulated to provide uniformity when using the process to make the classification.
The spread of content within digital communities was assessed using techniques of network analysis. Reposting patterns, mentions and hashtag co-occurrences were used to form interaction networks aimed at defining clusters of coordinated messaging activity. Sentiment analysis tools were also used to assess how people reacted to the contents of the viral campaigns.
5. Digital Campaign Architecture in Rajasthan Elections
The contemporary campaigns of electoral processes are progressively dependent on the sophisticated digital communication systems incorporating the social media control systems, multimedia editing systems, and network-based interaction approaches. The electoral campaigns in Rajasthan explain how political organizations can develop digital campaign structures that can be used to target different audiences using various communication channels. The architectures incorporate coordinated teams that are in charge of content generation, data surveillance, and amplification of online narratives. Campaign entities usually have their own digital media teams that produce multi-media content that is specific to the various platforms. Social media managers, video editors, and graphic designers work together to change political speeches and political events into viral digital content. Videoclips that are short, animated graphics, and images resembling memes are widely used in order to get people to focus on them and share the information with other people online in a fast way. The Influencers and local digital networks make a considerable contribution to the campaign coverage expansion. Political parties often have partnership with regional influencers, local leaders, and online commentators who already have an established market on the social networks. These people are useful in the promotion of campaign stories through reposting of official information and coming up with their own commentary that fit campaign messages. Digital analytics software allows campaign staff to track patterns in interaction with the audience and modify the strategy of message delivery. The number of views, sharing, commentary, and trending hashtags are some of the metrics that allow understanding which stories strike the most with the business online audience. Campaigns may use data-driven decision-making to expand accurate contents and change or substitute messages which do not achieve the desired levels of engagement. Messaging networks are also another significant element of the digital campaign architecture. Members, volunteers, and other related organizations are being involved in a systematic distribution of content that aims at raising awareness of the campaign narratives. Sending messages to groups on applications like WhatsApp and Telegram can also be used as a coordination center where campaign contents are shared to many people in order to share them quickly.
Figure 3
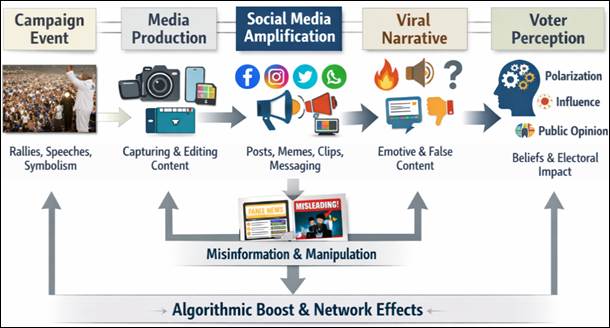
Figure 3 Digital Darbar Campaign Flow Model
Spectacle and stagecraft are critical components of modern day political communication, especially in the electoral arena where the visual effect and emotional appeal are the key factors in how voters perceive the issue. Political campaigns are more and more producing events aimed at generating visual compelling media content with the express purpose of making it available digitally. This change can be attributed to the fact that image-based communication is gaining increasing importance in social media settings where the attention span is short and visually stimulating information has a higher likelihood of reaching a greater degree of engagement. Staging techniques can be elaborate and usually done to make the events more visually appealing especially during campaign rallies and open events. A visual distinctive environment is achieved through the use of large banners with campaign slogans, well-coordinated color schemes and well placed lighting arrangements as shown in Figure 3. Such aspects not only help to strengthen the branding of the campaign but also make sure that tapes of events come across as refined and effective when shared on social media. Sometimes symbolic imagery constitutes an ingredient of political stagecraft. Fans often post videos, photos, and commentaries about campaign events, and this forms long chains of digital engagement. Political performances become viral narratives, which affect the discourse of people, as this accumulation of interactions takes place.
6. Viral Falsehoods and Misinformation Ecosystem
The digital communication platforms offer a lot of opportunities in the field of political messaging like never before, however, they are also places where the spread of misinformation can be fast and can impact the perception of the population. Viral lies could become very pronounced when spreading false or deceptive information becomes very popular in social networks, and in many cases, it lacks any basis to prove its information source. The situation with electoral campaigns is particularly quite susceptible as the competitive nature of politics stimulates the distribution of information among highly engaged audiences as fast as possible. There are a number of misinformation that are common during elections. One of the most widespread examples is manipulated videos when the shots of speeches or rallies are cut in a way that shows the meaning of words or actions differently. By selective clipping, contextual information is deleted so that parts of speeches can be represented in false form. In some instances, all fabricated content can be created with the help of digital editing instruments.
Table 1
|
Table 1 Comparative Engagement of Authentic and Misleading Political Content |
||||||
|
Content Category |
No. of Samples |
Avg. Reach |
Avg. Engagement |
Avg. Share Ratio (%) |
Avg. Comment Polarity
Score |
Avg. Fact-Check Delay
(hrs) |
|
Verified Official
Campaign Posts |
110 |
12,850 |
2,140 |
18.6 |
0.42 |
0 |
|
Edited/Context-Manipulated
Clips |
26 |
18,920 |
2,860 |
24.3 |
-0.18 |
11.5 |
|
Miscaptioned Images |
18 |
15,470 |
2,210 |
21.9 |
-0.11 |
9.3 |
|
Meme-Based False
Claims |
10 |
13,840 |
2,040 |
23.5 |
-0.06 |
14.8 |
|
Fact-Checked
Correction Posts |
22 |
8,260 |
1,120 |
9.7 |
0.15 |
0 |
Misinformation in the form of images also contributes greatly towards viral political narratives. Unrelated photos can be also used to prove the political allegations, and manipulated photos can also increase the sizes of the crowds and can show the artificial scenes which are created to disqualify the opponents. The misinformation of this nature can become viral since pictures are immediate to view and they need the least amount of interpretation. Algorithms amplification is a factor that leads to the spread of false information very fast. The social media sites focus on information that attracts a lot of engagement irrespective of the accuracy of the information. Material that has a high emotional appeal, i.e. anger, outrage, or excitement, is more likely to be shared and in turn become more visible in algorithmically-managed feeds. Online communities also encourage the spread of misinformation using the echo chamber effect. People tend to socialize mostly with people who believe in the same political ideologies, and this will result in an atmosphere of distributing false information with no question. When the misinformation has been integrated into the system of networks, it becomes hard to correct the wrong claims since the information that was being corrected rarely spreads to users as compared to the original viral information.
7. Case Studies of Viral Political Narratives
Case studies represent a solid source of information on the dynamics of creation and development of particular political stories in digital communication spaces. A closer look at separate examples of viral content will enable researchers to explore the processes of how spectacle politics and misinformation interplay during the elections. The case of the elections in Rajasthan provides some interesting examples on how digital narratives affect the discourse of people. One such incident is the case of a campaign rally where a candidate was giving a speech highlighting an initiative of regional development. Shortly following the occasion, a small video clip of a dramatic point of the speech went viral on the social media. The video was cut in such a way that it highlights a section of the speech that is confrontational, and thus the audience can perceive the message as an outright attack on the opposing political groups. Thousands of shares were obtained in hours and the video elicited mass debate among online communities.
Table 2
|
Table 2 Sentiment Distribution Across Major Campaign Narrative Types |
||||
|
Narrative Type |
Positive Comments (%) |
Neutral Comments (%) |
Negative Comments (%) |
Polarization Index |
|
Development-Oriented
Narrative |
48.2 |
27.6 |
24.2 |
0.24 |
|
Identity/Cultural
Symbolism |
55.8 |
18.9 |
25.3 |
0.31 |
|
Leader Image Branding |
51.4 |
21.7 |
26.9 |
0.29 |
|
Attack Campaign
Narrative |
22.6 |
19.4 |
58 |
0.53 |
|
Viral Falsehood
Narrative |
28.1 |
16.5 |
55.4 |
0.49 |
There is an instance where it went viral with a falsified picture purporting to depict enormous crowd in favor of a given political candidate. The picture showed a huge number of people during a rally but the latter analysis showed that the picture was captured during an unrelated cultural event a few years before. The misleading image made it through messaging groups and social media pages in spite of fact-checking by journalists and independent organizations.
Table 3
|
Table 3 Case Study Comparison of Viral Campaign Incidents |
||||||
|
Case Study ID |
Narrative/Event Type |
Initial Source Type |
Time to Viral Spread (hrs) |
Peak Shares/Reposts |
Fact-Check Issued |
Engagement Drop After
Correction (%) |
|
CS-1 |
Edited rally speech
clip |
Unofficial political
page |
3.2 |
8,420 |
Yes |
21.4 |
|
CS-2 |
Miscaptioned crowd
image |
Influencer account |
4.1 |
6,980 |
Yes |
17.8 |
|
CS-3 |
Meme against
opposition candidate |
Party supporter
network |
2.6 |
9,110 |
No |
0 |
|
CS-4 |
Fake quote card |
Anonymous account |
5.4 |
5,760 |
Yes |
24.6 |
|
CS-5 |
Emotional symbolic
campaign video |
Official campaign
account |
2.1 |
10,340 |
Not applicable |
— |
Another instance is presented in Table 3 that shows how meme culture plays a role in the formation of political narrative. The fans of rival political magazines developed comic memes with pictures that depicted the rival parties in a satirical or exaggerated manner. Though such memes were aimed at entertainment, they supported partisan stories and other political discourse around the campaign. As these case studies show, viral political discourses tend to incorporate the aspects of spectacle, emotional narratives, and digital remix culture. The high spread of such stories may influence the perception of the voters, and shape the media coverage, and increase the political polarization. The analysis of such dynamics can help to understand the changing role of digital media technologies and the electoral processes with democratic characteristics.
8. Data Analysis and Results
The digital campaign data analysis demonstrates that a number of specific trends may be identified in terms of the audience engagement, the content spread, and the misinformation propagation in the environment of the election campaign in Rajasthan. The measures of quantitative engagement show that the visually oriented content such as short video clips and image-based posts always got more interaction rates than the text-only messages. Posts with high visual symbolism, emotive words receive a lot more shares and comments, which should become the focus of the communication strategy based on spectacle.
Table 4
|
Table 4 Platform-Wise Campaign Content Engagement During Election Period |
||||||
|
Platform |
No. of Posts Collected |
Total Views |
Total Likes |
Total Shares/Reposts |
Total Comments |
Avg. Engagement Rate
(%) |
|
Facebook |
185 |
12,45,000 |
1,42,300 |
38,420 |
24,860 |
16.43 |
|
X (Twitter) |
240 |
9,82,500 |
96,420 |
31,280 |
18,950 |
14.94 |
|
Instagram |
160 |
14,86,000 |
1,98,750 |
42,610 |
21,730 |
17.73 |
|
YouTube |
95 |
11,28,400 |
1,21,560 |
19,340 |
16,280 |
13.98 |
|
WhatsApp Groups |
120 |
8,64,000 |
— |
28,500 forwards |
9,420 replies |
12.49 |
The analysis of content classification proves that a significant percentage of campaign-related posts was oriented towards the narrative framing, but not towards the discussion of policies. About half of the posts under analysis focused on symbolic gestures, references to the cultural identity, or the images of leaders. These stories especially worked well in creating a sense of audience engagement as they were framed around group sense and emotional appeal as opposed to a complicated policy discussion.
Table 5
|
Table 5 Content-Type Wise Engagement Performance |
||||||
|
Content Type |
No. of Posts |
Avg. Views per Post |
Avg. Likes per Post |
Avg. Shares per Post |
Avg. Comments per Post |
Avg. Virality Score |
|
Rally Spectacle Videos |
88 |
14,850 |
1,720 |
415 |
182 |
8.7 |
|
Meme-Based Propaganda |
74 |
11,420 |
1,390 |
502 |
144 |
8.3 |
|
Leader-Centric Image
Posts |
96 |
10,280 |
1,180 |
294 |
131 |
7.2 |
|
Policy/Manifesto Posts |
67 |
6,940 |
720 |
116 |
88 |
4.9 |
|
Misinformation/Falsehood
Posts |
54 |
16,230 |
1,540 |
648 |
216 |
9.1 |
The network diffusion analysis shows that the content of the viral campaigns is frequently circulated in the closely-knit groups of users, who tend to share and promote the messages, which are consistent with their political beliefs. Central nodes in such networks are often held by influential individuals such as political commentators and regional influencers, who can quickly spread the content to a huge number of people. When a text picks up in such groups, it tends to diffuse to larger groups of people in cross-platform dissemination.
Figure 4
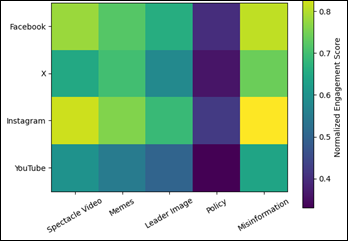
Figure 4 Engagement Intensity Heatmap (Platform vs Content Type)
Other measurable differences in authentic campaign messaging and misinformation narratives are also found in the study. Although official campaign posts are usually written by verified accounts and follow specific communication patterns, the misinformation content can be viewed as the contribution of decentralized sources and disseminated in an unpredictable and uncontrollable way through informal networks as shown in Figure 4. Irrelevant contents are often as engaging as genuine campaign content, despite these structural disparities.
Figure 5

Figure 5 Digital Campaign Influence Radar Profile
The sentiment analysis of the comments left by users can be used to show polarization of reactions toward viral political content. The fans of certain candidates tend to be rabidly supportive of positive storylines and at the same time, criticize opposing perspective as shown in Figure 5. Such polarization is a contributor towards the continuation of false stories since any form of corrective information can be could be relegated or overlooked by tribalized audiences.
9. Discussion: Implications for Democratic Communication
This research demonstrates that there is a complicated correlation between digital media technologies and democratic political communication. Social media platforms may offer a chance to engage in civic activity better and obtain more information on politics, yet they also create a system of structural forces that may distort the discourse of the public. Spectacle-based communication tactics and viral fake news are two closely related events that play an important role in shaping the ways electoral discourse is created and perceived. The role of political spectacle in the voter perception is very strong due to the attention-grabbing qualities of visually stimulating narratives as opposed to discussions on policies. It is through planned activities in campaign teams that produce emotionally-relevant images that can be propagated across digital space. According to such strategies, the leader-based narrative is reinforced, and the focus is made on symbolic gestures that appeal to the sense of cultural identity and shared values.
Figure 6
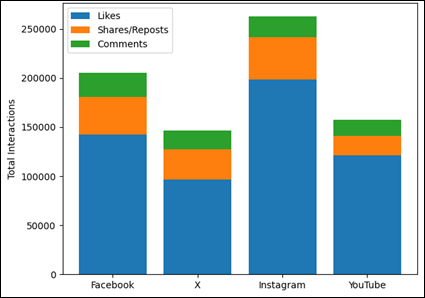
Figure 6 Stacked Engagement Distribution across Platforms
Simultaneously, the information in the digital realm spreads illustrious or distorted information very quickly. The mechanisms which facilitate political communication that is legitimate are frequently used by viral falsehoods, such as algorithmic amplification and sharing on a network. Consequently, the narratives of misinformation can gain equally high visibility as the genuine campaign messages, which makes it difficult to preserve the discourse in the society on an accurate level. The other significant implication is the contribution made by the audience in creating digital political stories. The users of social media actively contribute to the flow and re-interpretation of campaign content by commenting, posting memes, and re-posting as shown in Figure 6. Such participatory dynamic makes politics communication a decentralized process in which meaning is developed in a process of continuous interaction between various actors. These results imply that the enhancement of democratic communication should be a concerted action of policymakers, technology platforms, journalists, and civil society organizations. The introduction of digital literacy and critical assessment of information can assist the audience in seeing through the fake news and mitigating the impact of viral hoaxes. The governance mechanisms of the platform that will restrict algorithm promotion of inaccurate information can also foster a more healthy digital communication atmosphere.
10. Limitations and Future Research Directions
Despite the fact that the present study is insightful in understanding how the nature of digital political communication is influenced in electoral politics in Rajasthan, it has a series of limitations that must be considered. It is the identification of these limitations that are used to elucidate the extent of the results and prospects of future studies. One of the constraints is associated with the access to data. The analysis is based on publicly available social media information on large digital platforms. Nevertheless, there are also some types of political communication that may take place in the context of private messaging, i.e., encrypted messaging groups, where information is difficult to retrieve to conduct a research. It is possible that these covert communication networks are significant in the spreading of political stories and misinformation. The other weakness is the problem of determining misinformation correctly. Although the work of fact-checking organizations and other sources of independent verification can be utilized as an excellent source of reference, it may be challenging to establish the truthfulness of a complicated political statement. There are some stories that are found in the gray informational situations when the interpretation depends on the political orientation and culture. The scope of analysis is also subject to temporal constraints. The data is centered on a specific campaign period of the elections of Rajasthan. The dynamics of political communication can transform with more time lasting depending on the new technologies and changing algorithms of platforms. Further research on the changing aspect of digital campaign strategies can be achieved with longitudinal research officials studying numerous election cycles. The future studies might consider using artificial intelligence to detect unwanted information and classify narratives automatically. The use of machine learning models, which are trained on massive data on political communication, can help a researcher and policymakers to detect new patterns of misinformation faster.
11. Conclusion
In the modern democracies, the digital technologies of communication have drastically changed the character of the electoral campaigning. The Rajasthan elections reveal that the conventional political performances are getting intermittently related to the digital media complexes in order to create highly observable political discourses that are emotionally engaging. The Digital Darbar is a good idea that should be thought of to assist in contemplating the involvement of the political spectacle, media stagecraft, and amplification by algorithms in modern electoral messages industries. The empirical study of the data on the social media campaigns revealed that it has certain meaningful trends. The content with high graphics and spectacle like rally videos and symbolic images were always maintaining high engagement rates as opposed to the policy oriented posts. The social media (particularly Instagram and Facebook) played a great role especially since they were graphical and very sharing formats. The trend of network diffusion also identified that the probable source of the high rate of acquisition of campaign content across platforms was the influential digital accounts and communities clusters. The results also highlight the enormous role of fake news in digital campaigning. Video clip memes, photos with a false caption tied to them, and edited video clips frequently reached a larger audience and became viral as opposed to official campaign messages. On their part, corrective fact-checking information had a difficult time finding such a high profile. These findings suggest that the frames of the algorithmic amplification and emotionally colored messages are the setting where the false narratives propagate rather quickly. The sentiment analysis of the audience revealed that attack related messages and viral fake news reportages had the strongest polarizing effects to the users. These tales might serve to further polarize politics as well as precondition the voter mentality through the implementation of emotional based storytelling rather than through a grounded discussion. The Digital Darbar Ecosystem Model developed in this paper demonstrates how the campaign events live transform into a viral narrative due to a multi-stage process of media production, amplification by the social media, and the interpretation by the audience. These dynamics have played a significant role in improving the systems of democratic communication in the age of the digital era. The creation of the automated system of misinformation recognition, the digital literacy of the voters, as well as the creation of the system of the platform governance that will be able to limit the destructive power of the lies that are propagated by the viruses, yet will not limit the free political speech, may form the basis of the future investigations.
CONFLICT OF INTERESTS
None.
ACKNOWLEDGMENTS
None.
REFERENCES
Campos-Valdés, C., Álvarez-Miranda, E., Morales Quiroga, M., Pereira, J., and Liberona Durán, F. (2021). The Impact of Candidates’ Profile and Campaign Decisions in Electoral Results: A Data Analytics Approach. Mathematics, 9(8), 902. https://doi.org/10.3390/math9080902
Fiaz, F., Sajjad, S. M., Iqbal, Z., Yousaf, M., and Muhammad, Z. (2024). MetaSSI: A Framework for Personal Data Protection, Enhanced Cybersecurity and Privacy in Metaverse Virtual Reality Platforms. Future Internet, 16, 176.
Finn, P., Bell, L. C., Tatum, A., and Leicht, C. V. (2024). Assessing ChatGPT as a Tool for Research on US State and Territory Politics. Political Studies Review. Advance online publication. https://doi.org/10.1177/14789299241268652
Gholap, S., Shinde, H., Nigude, N., and Mali, A.
(2025). Ai-Assisted Creativity:
Balancing Innovation and Authenticity in the Digital
Era. International Journal of Advances in Computer
Engineering and Communication Technology, 14(1),
529–533.
Grover, P., Kar, A., Dwivedi, Y.
K., and Janssen, M. (2019). Polarization
and Acculturation in US Election 2016 Outcomes—Can
Twitter Analytics Predict Changes in Voting Preferences? Technological Forecasting and Social Change, 145, 438–460.
Irfan, M., Ali, S. T., Ijlal, H. S., Muhammad, Z., and Raza, S. (2024). Exploring the Synergistic Effects of Blockchain Integration with IoT and AI for Enhanced Transparency and security in Global Supply Chains. International Journal of Contemporary Issues in Social Sciences, 3, 1326–1338.
Islam, M. B. E., Haseeb, M., Batool, H., Ahtasham, N., and Muhammad, Z. (2024). AI Threats to Politics, Elections, and Democracy: A Blockchain-Based Deepfake Authenticity Verification Framework. Blockchains, 2(4), 458–481. https://doi.org/10.3390/blockchains2040020
König, P. (2020). Why Digital-Era Political Marketing is not the Death Knell for Democracy: On the Importance
of Placing Political Microtargeting in the Context of
Party Competition. Statistics,
Politics and Policy, 11(1), 87–110.
Micha, E., and Shah, N. (2020). Can we Predict
the Election Outcome from Sampled Votes? In Proceedings of the AAAI Conference
on Artificial Intelligence (Vol. 34, 2176–2183).
Puggioni, R. (2024). Coming out as Undocumented: Identity Celebrations and Political Change. Societies, 14, 130.
Sernani, P., Cossiri, A., Di Cosimo, G., and Frontoni, E. (2025). Analyzing Digital Political Campaigning Through Machine Learning: An Exploratory Study for the Italian Campaign for European Union Parliament Election in 2024. Computers, 14(4), 126. https://doi.org/10.3390/computers14040126
Vlados, C. M. (2024). The Current Evolution of International Political
Economy: Exploring the New Theoretical Divide Between New Globalization and
Anti-Globalization. Societies,
14, 135.
Wu, T., He, S., Liu, J., Sun, S., Liu, K., Han, Q. L., and Tang, Y. (2023). A Brief Overview of ChatGPT: The History, Status Quo and Potential Future Development. IEEE/CAA Journal of Automatica Sinica, 10(5), 1122–1136.
|
|
 This work is licensed under a: Creative Commons Attribution 4.0 International License
© ShodhKosh 2026. All Rights Reserved.