ShodhKosh: Journal of Visual and Performing ArtsISSN (Online): 2582-7472
|
|
Managing Contemporary Art Institutions with Predictive Insights
Khushboo 1![]() , Ramu K 2
, Ramu K 2![]()
![]() , M S
Pavithra 3
, M S
Pavithra 3![]() , Sathyabalaji Kannan 4
, Sathyabalaji Kannan 4![]() , Akhilesh Kalia 5
, Akhilesh Kalia 5![]()
![]() ,
Shardul Phansalkar 6
,
Shardul Phansalkar 6![]()
![]()
1 Assistant
Professor, School of Fine Arts and Design, Noida International University,
Noida, Uttar Pradesh, India
2 Department
of Computer Science and Engineering, Aarupadai Veedu Institute of Technology,
Vinayaka Mission’s Research Foundation (DU), Tamil Nadu, India
3 Department of Master of Computer Applications, ATME College of
Engineering, Mysuru-570028, Karnataka, India
4 Department of Engineering, Science and Humanities Vishwakarma
Institute of Technology, Pune, Maharashtra, 411037, India
5 Centre of Research Impact and Outcome, Chitkara University, Rajpura-
140417, Punjab, India
6 Assistant Professor, Department of Product Design, Parul Institute of
Design, Parul University, Vadodara, Gujarat, India
|
|
|
ABSTRACT |
|
|
Modern art
organizations are becoming more and more active in unstable cultural,
economic, and digital conditions that require evidence-based decision making,
not based on intuitions and ex-post reporting. This paper suggests a
predictive analytics system to be used in strategic and operational
management of museums, galleries, and hybrid cultural institutions. Combining
nonhomogeneous data flows visitor attendance and mobility traces, engagement
and ticketing logs, exhibition performance indicator, sales and acquisition
and digital interaction signals of websites, social media, and virtual
exhibitions the framework allows making a forward-looking decision regarding
programming, finance, and resource allocation. The data preprocessing and
harmonization, feature engineering to capture temporal, behavioral, and
contextual dynamics, deployment of machine learning and time-series models to
predict visitor demand, predict engagement, and estimate revenue are all part
of the methodology. Optimization modules convert predictions into actions to
be taken by the staff, exhibition schedule, marketing expenditure and
collection plans. A case study shows how it is applied in the context of a
modern art organization, including the nature of its datasets, deployment of
the model and its connection to managerial processes. Quantitative analysis
demonstrates the better accuracy of the forecasts in terms of attendance and
revenues, the minimization of operational inefficiency, and a more suitable
exhibition planning, whereas qualitative reciprocation demonstrates increased
managerial confidence and decision processing transparency. According to the
results, predictive insights can help to balance artistic vision and
sustainable management by balancing cultural impact and financial viability. |
|||
|
Received 17 September 2025 Accepted 16 August 2025 Published 28 December 2025 Corresponding Author Khushboo,
khushboo@niu.edu.in DOI 10.29121/shodhkosh.v6.i5s.2025.6922 Funding: This research
received no specific grant from any funding agency in the public, commercial,
or not-for-profit sectors. Copyright: © 2025 The
Author(s). This work is licensed under a Creative Commons
Attribution 4.0 International License. With the
license CC-BY, authors retain the copyright, allowing anyone to download,
reuse, re-print, modify, distribute, and/or copy their contribution. The work
must be properly attributed to its author.
|
|||
|
Keywords: Predictive Analytics, Arts Management, Decision
Support Systems, Visitor Demand Forecasting, Cultural Institutions,
Artificial Intelligence |
|||


1. INTRODUCTION
Nowadays the institutions of contemporary art, such as museums, galleries, cultural centers, and physical-digital intermediary spaces, find themselves in a more complex and uncertain environment. The swift changes in the audience behavior, changing funding forms, changing digital interaction forms, and increased social relevancy expectations have changed the way such institutions are run. The classic arts management approaches that are usually based on past trends, curatorial hunch, and ex-post facto reporting can no longer respond to the changing demands of the operation, including fluctuated attendance, inconsistent revenues, resource limitation, and a struggle to command public interest. Consequently, it is increasing in its requirement of futuristic, data-driven management approaches that can aid in sustaining artistic missions as well as the institutional sustainability. Simultaneously with these issues, art institutions of today are producing raw amounts of data never before seen Tennent et al. (2020). Structured institutional data is generated through visitor ticketing systems, membership databases, exhibition sales records, collection acquisition logs, and operational finance systems, and unstructured digital interaction data is generated through websites, social media platforms, mobile applications and virtual exhibitions. The new opportunities introduced by the development of data storage, analytics, and artificial intelligence make it possible to convert these heterogeneous data sources into predictive information which can be used in strategic planning and in daily decision making Verhulst et al. (2021). Nevertheless, these data resources are not well systematized and operationalized by many art institutions because of a lack of analytical capacity, fragmented data ecosystems, and the fear of curatorial autonomy being lost. Predictive analytics provides a strong methodological underpinning of such challenges. Figure 1 illustrates predictive analytics architecture to aid in managing modern day art institutions based on data. With the help of statistical modeling, machine learning, and time-series forecasting, predictive systems would allow institutions to predict future events, like visitor demand, engagement rates, and performance at an exhibition, and financial trends.
Figure 1

Figure 1 Predictive Analytics Architecture for Managing
Contemporary Art Institutions
In contrast to descriptive analytics, which provide an explanation of what has already been, predictive methods are helpful to proactive management because they allow estimating what is probable to happen under various circumstances. In the case of art institutions, this reactive to anticipatory governance change can improve scheduling of exhibitions, staffing and resource distribution, better marketing performance and help support evidence-based acquisition and programming choices. The use of predictive analytics in arts management is not common and is not evenly distributed, though it has the potential to be. Institutional frameworks Existing applications are frequently deployed as isolated functions (e.g. ticket sales forecasting or social media analytics), not as an integrated institutional framework tom Dieck and Jung (2017). Besides, most of the existing literature on analytics and artificial intelligence revolves around commercial creative sectors, e.g., film, music, and digital media, relative to a relative paucity of coverage on non-profit and publicly facing cultural institutions. This paper will fulfill this requirement by suggesting an extensive predictive analytics model to the management of modern-day art institutions Shi et al. (2019). The framework combines multi-source institutional and digital data, predictive models that are interpreted, and links the output of the analytical services directly to managerial decision-support operations.
2. Conceptual Foundations and Related Work
2.1. Management models in museums, galleries, and cultural institutions
Historically, museums, galleries and cultural institutions modeling their management around curatorial leadership, civic service requirements and cultural heritage management, have had significant influence in shaping the museums and galleries. Early institutional models were characterized by custodial and collection based models where the management priorities were based on preservation, scholarship and outreach. The decision making process was mostly centralized, under the leadership of professional curators and administrators, with little emphasis on the audience analytics or performance-based measurements Chang (2021). With the changes in the landscape of public funding and competition over the audiences, there was a slow adoption of managerial and strategic planning practices that was borrowed by many institutions of the non-profit and service sectors. The modern management models are becoming more audience-centric, accountable and sustainable. The museum and galleries have become sophisticated organizations striking a balance between the artistic vision, visitor experience, financial sustainability and social impact. Governance frameworks can be characterized by the combination of the role of a population, individual sponsors, and community involvement and must have transparent and evidence-based decision-making processes Barath et al. (2023). The new concepts of strategic cultural management, frameworks of the experience economy, and value co-creation are in the limelight, and the emphasis is made on visitors as active participants, but not passive consumers. In spite of these developments, the management of cultural institutions is confined with uncertainty in attendance, fluctuation in revenues and inability to foresee change. Most institutions base their activities on the annual reports and retrospective analysis, which do not provide a high degree of assistance in terms of planning ahead Dobbs et al. (2022).
2.2. Predictive analytics and decision-support systems in creative industries
Forecasting systems and decision making systems have found extensive application in business fields of creative industries, including films, music, video games and digital media. Data-based solutions are applied in these industries to predict demand, maximize content release, target marketing campaigns, and control risks in financial sector. Decision-support systems combine past performance data with current behavioral data to produce actionable information that can be used by the producer, distributor and executive. Such systems are usually integrated in a combination of statistical forecasting, machine learning models, and optimization algorithms to assist in strategy and operational decisions Dobbs et al. (2022). In the creative industry, predictive analytics have been shown to have tangible benefits such as accuracy in predicting revenues, less marketing waste, and improved audience targeting. Platform-based creative ecosystems have switched to the center of recommendation system and demand prediction models, as they can be scaled to provide personalization and experiment quickly. Nevertheless, these methods are frequently profit-maximizing in nature and work in highly-data-dense, digitally-native settings. It has opportunities and challenges in translating these models to cultural institutions. Though museums and galleries are not entirely different to the creative industries including content programming, audience responsiveness, and brand positioning, they are essentially different in their mission orientation, management, and ethical issues Leonarduzzi et al. (2018). In cultures, the decision-support systems should be able to find the equilibrium between quantitative efficiency and such qualitative values as cultural diversity, artistic risk-taking, and accessibility to the general population.
2.3. AI, machine learning, and forecasting in arts management
The use of artificial intelligence, machine learning and forecasting as means of innovation in arts management are becoming a popular topic of discussion. Time-series forecasting models have been used to forecast museum attendance, ticket sales and seasonal visitation patterns whereas supervised learning techniques have been applied to estimate the performance of an exhibition, behavior of a donor and retention of a member Łydżba-Kopczyńska and Szwabiński (2022). Clustering and pattern mining are unsupervised approaches that facilitate audience segmentation and discovery of latent profiles of engagement on both the physical and online channels. Modern progress in machine learning has broadened the scope of predictions that are not limited to the traditional numeric data. Sentiment and discourse analysis of the reviews and press coverage and social media engagement is also possible through natural language processing which provides qualitative indicators of the public perception Kim et al. (2021). Computer vision methods have been considered to analyse exhibition layout, popularity of artwork and digitally existing collections, which indirectly takes the form of curatorial and operational decisions. The two methods show how AI is increasingly being utilized in arts organizations as another layer of analysis. Nonetheless, critical issues of application of AI to arts management are also found in the literature. Table 1 is a summary of related literature in the area of data-driven and predictive management in cultural institutions. The application of commercial domains to sparse data, low sampling and high contextual variability are limiting to transfer of models. Issues of algorithmic bias, loss of curatorial discretion and over-quantification of cultural value are other ones that make adoption even more complex.
Table 1
|
Table 1 Summary of Related Work on Data-Driven and Predictive Management in Art and Cultural Institutions |
||||
|
Study Focus |
Institutional Context |
Data Sources |
Analytical / AI Methods |
Decision-Support Scope |
|
Museum attendance
forecasting |
National museums |
Ticketing, calendar data |
ARIMA, regression |
Staffing, scheduling |
|
Visitor segmentation Powell et al. (2021) |
Art galleries |
Surveys, demographics |
k-Means clustering |
Marketing personalization |
|
Cultural analytics framework |
Public cultural institutions |
Attendance, finance |
Descriptive analytics |
Strategic reporting |
|
Social media impact on
visits |
Museums |
Twitter, Instagram |
Sentiment analysis |
Promotion planning |
|
Revenue optimization |
Commercial galleries |
Sales, pricing |
Linear optimization |
Pricing strategy |
|
Exhibition performance
analysis Abramovich and Pensky (2019) |
Contemporary art museums |
Exhibition logs |
Statistical modeling |
Program evaluation |
|
Digital engagement analytics |
Virtual museums |
Web analytics |
Clickstream analysis |
UX improvement |
|
AI in arts management review |
Cultural sector |
Literature corpus |
Systematic review |
Policy insights |
|
Predictive ticket sales Lee et al. (2020) |
Performing arts venues |
Ticket sales history |
Random Forest |
Demand forecasting |
|
Decision dashboards |
Museums |
Integrated MIS data |
BI dashboards |
Operational decisions |
|
Visitor flow modeling |
Large museums |
Sensor, RFID data |
Simulation models |
Crowd management |
|
Cultural value measurement Cecotti (2022) |
Art institutions |
Surveys, expert ratings |
Multi-criteria analysis |
Impact assessment |
|
Predictive analytics for
arts management (This Study) |
Contemporary art
institutions |
Visitor, financial, digital
data |
ML + forecasting +
optimization |
Strategic & operational
management |
3. Data Ecosystem for Contemporary Art Institutions
3.1. Visitor behavior, engagement, and attendance data
The data on visitors is the heart of the analytical ecosystem of the modern art institution, as it offers direct information on the behaviors of viewers and the scope of the institution. Ticket systems provide attendance data that show the patterns of daily, weekly, seasonal visits, peak hours, habitual visits, and reactions to special exhibitions or events. These data along with membership databases and reservation systems make it possible to differentiate visitor segments, including members, tourists, local communities, students, and occasional visitors. In addition to the bare attendance numbers, dwell time, gallery route flows and the extent to which a visitor is involved in guided tours or education programs are more meaningful indicators of engagement. More and more institutions gather behavioral data with the help of digital ticketing, RFID-powered passes, mobile applications, and sensor-based systems. The sources have good temporal and spatial data that can be used to model the dynamics of crowds, use of space, and movement of visitors. The use of survey responses and feedback forms further supplements behavioral data, and they include motivations, the level of satisfaction, and the value perceived. The combination of these quantitative and qualitative indicators enables the institutions to go beyond the simplistic attendance indicators to more thoroughly understand visitor experience. Predictive Visitor behaviors and data on visitor engagement can be used to predict future demand, detect the first indications of waning interest, and determine the effects of external influences on attendance like weather, holidays, and other events taking place at the same time.
3.2. Exhibition performance, sales, and acquisition records
A second layer of institutional data ecosystem is made up of exhibition performance and collection-related data. Exhibition documentation usually contains data about topics, artists, length, curatorial texts, space assignment and related events like workshops or lectures. The proxies that can be measured based on performance indicators, including attendance per exhibition, the average length of stay, merchandise sales, and media coverage, give an idea of the cultural impact and the general engagement of people. These indicators when compiled in a systematic way can be compared across exhibitions and times. Institutional analytics would greatly benefit by adding a financial and sales dimension. In case of galleries and hybrid institutions, revenue forecasting and market position depend on selling of artwork, commissions, pricing policies, and profiles of buyers. Related financial records in museums and non-profit include fundraising results, sponsorship donations and grant distributions associated to particular exhibition or purchase. Long-term collection development strategies and institutional identity are reflected in the acquisition records, which are recorded, reflecting provenance, cost, artist representation, and rationale. Combining the exhibition performance data with sales and acquisition data will contribute to the predictive modeling of financial sustainability and resource use. As an example, the past exhibition attributes may be combined with attendance and revenue performance to forecast the performance of subsequent programs.
3.3. Digital interaction data (web, social media, virtual exhibitions)
The data of digital interaction is taking a more central part of the concept of audience engagement in contemporary art institutions due to the increasing use of online and hybrid experiences. Website analytics track visitor traffic, paths of navigation, content consumption and conversion activities like purchasing of tickets or subscribing to newsletters. These measurements give precursors of interest by people in exhibitions, artists, and programs, and usually before attendance. These are also accompanied by email campaigns and customer relationship management systems that capture response rates, click-through behavior and preferences. Social media create high volume, real time indications of engagement, such as likes, shares, comments, and feeling conveyed in user created content. A study of these interactions allows the institutions to evaluate the popular discourse, campaign success, and the coverage of digital storytelling programs. Social engagement trends tend to represent the changing interests of the audience and can be used to predict attendance trends or gauge the effectiveness of curatorial stories.
4. Predictive Analytics Framework for Institutional Management
4.1. Data preprocessing, integration, and feature engineering
The foundation to predictive analytics effectiveness in the modern art institutions lies in the strong data preprocessing and integration, and feature engineering pipelines. Institutional data are generally not homogenous, and they are sources of ticketing systems, membership databases, financial records, curatorial records, and online platforms. The data sets differ in the structure, time resolution, and quality, which will also require the systematization of cleaning processes, including the management of missing values, outliers, and normalization. It is especially crucial to temporal alignment because the visitor behavior, exhibition performance, and financial indicators tend to work on varying time scales. Data integration will entail the integration of the different data sources into a consistent analytical storage facility and the use of standardized schema and unique ID of visitors, exhibits and periods. Through this, cross-domain analysis can be achieved and data provenance and auditability can be maintained. Patterns of encoding to convert qualitative curatorial and administrative records into structured features can be developed based on encoding strategies, categorical mappings, or natural language processing methods, and contextual and narrative aspects are not lost. The use of feature engineering is important in improving model performance and interpretability. Temporal features preserve a seasonality, trends, and event-based influence whereas behavioral features describe the frequency of visits, intensity of engagement, and the conversion patterns.
4.2. Predictive models for visitor demand and engagement forecasting
Visit and engagement forecasting predictive models are the key to proactive institutional management. Attendance patterns and seasonality modeling are common so-called time-series forecasting models such as autoregressive and state-space forecasting models. These models represent the common temporal patterns and also they can have short term variation due to the outside sources like holidays or weather. Figure 2 presents predictive models in visitor demand and engagement trends.
Figure 2
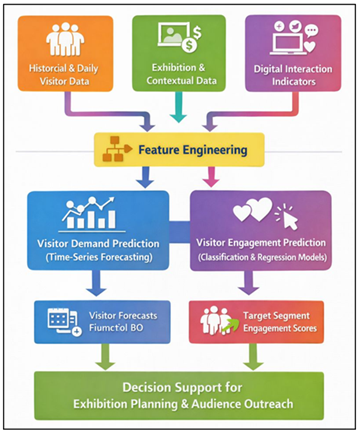
Figure 2 Predictive Models for Visitor Demand and Engagement
Forecasting
The machine learning techniques, such as tree-based ensemble and neural networks, expand predictive abilities with nonlinear dependencies between the behavioral, contextual, and digital interaction features. Engagement forecasting extends beyond the numbers of attendees to predict the ability to stay a bit longer and the potential to revisit as well as to take up programs or digital contents. Segments with high potential of engagement can be determined using classification and regression models and outreach recovery and individualized communication can be applied. Web traffic-based leading indicators and social media-based leading indicators frequently improve the accuracy of the forecast due to the fact that they indicate the developing interest before the visits occur physically. The choice of the model and its appraisal must be balanced between the predictive power and interpretability. Open models help managerial knowledge and scenario-based planning, including estimating attendance using different schedules or marketing options in an exhibition. The quantification of uncertainty, which is used as confidence limits or probabilistic estimates, is especially useful in cultural settings where the variability is great. With visitor demand and engagement forecasting built into the decision-support systems, the institutions will be able to transition their reactionary responses into pre-emptive planning, enhancing visitor experience, managing crowds, and aligning the programs with the expectations of the audience.
4.3. Financial and resource optimization models
The models of financial and resource optimization translate predictive knowledge into management action plans. Budgeting, cash flow planning, and risk assessment are based on the forecasts of revenues based on the data about visitor demand, sales, and sponsorship. Resource allocation through exhibitions, staffing, marketing, and facilities can be carried out efficiently by the use of optimization methods including linear programming and constraint based models, without violating institutional constraints and policy objectives. Optimization models of staffing utilise attendance and engagement projections to match the staff shifts to the expected visitor patterns, minimising overstaffing as well as service bottlenecks. Likewise, exhibition scheduling models are used to harmonize the anticipated demand, curatorial interests, and operational limitations to achieve the greatest cultural engagement as well as financial viability. Predictive models can be used in the planning stage of acquisitions and collections to aid in long-term financial stewardship by assessing the acquisition costs and estimated costs in comparison to anticipated maintenance costs and results of audience engagement. Financial optimization in art institutions should allow qualitative objectives and moral aspects unlike in a purely commercial environment. Objective functions are hence frequently integrated with various aspects, like visitor contentment, reachability, as well as variety, and financial results.
5. Case Study or Experimental Implementation
5.1. Description of institutional context and dataset
The case study is placed in a mid-sized modern art organization that has a physical exhibition space and an active digital interaction platform. The institution accommodates regular exhibitions, educational events, and public events and has a wide range of audience, which includes local visitors, tourists, students, and members. The targets of the organization are to ensure more people visit the place, stabilize the attendance in different seasons, and enhance the financial planning without curatorial interference. The context is a good representative context within which predictive analytics in arts management can be assessed. The data that is to be applied in the experimental implementation is a combination of three years of historical data. Data on visitors will consist of the number of visits per day, the type of ticket purchases, membership level, indicators of frequent visits, and satisfaction scores as a result of surveys. The themes, artists, duration, spatial allocation and the programming associated with an exhibition are recorded in record books and the programs of an exhibition including the attendance per exhibition and the amount of merchandise sold. The financial data will include the ticket income, sponsorships, marketing expenses and the cost of running the organization. The analytics of the web page, emails, and social media interaction measurements are the data that is used to derive digital interaction. All data were anonymized and aggregated in order to maintain the privacy and ethical use. Synchronization was done on a daily, weekly and monthly record between domains on the basis of temporal alignment. The external contextual factors such as holidays and local cultural events were also included. The resulting dataset is a multi-dimensional description of the work of institutions that allows the creation and analysis of predictive models in a realistic managerial setting.
5.2. Model deployment and operational integration
Model implementation aimed at incorporating predictive analytics in current institutional processes and not introducing independent analysis tools. Visitor demand and consumer engagement forecasting models were deployed in a centralized dashboard that can be accessed by both the managerial and operational personnel. The system produced the rolling forecasts at the daily and monthly levels with the uncertainty range and summary of the explanatory features to facilitate interpretability. The focus on operational integration was on the use-ability and integration into decision cycles. Attendance predictions allowed the scheduling of the exhibitions, staffing, and marketing campaigns, whereas the revenue forecasts could be used to revise the budget and to schedule sponsorships. Automated data pipelines guaranteed a consistent model refresh when new data was available and limited the manual input and increased the potential of having old insights. I used scenario analysis modules which enabled managers to test alternative assumptions, including more marketing expenditure or length of exhibitions. Administrative and curatorial teams were also trained as a means of adoption with the focus being placed on the role of analytics as a decision-support tool, but not a prescriptive one. Feedback The feedback mechanisms allowed users to attach contextual information to a forecast to establish a two-way communication between human experience and machine generated insights. Government rules were put in place to determine accountability, data access privileges, and review cycles of the model. Such a combined implementation strategy made sure that predictive analytics were integrated into institutional practice and helped to make informed decisions without interfering with the existing cultural working processes.
5.3. Quantitative and qualitative outcome analysis
The quantitative analysis showed significant gains in such significant institutional performance measures. Demand forecasting showed greater accuracy than baseline historical averages in terms of visitor demand which decreased uncertainty in planning staffing and exhibition operations. The better correlation between what was projected and what was actually attained resulted in more effective use of the resources in the form of lower overtime payment and the ease with which the visitors moved in and out during peak hours. Budgeting using revenue forecasts helped to make better budgets, which helped in managing the cash flow better and lower variance between the budgeted and actual income. The metrics related to engagement were also positive. The use of engagement predictions to set targeted marketing tactics led to a higher rate of conversion of particular groups of visitors and more engagement in learning programmes. Digital interaction data presented better online engagement before physical visits which implied better outreach to the audience and previous anticipation of interest by visitors. Qualitative data, which was gathered by interviewing staff and internal feedback, revealed that there was more confidence in decision making and planning. Managers also said that they had seen an increase in being more open about why the operational decisions were taken to their stakeholders, and curatorial teams appreciated that they could now test situations without undermining artistic purpose. Significantly, the analytics model was also seen as enabling, as opposed to being constraining, which strengthens the confidence in data-driven governance. These quantitative and qualitative results, combined, prove that predictive insights may stimulate performance of an institution without making it lose the cultural mission or professional autonomy that is associated with contemporary art institutions.
6. Result and Discussion
It is shown that the incorporation of predictive analytics in the modern art institution management has real operational and strategic positive outcomes. Forecasting demand of visitors enhanced the ability of planning to make decisions that are more accurate and are better suited to matching the staffing, exhibition schedule and marketing activities with the projected flow of visitors. Budget forecasts minimized budget uncertainty and allowed more informed budgetary allocation to programs, exhibitions. Models based on engagement identified significant trends connecting digital to on-site participation, which underscored the importance of online cues as predictors of the interest of the masses. Managerial wise, predictive insights increased the transparency and confidence in decision making and allowed supporting the evidence-based discussions with the stakeholders. Notably, the result suggests that analytics are most effective as a decision-support system and not a prescriptive one, and it can be used as a supplement to curatorial judgment.
Table 2
|
Table 2 Predictive Model Performance for Visitor Demand and Engagement Forecasting |
|||
|
Metric |
Baseline (Historical
Average) |
Statistical Forecasting
Model |
ML-Based Predictive Model |
|
Attendance Forecast Accuracy
(%) |
72.8 |
84.6 |
91.3 |
|
Mean Absolute Error
(Visitors/Day) |
128.4 |
74.2 |
46.7 |
|
Peak-Day Prediction Accuracy
(%) |
68.1 |
82.9 |
90.6 |
|
Engagement Prediction
Accuracy (%) |
70.4 |
81.7 |
88.9 |
Table 2 shows a comparative analysis of predictive methods to visitor demand and engagement forecasting, with obvious performance improvements with the complexity of the model. The historical average method with the basis of predictive performance is limited as the accuracy of the prediction is 72.8 percent with mean absolute error of 128.4 visitors per day and the forecast of attendance. These findings are indicative of the failure of fixed, past-looking approaches to provide time-varying and context effect. The comparative performance difference among various visitor forecasting models can be found in Figure 3. With statistical forecasting model, there is a significant enhancement in attendance prediction accuracy of 84.6 percent and a decrease in prediction error of 74.2 visitors per day, which implies that model has been effective in capturing seasonality and time trends in attendance forecasting.
Figure 3

Figure 3 Comparative Bar Chart of Forecasting Model
Performance
The ML-based predictive model gives the highest result on all measures. Accuracy of attendance forecast has been improved to 91.3 with mean absolute error decreased to 46.7 visitors per day, which is also a significant increase in the precision of planning. Notably, the accuracy of peak-day predictions is increased to 90.6% and this is a very important issue in that the art institutions are dealing with one of the most operationally demanding problems. Figure 4 indicates comparisons of baseline forecasting model, statistical forecasting model, and machine-learning forecasting model.
Figure 4

Figure 4 Visualization of Baseline vs Statistical vs ML
Forecasting Models
The accuracy of engagement predictions also increases to 88.9% indicating that the model can combine the behavioral and digital interaction characteristics. On the whole, the findings confirm that machine learning models have higher ability to identify nonlinear relationships and leading engagement indicators, which gives management of the institution a more reliable and proactive decision making.
7. Conclusion
This paper discussed how predictive insights can be used to operate modern day art institutions in more dynamic cultural, economic, and digital landscapes. The fusion of ideas in the arts management theory and predictive analytics and artificial intelligence facilitated the development of a thorough framework to combine heterogeneous institutional and digital data into actionable decision-supporting tools, which the research proposed and tested. The results prove how predictive analytics can have a significant beneficial impact on visitor demand forecasting, engagement planning, financial management, and the optimization of resources, helping to overcome the long-standing issues related to uncertainty and reactive management in cultural organizations. One of the main contributions of this work is the placement of analytics as an enabling facility instead of a limitation to the practice of art. Interpretability, scenario-based reasoning and collaborative work between humans and AI are the focus of the framework and curatorial autonomy and cultural values will be at the core of institutional decision making. As the case study shows, predictive systems can be effectively implemented into the current processes and governance systems when they are carefully designed and implemented, and when they enhance operational effectiveness and strengthen the bonds between administrative and curatorial staffs. Predictive insights can help in the long-term strategic resiliency in addition to the short-term operational benefits. Through predicting audience behaviour, financial patterns and other engagement patterns, the institution would be in a better position to respond to external shocks, changing of the populations and digitalization. Another point that is raised by the research is the need to implement analytics in cultural contexts guided by ethical data management, transparency, and situational awareness.
CONFLICT OF INTERESTS
None.
ACKNOWLEDGMENTS
None.
REFERENCES
Abramovich, F., and Pensky, M. (2019). Classification with Many Classes: Challenges and Pluses. Journal of Multivariate Analysis, 174, Article 104536. https://doi.org/10.1016/j.jmva.2019.104536
Barath, C.-V., Logeswaran, S., Nelson, A., Devaprasanth, M., and Radhika, P. (2023). AI in Art Restoration: A Comprehensive Review of Techniques, Case Studies, Challenges, and Future Directions. International Research Journal of Modern Engineering Technology and Science, 5, 16–21.
Cecotti, H. (2022). Cultural Heritage in Fully Immersive Virtual Reality. Virtual Worlds, 1(1), 82–102. https://doi.org/10.3390/virtualworlds1010006
Chang, L. (2021). Review and Prospect of Temperature and Humidity Monitoring for Cultural Property Conservation Environments. Journal of Cultural Heritage Conservation, 55, 47–55.
Dobbs, T., and Ras, Z. W. (2022). On Art Authentication and the Rijksmuseum Challenge: A Residual Neural Network Approach. Expert Systems with Applications, 200, Article 116933. https://doi.org/10.1016/j.eswa.2022.116933
Dobbs, T., Benedict, A., and Ras, Z. W. (2022). Jumping into the Artistic Deep End: Building the Catalogue Raisonné. AI and Society, 37(3), 873–889. https://doi.org/10.1007/s00146-021-01370-2
Kim, S., Park, S. M., Bak, S., Kim, G. H., Kim, C. S., Kim, C. E., and Kim, K. (2021). Advanced Art Authentication in Oil Paintings Using Precise 3D Morphological Analysis of Craquelure Patterns. Research Square. https://doi.org/10.21203/rs.3.rs-583044/v1
Lee, H., Jung, T. H., tom Dieck, M. C., and Chung, N. (2020). Experiencing Immersive Virtual Reality in Museums. Information and Management, 57(5), Article 103229. https://doi.org/10.1016/j.im.2019.103229
Leonarduzzi, R., Liu, H., and Wang, Y. (2018). Scattering Transform and Sparse Linear Classifiers for Art Authentication. Signal Processing, 150, 11–19. https://doi.org/10.1016/j.sigpro.2018.03.012
Łydżba-Kopczyńska, B. I., and Szwabiński, J. (2022). Attribution Markers and Data Mining in Art Authentication. Molecules, 27(1), Article 70. https://doi.org/10.3390/molecules27010070
Powell, L., Gelich, A., and Ras, Z. W. (2021). How to Raise Artwork Prices Using Action Rules, Personalization and Artwork Visual Features. Journal of Intelligent Information Systems, 57(3), 583–599. https://doi.org/10.1007/s10844-021-00660-x
Shi, K., Su, C., and Lu, Y.-B. (2019). Artificial Intelligence (AI): A Necessary Tool for the Future Development of Museums. Science and Technology of Museums, 23, 29–41.
Tennent, P., Martindale, S., Benford, S., Darzentas, D., Brundell, P., and Collishaw, M. (2020). Thresholds: Embedding Virtual Reality in the Museum. ACM Journal on Computing and Cultural Heritage, 13(1), 1–35. https://doi.org/10.1145/3369394
tom Dieck, M. C., and Jung, T. H. (2017). Value of Augmented Reality at Cultural Heritage Sites: A Stakeholder Approach. Journal of Destination Marketing and Management, 6(2), 110–117. https://doi.org/10.1016/j.jdmm.2017.03.002
Verhulst, I., Woods, A., Whittaker, L., Bennett, J., and Dalton, P. (2021). Do VR and AR Versions of an Immersive Cultural Experience Engender Different user Experiences? Computers in Human Behavior, 125, Article 106951. https://doi.org/10.1016/j.chb.2021.106951
|
|
 This work is licensed under a: Creative Commons Attribution 4.0 International License
© ShodhKosh 2025. All Rights Reserved.