ShodhKosh: Journal of Visual and Performing ArtsISSN (Online): 2582-7472
|
|
Predictive Modeling for Printing Ink Consumption
K. France 1![]()
![]() ,
Deepak Prasad 2
,
Deepak Prasad 2![]()
![]() , Om Prakash 3
, Om Prakash 3![]() , Divya Sharma 4
, Divya Sharma 4![]()
![]() , Nishant Trivedi 5
, Nishant Trivedi 5![]()
![]() , Anuja Abhijit Phadke 6
, Anuja Abhijit Phadke 6![]()
1 Associate
Professor, Department of Computer Science and Engineering, Aarupadai
Veedu Institute of Technology, Vinayaka Mission’s Research Foundation (DU),
Tamil Nadu, India
2 Assistant
Professor, Department of Journalism and Mass Communication, Vivekananda Global
University, Jaipur, India
3 Associate Professor, School of
Business Management, Noida International University, Greate Noida, Uttar
Pradesh, India
4 Centre of Research Impact and
Outcome, Chitkara University, Rajpura- 140417, Punjab, India
5 Assistant Professor, Department of
Animation, Parul Institute of Design, Parul University, Vadodara, Gujarat,
India
6 Department of Electronics and
Telecommunication Engineering, Vishwakarma Institute of Technology, Pune,
Maharashtra, 411037 India
|
|
|
ABSTRACT |
|
|
In the current
printing industries, precise forecasting of printing ink patterns is the key
to cost reduction, inventory control, and environmentally friendly
functioning. Conventional methods of estimation are based on coverage
assumptions, which are always static and operator experience which frequently
results in wastage of ink, delay in production and erratic quality. The paper
provides an in-depth predictive modelling platform of ink consumption
estimation based on statistical, machine learning, and deep learning methods.
The proposed strategy is one that formulates ink usage prediction as a
supervised regression, from which the heterogeneous inputs include the type
of paper, the area covered, the color density, the print resolution, and the
machine configuration parameters. The data is obtained during print job logs
and in-built machine sensors and job specification files and past production
logs. To increase predictive relevance and robustness, superior
pre-processing methods are used, such as feature engineering of color
coverage measures, ink density measures, and print complexity measures. The
comparison between methods of baseline linear regression and statistical
forecasting models and machine learning methods including decision trees,
random forest, support vectors regression, and gradient boosting are made.
Moreover, the deep learning models such as
artificial neural networks, long short-term memory networks, and hybrid
architectures are determined to obtain nonlinear relationships and temporal
dependencies between printing workflows. Experimental evidence shows that
ensemble and deep learning models are much more successful than the classical
approaches, with lower error in prediction and
overall generalization to a variety of print jobs. |
|||
|
Received 14 June 2025 Accepted 28 September 2025 Published 28 December 2025 Corresponding Author K. France,
france.avcs0114@avit.ac.in
DOI 10.29121/shodhkosh.v6.i5s.2025.6918 Funding: This research
received no specific grant from any funding agency in the public, commercial,
or not-for-profit sectors. Copyright: © 2025 The
Author(s). This work is licensed under a Creative Commons
Attribution 4.0 International License. With the
license CC-BY, authors retain the copyright, allowing anyone to download,
reuse, re-print, modify, distribute, and/or copy their contribution. The work
must be properly attributed to its author.
|
|||
|
Keywords: Printing Ink Consumption, Predictive Modeling,
Machine Learning, Deep Learning, Print Analytics |
|||


1. INTRODUCTION
The printing business continues serving as an essential element of the manufacturing sector in the world, the support of which includes the publishing business, packaging business, advertising business, textile business, and industrial labeling business. Although the process of digitizing content is accelerating, massive processes of printing still demand a considerable amount of physical materials, one of which is ink as a massive expense and environmental liability. The effective use of ink has a direct impact on the cost of production, the stability of its quality, the maintenance of the machine, and the results of sustainability. Therefore, precise prediction of printing ink usage has become a significant operational issue to contemporary print companies aiming at achieving a compromise between economic and environmental sustainability. The traditional methods of estimating ink, are usually done on the basis of predetermined percentages of coverage, standardized color charts, or by the human eye. Although these methods are easy to apply, they do not consider the complex and nonlinear behavior that exists between print parameters, including type of paper used, color density, image complexity, resolution, and machine-specific settings Chen and Xiang (2021). Differences in absorbency of paper, dot gain, drying properties, and printer calibration add to doubts in estimating ink usage, further. Consequently, conventional techniques tend to overestimate or underestimate ink demand resulting in a build-up of inventory, material wastage, unscheduled shutdown, and irregular quality of prints between jobs. The recent developments in the data availability and smart manufacturing systems have provided new opportunities to overcome this limitation by predictive modelling Yang et al. (2020). The current printing equipment features inbuilt sensors, digital controllers and logistical systems that constantly record comprehensive data on the print jobs, ink usage, color profiles and operating parameters. Coupled with the data on historical job records and job specification metadata, these data sources give a highly rich basis on which data-driven analysis of ink consumption behavior can be done Kotenko and Saenko (2023).
Predictive modeling uses this information to train relations using input parameters and actual ink usage and can dynamically forecast more accurately and responsively than rule-based forecasting which is purely static and not dynamic. The use of machine learning and deep learning methods is specifically advantageous to the prediction of ink consumption because it is capable of capturing the nonlinear trends and high-dimensional interactions. Basic trends can be reflected in regression-based models, whereas the tree-based ensembles and the use of kernel methods are more robust and understandable. More detailed neural network predictors and recurrent models can also be applied to deep learning architectures, which learn delicate feature representations and temporal features of sequential print operations to improve prediction errors Yu et al. (2022). These methods allow the models to extrapolate through a wide variety of print jobs, substrates and machine configurations presumably without having to make assumptions that are hand crafted. Proper prediction of ink use has real advantages in printing operations on a number of levels. Financially, it facilitates accurate cost estimation, optimal procurement and less working capital, which is tied in ink inventory Janiesch et al. (2021).
2. Related Work
The use of predictive modeling of printing ink usage has received more interest due to the rising nature of digital printing technologies and data-driven manufacturing systems. The initial research was primarily based on empirical and rule models with the estimation of ink utilization based upon a set of coverage ratios, computation of the dot areas, and the usage of standardized color charts. Though these techniques were computationally straightforward, they were based on linear correlation between image area and ink usage and did not usually take into account the influence of paper absorbency, ink substrate interaction and machine specific variations. Consequently, they could only be used in controlled settings and in small print settings Zhao et al. (2024). The statistic regression of models came out as a more adaptable option with the introduction of computer-to-plate and digital printing workflow. The correlation between ink usage and coverage area, resolution, and color density was done through linear and multivariate regression. Despite the fact that these models outperformed heuristic models in terms of accuracy of estimations, they could not represent nonlinear dependencies and intricate interactions between variables especially when it is a high-resolution and multiple-color printing environment Kumano and Akutsu (2022). Studies that are more recent have investigated machine learning solutions to these shortcomings.
The model of ink consumption has been used through decision trees and random forest models, which learn hierarchical relationships between print attributes and ink utilization. These methods had shown greater ability to withstand noisy data and have more generalization over a range of job types. Predictive performance was further increased with the support of the support vector regression and gradient boosting techniques which are considered to be able to deal with the high-dimensional feature space and nonlinear patterns. Some studies had shown that predictive error had reduced significantly than the traditional regression error, especially in packaging and commercial offset printing applications. The most recent development in the field is deep learning methods Fang et al. (2021). ANNs have been used to acquire multifaceted feature-free mappings between print parameters and ink usage. Long short-term memory models and recurrent neural networks have been studied to take into account temporal dependencies in continuous print jobs because the behavior of inks is affected by previous jobs and the machine warm-up. Table 1 is an overview of available literature on ink consumption prediction techniques. Statistical plus neural hybrid architectures have also been suggested in order to introduce a balance between interpretability and accuracy.
Table 1
|
Table 1 Summary of Existing Studies on Ink Consumption Prediction |
||||
|
Printing Domain |
Data Source |
Key Input Parameters |
Key Findings |
Limitations |
|
Offset Printing |
Job logs |
Coverage %, paper type |
Improved over manual
estimation |
Limited to linear relations |
|
Digital Printing |
Print records |
Color density, DPI |
Better cost estimation accuracy |
Poor nonlinear modeling |
|
Packaging Prints Pan et al. (2024) |
Historical jobs |
Coverage, substrate |
Captured rule-based patterns |
Overfitting issues |
|
Commercial Printing |
Sensor + logs |
Ink flow, speed |
High robustness to noise |
Higher computation |
|
Inkjet Printing |
Machine sensors |
Nozzle data, DPI |
Effective nonlinear modeling |
Kernel tuning sensitive |
|
Industrial Printing |
Job specs |
Resolution, color mix |
Superior accuracy to RF |
Limited interpretability |
|
Digital Press Lee and Kim (2020) |
Print archives |
Coverage, density |
Learned complex relations |
Needs large datasets |
|
Continuous Printing |
Time-series logs |
Sequential ink usage |
Captured temporal effects |
High training cost |
|
Textile Printing |
Sensor streams |
Fabric absorbency |
Improved generalization |
Domain-specific |
|
Commercial Offset Zhang and Li (2023) |
Multi-source data |
Content + machine |
Reduced prediction error |
Complex deployment |
|
Smart Printing |
IoT data |
Ink flow, humidity |
Adaptive prediction |
Requires IoT setup |
|
Large-scale Printing |
Cloud logs |
Job + environment |
High scalability |
Feature dependency |
|
Industry 4.0 Printing Wang et al. (2025) |
Integrated datasets |
Content, machine, time |
Best overall performance |
Limited explainability |
3. Problem Formulation and System Overview
3.1. Definition of ink consumption prediction problem
The problem of ink consumption prediction can be stated as follows: it is a supervised regression task where the task is to predict the amount of ink used to print a particular job correctly before doing anything. In practice printing conditions, the combinatory content-related, material-related, and machine-related factors determine the use of ink in a nonlinear and often unpredictable interaction Singh and Singh (2022). The predictive system aims at learning a useful map between these influencing factors to the actual ink used with past print information as training data. Mathematically, the issue lies in finding a function f(⋅) whereby y=f(x1,x2,…,x n) + ϵ, with y being consumption of ink, and xi and x n being the input parameters, and ϵ is an error and unknown variation. In contrast to the conventional estimation models that rely on absolute protocols of coverage, the suggested formulation focuses on flexibility of various print technologies, substrates and the complexity of jobs Li et al. (2022). The forecast should be precise enough to aid decision-making in operations including the purchase of ink, job cost, and schedule of production.
3.2. Input Parameters: Paper Type, Coverage Area, Color Density, Print Resolution, and Machine Settings
The type and the representation of input parameters that define the physical and operational characteristics of the printing process is of fundamental importance to the accuracy of the ink consumption prediction. A basic input is paper type because various substrates have different absorbency, coating, roughness of surface, and thickness, which have a direct impact on ink uptake and spread. The coverage area is the ratio of the size of the printable surface covered with ink and is a major measure of anticipated ink consumption Kuehn et al. (2024). Color density calculated sometimes as pixel intensity value or sometimes as color profile data, is a measure of the amount of ink applied to a unit area, and especially in multi-color and high-saturation prints.
Figure 1

Figure 1 Multi-Parameter Input Architecture for Printing Ink
Consumption Prediction
The settings on the machine, such as the print speed, the nozzle pressure, and the calibration settings, and the drying mechanisms are also additional sources of variability in the ink consumption behaviour. Figure 1 indicates that multi-parameter input architecture predicts the consumption of printing ink. These parameters make up a multidimensional feature vector of every print job. The process involved is feature engineering to convert raw inputs into informative measures e.g. normalized coverage ratios, composite color density indices and machine efficiency factors. The predictive model is able to consider the complex interactions that are not considered by the conventional single-factor estimation techniques by combining both content-driven and hardware-driven variables, thus enhancing predictive robustness and generalization in a wide variety of printing conditions Wu et al. (2025).
3.3. Output Variables and Performance Targets
The major output of the predictive modeling system is the projected ink consumption which is usually represented in standardized measure, of which the milliliters, grams, or cartridge usage per print job. It can also be disaggregated by color channel based on the operational needs need, allowing cyan, magenta, yellow and black ink to be fine-grained forecasted. In sophisticated applications, assistive outputs like ink wastage, frequency of refills or consumed per unit area can be obtained to give detailed production analysis. The system performance aims are also set concerning accuracy as well as reliability. To assess the accuracy of the prediction in relation to the real ink consumption, quantitative data are measured with the help of mean absolute error, root mean square error, and coefficient of determination. Operationally, there are acceptable error limits to make sure that the predictions are accurate enough to estimate the cost, inventory planning and sustainability evaluation. In addition to numerical precision, the model should have a high level of noisy data, missing data, and print job complexity. Other performance goals include low-latency inference and scalability which allow performance of real-time or near real-time prediction in high-throughput printing settings.
4. Data Acquisition and Pre-Processing
4.1. Data sources: print logs, sensor data, job specifications, and historical records
To make accurate predictions of printing ink usage, it is important that a combination of various and inhomogeneous data sources are combined, which explain the printing process. Modern printing systems produce print logs as one of the main sources of data, which provides specifications on job performance, such as job descriptions, the duration of print, a summary of ink utilization, errors in print, and performance. Added to these logs, embedded sensor data give finer-grained data to the ink flow rates, nozzle behavior, temperature, humidity, and pressure changes that directly affect the ink behavior in the process of printing. Job specification files provide context details concerning every print job such as the size of the document, color profiles, images complexity, resolution parameters and the choice of substrate. The data is also better enriched by historical records that give long-lasting tendencies of the ink consumption by various machines, type of jobs, and time intervals. Such records allow the model to get acquainted with recurring characteristics, seasonal influences and ageing properties of the machines. To integrate these data sources attention must be paid to aligning them with each other based on the common identifiers and timestamps to allow consistency in the records. The process of data fusion is to align sensor streams with print job metadata such that only a single dataset is obtained and can be used to model.
4.2. Feature Engineering: Color Coverage Metrics, Ink Density Indices, and Print Complexity Factors
The concept of feature engineering is critical in converting raw data on printing to meaningful representations that improve predictive quality. The measurements of color coverage using digital artwork or rasterized prints files are computed as the percentage ratio of each color channel taking up the space that can be printed. Such metrics include the spatial density and the amount of ink used on the page. Color values, tonal gradients, and color profile information are then collectively used to come up with ink density indices that can be used to estimate the relative quantity of ink deposited per unit area. These indices are useful in differentiating light coverage in which the saturation is high, and dense coverage with moderate tonal variation. Print complexity factors are added to provide quantification of the structural attributes of the print data, such as the count of graphical elements, density of text, variation in image resolution, and the frequency of an edge. These considerations are an indication of the degree of detail and variability in a print job which can affect ink deposition behavior. Other features used to measure hardware-induced variability include machine-related features, i.e., calibration offsets and operational stability scores. The methods of feature scaling and dimensionality reduction can be used to control feature correlations and also enhance learning.
5. Predictive Modeling Framework
5.1. Baseline models: linear regression and statistical forecasting
Baseline models are used to compare the power of more complex predictive methods of ink consumption forecasts. Most modeling models require linear regression as a preliminary model because of the simplicity, its interpretability and few computations. Here, the consumption of ink is represented as a weighted linear mixture of such features of the input as the coverage area, color density, and resolution of the print. Linear regression is very informative with respect to the impact of features, but the assumption of linear relationships and independent variables restricts the power of linear regression to recognize complex interaction effects while printing in the real world.
Figure 2

Figure 2 Baseline Models for Printing Ink Consumption
Prediction
The statistical prediction techniques such as the moving average and autoregressive models are also used to forecast the usage of ink when it is available in historical terms of usage. The Figure 2 illustrates baseline models that are used in the prediction of printing ink consumption. The methods are especially appropriate to repetitive print processes where temporal variations and effects of seasons are predominant. They however, usually make powerful assumptions about stationarity and do not consider job specific attributes in details. Because of this, the baseline models tend to suffer greater prediction error in the presence of varied substrates, different machine settings or complicated print designs.
5.2. Machine Learning Models: Decision Trees, Random Forest, SVR, and Gradient Boosting
There is also improved predictive power and flexibility in machine learning models with nonlinear relationships between print parameters and ink consumption. Decision trees divide the feature space into hierarchies guided by learned thresholds, which allow the building of a conditional dependence representation of variables into type and color density of paper to be used intuitively. Although decision trees are interpretable, they tend to overfit when they are trained on complicated data. Random forest models eliminate this weakness by combining multiple decision trees which are trained on bootstrapped samples, as well as randomized subsets of features, which leads to better generalization and resistance to noise. Support vector regression utilizes kernel functions to project input features into high-dimensional spaces to enable the model to acquire complex nonlinear patterns whose model complexity is controlled. In high-dimensional feature spaces, SVR is very successful, and has been shown to be susceptible to hyperparameter optimization and selection of the kernels used. The gradient boosting models are constructed through several iterative rounds of the weak learners by minimizing the residual errors at every run. They have proven to be highly effective in industrial regression activities because of their capability to employ heterogeneous features in their model and elicit subtle interactions.
5.3. Deep learning models:
1) ANN
Artificial Neural Networks are used to simulate complicated and non-linear inverse relationships between printing parameters and ink use. An ANN is made up of several fully connected layers, which process input features which include coverage area, color density and machine settings to higher levels. The network acquires complex interactions that are not possible to model in terms of conventional models through nonlinear activation functions. ANNs are especially useful when significant amounts of historical print data exist to make it possible to generalize effectively across a wide variety of jobs. They are flexible enough to accommodate the changes in substrates and print setup. Nevertheless, network depth, learning rate as well as regularization need to be carefully tuned to prevent overfitting.
· Step 1: Input Representation and Normalization
Let the input feature vector for a print job be:
![]() where xi represents features such as coverage
area, color density, paper type encoding, print resolution, and machine
settings.
where xi represents features such as coverage
area, color density, paper type encoding, print resolution, and machine
settings.
Normalize each feature as:
![]() to ensure numerical stability and faster
convergence.
to ensure numerical stability and faster
convergence.
· Step 2: Forward Propagation through Hidden Layers
For each hidden layer l, compute:
![]()
2) Long
Short-Term Memory Networks (LSTM)
Long short term memory networks Long short term memory networks are extensions of recurrent neural networks which add memory cells to model temporal correlations in sequence data. The use of ink in printing facilities tends to depend on previous print tasks, the warming up of machines and patterns of continuous operations. LSTM models are successful at learning such time sensitive behaviours by remembering all the important histories and forgetting the noises. This renders them very suitable when it comes to forecasting the use of ink in either batch or continuous printing processes. LSTMs enhance the accuracy of forecasting sensor readings and print logs by modeling sequential dependencies between sensor readings and print logs, which is better than the accuracy of statical models. Their primary difficulty is an increased level of computation and the necessity to have timely data.
Sequential Input Modeling
Given a sequence of print jobs or sensor readings:
![]()
where xt represents feature vectors at time step t.
3) Hybrid
Architectures
Hybrid modeling is the integration of the advantages of more than one modeling paradigm towards enhanced ink consumption prediction. Machine learning or statistical models are often combined with deep learning elements in uncommon designs, as would be a refinement of regression results with neural networks or placing LSTM layers in the context of ANN systems. These architectures make use of structured interpretation of features and nonlinear and temporal patterns. It is also common that hybrid models are more accurate and robust especially in heterogeneous printing environments. Hybrid methods offer solutions to industrial application by offering flexibility to adaptable and scalable ink consumption prediction under varying production environments by balancing interpretability and expressive power.
· Step 1: Parallel Feature Processing
Structured features:
xs → processed by ML model (e.g., RF / GBM)
![]()
Sequential features:
xt → processed by LSTM model
![]()
· Step 2: Feature Fusion Layer
Concatenate intermediate outputs:
![]()
Apply neural fusion:
![]()
6. Results and Discussion
6.1. Comparative performance analysis of predictive models
The relative comparison of predictive models shows that there is an orderly advancement in the performance of the statistical methods at the baseline level to the machine learning and deep learning methods. The high errors in predictions in linear regression and statistical forecasting models that are used to predict, especially complex, multi-color print jobs, are because of the very low ability to model nonlinear interaction in these models. Machine learning algorithms like random forest, support vegetable regression, and gradient boosting help a great deal decrease error measures by organizing complicated feature dependencies and variability among substrates and machine environments. The best prediction accuracy, which the deep learning models, namely LSTM and hybrid networks, can attain is because they learn not only nonlinear relationships but also time patterns within the printing processes.
Table 2
|
Table 2 Quantitative Performance Comparison of Ink Consumption Prediction Models |
|||
|
Model Type |
MAE (ml) ↓ |
RMSE (ml) ↓ |
MAPE (%) ↓ |
|
Linear Regression |
6.84 |
9.21 |
14.6 |
|
Random Forest |
3.21 |
4.62 |
7.1 |
|
SVR |
3.54 |
4.95 |
7.6 |
|
ANN |
2.74 |
3.98 |
6.1 |
|
LSTM |
2.42 |
3.61 |
5.6 |
Table 2 shows a quantitative analysis of the ink consumption prediction models based on MAE, RMSE, and MAPE, which clearly shows the increased performance of the advanced learning techniques. The highest error values are recorded by the Linear Regression and the MAE of 6.84 ml, RMSE of 9.21 ml and MAPE of 14.6 define the low ability to model nonlinear relationships between printing parameters. Figure 3 presents heatmap of error measures of regression and deep learning models. The prediction accuracy of random Forest is much better as it makes MAE to 3.21 ml and RMSE to 4.62 ml, which is approximately 53 percent less MAE than Linear Regression.
Figure 3
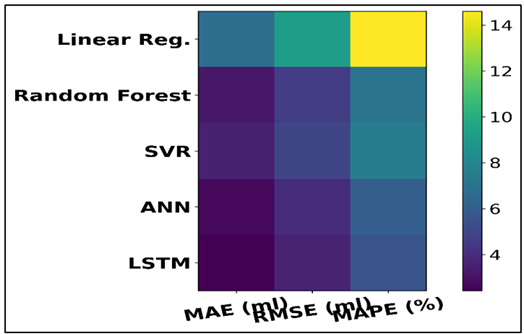
Figure 3 Heatmap of Error Metrics Across Regression and Deep
Learning Models
Similar results are obtained with SVR, which has an MAE of 3.54 ml and RMSE of 4.95 ml, although it is still a little less accurate than Random Forest because it is sensitive to the choice of kernel and parameters. The deep learning models are more efficient. Figure 4 presents stacked representation of MAE, RMSE, MAPE by models. The ANN minimizes MAE to a lower level of 2.74 ml and RMSE to a lower level of 3.98 ml which has the potential to reflect the capabilities of the ANN to represent the complex nonlinear interactions that exist between coverage, color density, and machine settings.
Figure 4
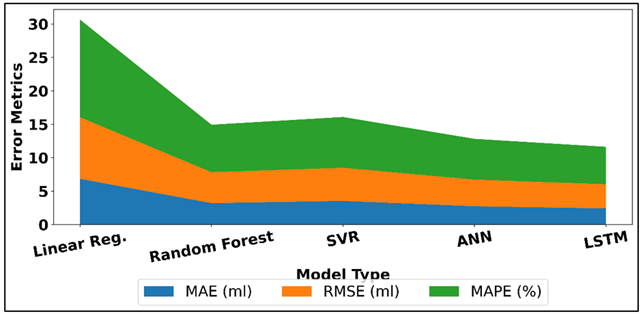
Figure 4 Stacked Visualization of MAE, RMSE, and MAPE Across
Models
LSTM model has the highest overall results, lowest MAE (2.42 ml), RMSE (3.61 ml), and MAPE (5.6%). It is another 12 per cent improvement in MAE compared to ANN, which indicates the role of modeling of time-dependence of continuous and sequential printing processes.
6.2. Impact of Key Features on Ink Consumption Prediction
The results of the feature impact analysis indicate that coverage area and color density are the most significant predictors of ink consumption because both have a direct correlation with the volume of ink deposition. The paper type is also critical since differences in absorbency and coating are also important influencing the uptake of ink. Print resolution affects the overlap of dots and dispersing ink and makes a moderate contribution to accuracy in prediction. Machine parameters, such as calibration values and print speed, are also another way of modulating ink usage or stability of ink flow. The interaction effects between content and machine driven feature are mostly evident when printing on high-resolution/saturated prints. The results illustrate the significance of full feature representation in predicting the consumption of a particular ink at an accurate and reliable level.
Table 3
|
Table 3 Feature Importance Scores for Ink Consumption Prediction |
|
|
Feature Parameter |
Importance Score (%) |
|
Coverage Area |
28.6 |
|
Color Density |
24.3 |
|
Paper Type / Absorbency |
17.8 |
|
Print Resolution (DPI) |
12.4 |
|
Machine Calibration |
8.9 |
Table 3 shows the comparative significance of major aspects of features that affect the prediction of ink consumption and indicates that the related parameters in terms of content prevail in the ink consumption behavior. It is also evident that Coverage Area is the most significant factor with the important score of 28.6, which validates the fact that it has a direct connection with the volume of ink deposited over the substrate. Figure 5 illustrates the distribution of features importance as affecting the printing quality analysis.
Figure 5
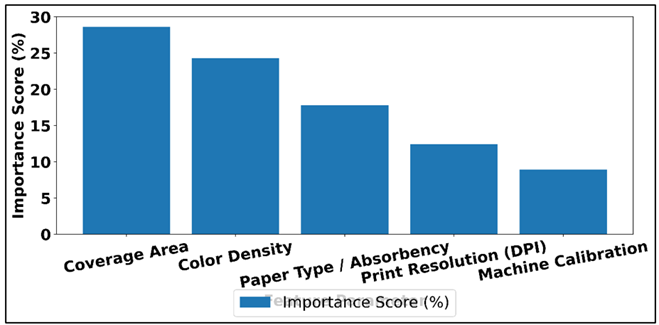
Figure 5 Feature Importance Distribution in Printing Quality
Analysis
Color Density comes next with the 24.3% which means that the saturation levels and tonal intensity influence the amount of ink used beyond the area coverage. The Paper Type and Absorbency take 17.8 percent and represents the effect that the properties of substrate like coating and porosity have on the penetration and spread of the ink. Print Resolution adds 12.4 in that an increase in DPI settings will add more dots and overlap resulting in more ink being used. However, still, the role of Machine Calibration, even being, comparatively, the lowest, 8.9, is not insignificant, and it affects the consistency of ink flow and precision of deposition. The first three features combined form 70.7 percent of the total importance which means that an accurate prediction of ink consumption depends more on a detailed characterization of content and material than on machine settings.
7. Conclusion
This paper has introduced an overall predictive modelling structure to predict the use of printing ink through the combination of both data-driven and domain-specific printing knowledge. The research addressed the weakness of the traditional rule-based and heuristic methods that tend to lack comprehensive complexity to model the ink-usage estimation as a supervised regression problem. The suggested framework effectively introduced the heterogeneous data sources, strong preprocessing plans, and feature models that were well designed to reflect the content features, substrate features, and machine settings. A close comparison of baseline statistical models, machine learning models and deep learning models has shown that sophisticated models outperform conventional estimation methods by huge margins. Although linear regression and statistical forecasting gave good benchmarks, the performance of the ensemble-based machine learning models and deep learning models (i.e. LSTM and hybrid models) demonstrated better quality in terms of accuracy and generalization. These models were good at modeling non-linear interactions and time dependencies of continuous and high variability printing processes. Pattern analysis on impact of features also indicated that coverage area, color density, and paper type are the overall factors of impact of ink consumption, so consideration of both content-driven and material-driven parameter is essential. In addition to the predictive accuracy, the suggested framework provides significant practical value to the printing activities.
CONFLICT OF INTERESTS
None.
ACKNOWLEDGMENTS
None.
REFERENCES
Chen, F., and Xiang, Z. (2021). Experimental Analysis of Optimal Solid Ink Density for Secondary Fiber Newsprint. Printing Industry, 5, 55–59.
Fang, Y., Lu, X., and Li, H. (2021). A Random Forest-Based Model for the Prediction of Construction-Stage Carbon Emissions at the Early Design Stage. Journal of Cleaner Production, 328, 129657. https://doi.org/10.1016/j.jclepro.2021.129657
Janiesch, C., Zschech, P., and Heinrich, K. (2021). Machine Learning and Deep Learning. Electronic Markets, 31, 685–695. https://doi.org/10.1007/s12525-021-00475-2
Kotenko, I. V., and Saenko, I. B. (2023). Exploring Opportunities to Identify Abnormal Behavior of Data Center Users Based on Machine Learning Models. Pattern Recognition and Image Analysis, 33, 368–372. https://doi.org/10.1134/S1054661823030227
Kuehn, J., Abadie, S., Delpey, M., and Roeber, V. (2024). Super-Resolution on Unstructured Coastal Wave Computations with Graph Neural Networks and Polynomial Regressions. Coastal Engineering, 194, 104619. https://doi.org/10.1016/j.coastaleng.2024.104619
Kumano, S., and Akutsu, T. (2022). Comparison of the Representational Power of Random Forests, Binary Decision Diagrams, and Neural Networks. Neural Computation, 34, 1019–1044. https://doi.org/10.1162/neco_a_01486
Lee, S., and Kim, J. (2020). Prediction of Nanofiltration and Reverse-Osmosis-Membrane Rejection of Organic Compounds Using Random Forest Model. Journal of Environmental Engineering (ASCE), 146, 04020127. https://doi.org/10.1061/(ASCE)EE.1943-7870.0001806
Li, H., Lin, J., Lei, X., and Wei, T. (2022). Compressive Strength Prediction of Basalt Fiber Reinforced Concrete Via Random Forest Algorithm. Materials Today Communications, 30, 103117. https://doi.org/10.1016/j.mtcomm.2021.103117
Pan, M., Xia, B., Huang, W., Ren, Y., and Wang, S. (2024). PM2.5 Concentration Prediction Model Based on Random Forest and SHAP. International Journal of Pattern Recognition and Artificial Intelligence, 38, 2452012. https://doi.org/10.1142/S0218001424520128
Singh, D., and Singh, B. (2022). Feature-Wise Normalization: An Effective Way of Normalizing Data. Pattern Recognition, 122, 108307. https://doi.org/10.1016/j.patcog.2021.108307
Wang, J., Hou, Z., Chen, Y., Li, G., Kan, G., Xiao, P., Li, Z., Mo, D., and Huang, J. (2025). The Acoustic Attenuation Prediction for Seafloor Sediment Based on In-Situ Data and Machine Learning Methods. Journal of Ocean University of China, 24, 95–102. https://doi.org/10.1007/s11802-025-5783-5
Wu, Y., Chen, J., Lin, C., and Li, Z. (2025). Optimization of Low-Earth Orbit Density Model Based on Support Vector Regression. Advances in Space Research, 75, 3601–3613. https://doi.org/10.1016/j.asr.2024.11.062
Yang, B., Xu, J., Long, H., and Guo, L. (2020). Study on the Matching Relationship Between Minimum Color Difference and Optimal Density in Print. Digital Printing, 147–151.
Yu, C. X., Ying, S., Min, Z. X., and Feng, G. (2022). Research Progress and Trend of the Machine Learning Based on Fusion. International Journal of Advanced Computer Science and Applications, 13, 1–7. https://doi.org/10.14569/IJACSA.2022.0130701
Zhang, Y., and Li, Z. (2023). RF_Phage Virion: Classification of Phage Virion Proteins with a Random Forest Model. Frontiers in Genetics, 14, 1224665. https://doi.org/10.3389/fgene.2022.1103783
Zhao, S., Chen, L., and Huang, Y. (2024). ADAS Simulation Result Dataset Processing Based on Improved BP Neural Network. Data, 9, 11. https://doi.org/10.3390/data9010011
|
|
 This work is licensed under a: Creative Commons Attribution 4.0 International License
© ShodhKosh 2025. All Rights Reserved.