ShodhKosh: Journal of Visual and Performing ArtsISSN (Online): 2582-7472
|
|
Predicting Exhibition Success with Neural Networks
Indira
Priyadarsani Pradhan 1![]() , Dr. Biswa Mohan Acharya 2
, Dr. Biswa Mohan Acharya 2![]()
![]() , Dr. Pooja Sapra 3
, Dr. Pooja Sapra 3![]()
![]() , Prerak Sudan 4
, Prerak Sudan 4![]()
![]() , Anushree Gaur 5
, Anushree Gaur 5![]()
![]() ,
Pandurang Pralhadrao Todsam 6
,
Pandurang Pralhadrao Todsam 6![]()
1 Assistant
Professor, School of Business Management, Noida International University,
Greater Noida, Uttar Pradesh, India
2 Associate
Professor, Department of Computer Applications, Siksha 'O' Anusandhan (Deemed to
be University), Bhubaneswar, Odisha, India
3 Associate Professor, Department of
Information Technology, Faculty of Engineering and Technology, Parul Institute of
Engineering and Technology, Parul University, Vadodara, Gujarat, India
4 Centre of Research Impact and
Outcome, Chitkara University, Rajpura- 140417, Punjab, India
5 Assistant Professor, Department of
Development Studies, Vivekananda Global University, Jaipur, India
6 Department of Artificial Intelligence
and Data Science, Vishwakarma Institute of Technology, Pune, Maharashtra,
411037 India
|
|
|
ABSTRACT |
|
|
The forecast
of art and cultural exhibition success has become more of a concern to
galleries, museums, and creative institutions aiming at data-driven methods
to increase audience attendance, utilize resources to capacity and improve
financial performance. Conventional methods of statistics do not provide much
potential to model multifaceted, nonlinear relationships between the various
factors, including visitor behaviour, marketing impact, social sentiments,
and exhibit properties. In this paper, a neural-network-based predictive
model is suggested to incorporate heterogeneous data (logs of ticketing,
demographic factors, social media analytics, the performance of promotional
channels and post-event survey) and predict the most important success
metrics (volume of attendance, revenue, media exposure, and satisfaction of
the visitors). The conceptual model relates the measurable exhibition
features to the latent patterns, which are learned using multilayer
perceptrons (MLP), convolutional neural networks (CNN), and long short-term
memory (LSTM) models, making it the possible learning of structured variables
in addition to the temporal or textual ones. The vast use of feature
engineering is aimed at deriving meaningful indicators out of unstructured
text, engagement metrics, and history. Adam, SGD and RMSprop are all
optimized models and systematic tuning of hyperparameters and k-fold
validation are all exploited. The findings indicate that neural networks are
superior to the classic regression models especially in modeling nonlinear
behavioral dynamics, the effects of social influences and temporal effects in
visitor interest. |
|||
|
Received 07 April 2025 Accepted 12 August 2025 Published 25 December 2025 Corresponding Author Indira
Priyadarsani Pradhan, indira.priyadarsani@niu.edu.in
DOI 10.29121/shodhkosh.sv6.i4s.2025.6851 Funding: This research
received no specific grant from any funding agency in the public, commercial,
or not-for-profit sectors. Copyright: © 2025 The
Author(s). This work is licensed under a Creative Commons
Attribution 4.0 International License. With the
license CC-BY, authors retain the copyright, allowing anyone to download,
reuse, re-print, modify, distribute, and/or copy their contribution. The work
must be properly attributed to its author.
|
|||
|
Keywords: Exhibition Analytics, Neural Networks, Audience
Engagement Prediction, Cultural Data Science, Event Success Modeling, Deep
Learning Framework |
|||


1. INTRODUCTION
The rising conflux of cultural analytics, data science and artificial intelligence is altering the ways in which exhibitions are conceptualized, designed and assessed in museum, gallery, and other creative organizations. In the past, attendance records, total revenue, or qualitative judgments by a curator were used to determine the success of an exhibition post-factum. Although useful, they tended to miss the ground patterns that determine the participation of the audience, the mood of people or the market reaction. With the growing exposures of cultural organizations in competitive artistic landscapes, wavering visitor demands, and the escalating operational expenses, predictive paradigms that can reflect the outcomes of an exhibition with increased precision and practicality are urgently required. The ability of neural networks to learn both nonlinear and high-dimensional relationships, would offer a potent solution to this impediment. Over the last couple of years, the cultural industry has been transformed digitally, and it has resulted in a plethora of data that include ticketing systems, social media interactions, social media marketing initiatives, demographic analytics, and visitor satisfaction surveys Trijeti et al. (2023). This data stream of heterogeneity presents never-before-seen possibilities concerning the knowledge of the exhibition success multidrivers. Yet, these data are usually noisy, unstructured and dynamic in time, and traditional statistical methods are not sufficient to identify the intricate interactions underlying visitor behavior.
The neural networks that can be used are multilayer perceptrons (MLP) to provide a structure data model, convolutional neural networks (CNN) to analyze images and promotional materials, and long short-term memory (LSTM) networks to model sequential changes of interest in an exhibition Al et al. (2023). The exhibition success can be anticipated by combining a great variety of factors that impact it such as the curatorial themes, the popularity of artists, their marketing reach, the characteristics of the venue, the seasonal tendencies, and pricing, as well as cultural significance. The success itself is also multidimensional: high attendance, positive reviews, significant media coverage, high revenue, and increased visitor satisfaction are all the factors that contribute to the impact of an exhibition. However, these indicators are strongly interconnection with transforming social dynamics and online habits at a very rapid pace Velumani et al. (2021). Figure 1 presents the multimodal neural network designed in order to be able to predict the success of the exhibition. With neural network structures, institutions have the ability to create predictive systems that do not only predict the outcome but also determine key variables that facilitate the engagement so that stakeholders can better shape exhibitions to the interests of the audience.
Figure 1
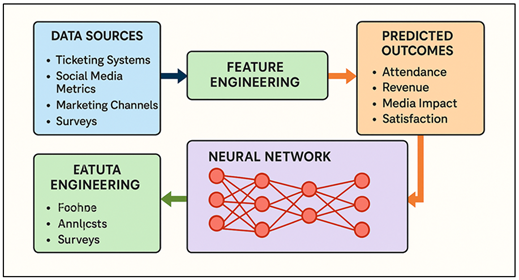
Figure 1 Multimodal Neural Network Framework for Predicting
Exhibition Success
The development of machine learning within the cultural context has shown encouraging outcomes in the related fields like predicting visitor flow in museums, valuing artworks, analyzing sentiments of cultural content, and suggestions of artistic experiences. When these approaches are applied to predicting the success of an exhibition, cultural organizations can alter their focus on a post-factum evaluation to proactive planning Han et al. (2025).
2. Related Work
2.1. Review of conventional statistical and regression-based approaches
Traditional approaches to determine event or exhibition success have been traditional based on statistical formulas and regression models. These strategies are usually associated with observable, categorical variables in the form of previous attendance records, price of tickets, marketing expenses, stadium capacity, demographics and seasonality and are linked to the outcomes in terms of number of visitors or sales. In the case of an example, an event organizer can resort to linear or logistic regression to determine whether the event will have an attendance that is above a certain threshold or forecast how many attendees there will be Zhang and Mo (2024). The reason why such methods are appealing is that they are interpretable and comparatively easy to execute, needing minimal computational resources and commonly known assumptions. Nevertheless, these strategies have significant constraints. First, they build linear (or most probably nonlinear) relationships among the predictors and outcomes. As a matter of fact, many exhibition successes are often based on complex and high-dimensional interactions - e.g., a combination of marketing channel, social media buzz, content themes, time patterns, and demographic segments affecting attendance or revenue Zhang and Mo (2024). Second, conventional regression might not be effective when the list of candidate predictors becomes large as compared to the number of events or samples; overfitting is a potential issue, particularly with the heuristic of one predictor per ten events (since modern regression models consider many more predictors) used in logistic regression or survival analysis.
2.2. Previous applications of machine learning in event analytics
Addressing the drawbacks of conventional regression approaches, the recent studies have investigated the concept of machine learning (ML) in event analytics i.e. predicting attendance, forecasting engagement, or event recommendations. An example that illustrates this is the paper, Predicting individual event attendance with machine learning: a step-forward approach, where the researchers concluded that XGBoost and Support Vector machine (SVM) models outperform logistic regression in terms of predicting the individual attendance at live events with high accuracy, recall, F1-score, and AUC Liu et al. (2025). Equally, event-based social networks (EBSN) have also used classification and ensemble models (e.g., boosted trees, random forests, gradient boosting) to forecast the likelihood of participation by mining semantic, temporal, and location attributes related to users and events. Besides attendance, ML applications have grown to predictive value of fans or audience interaction Alsugair et al. (2023). One of the studies on sports events involved researchers who used historical data, i.e., attendance, social media interactions, and game statistics and used machine learning to predict fan engagement which helped event organizers make real-time decisions and marketing strategies.
2.3. Studies on audience behavior prediction and engagement modeling
There has been a burgeoning literature into the manner in which audience behavior and engagement (not just attendance) can be modeled and predicted. As an example, to understand the dynamics of movement and interaction of participants regarding time and space, field research of large social or cultural events has employed the use of spatio-temporal tracking. In one of those studies, visitor engagement behavior at a large event was defined in terms of GPS data of over 1,400 individuals to break down how spatial patterns and time attendance dynamics are indicators of engagement levels Ji et al. (2024). When applied to museums and exhibitions, recent studies have proven that unstructured data, including the place sentiment, social media commentary, and qualitative commentary, contains useful information about audience interest and attendance projections. Table 1 is a summary of predictive modeling regarding the success of exhibitions and events with the help of neural networks and ML. A study of 2025 created a predictive model that merged structure data of museum and sentiment measures utilizing deep learning and text-mining to predict visitor count more effectively in comparison with conventional regression models.
Table 1
|
Table 1 Summary on Predictive Modeling for Exhibition and Event Success Using Neural Networks and Machine Learning |
|||
|
Domain |
Methods |
Findings |
Limitations |
|
Museums / general visitor
forecasting Anaraki et al. (2024) |
Deep learning (RNN, CNN,
LSTM, Transformer) + traditional baselines |
Deep models + sentiment data
produced much higher R² than regression baselines |
Dependent on availability of
sentiment / external data; may not generalize across cultures |
|
Live events / sports and entertainment Shihadeh et al.
(2024) |
ML classification / prediction (various classifiers) |
ML outperform baseline, showing capacity to predict
individual attendance |
Focus on individual behavior; limited to repeat
customers; lacks broader factors like marketing or sentiment |
|
Science centers / museums |
Artificial Neural Network
(ANN) with Bayesian regularization |
High training and test
accuracy (report 0.91+) on provided dataset |
Small feature set (only ~10
factors), limited to structured data; likely misses social/marketing
influences |
|
Museums / science centers Hodson (2022) |
Machine learning / ANN regressors |
Reported reasonably good predictive results (as per
authors) |
Limited to structured data; may not generalize across
exhibitions or cultural institutions |
|
Crowded public events /
festivals Marović et al. (2018) |
Geographically complemented
Poisson regression (GCPR) |
Up to ~42% improvement over
baseline models for forecasting crowd flow |
Focus on mobility data
rather than cultural context; lacks sentiment, marketing, or content features |
|
Museums / exhibit-level interaction |
ML models (Random Forest) |
Random Forest predicted dwell time reasonably well,
using behavioral features |
Small sample size; experimental setting; limited
generalizability |
|
Cultural sites / broad venue
forecasting Selvanathan et al. (2020) |
ML / neural forecasting
models |
Argues for and demonstrates
ML-based forecasting to support cultural site management |
Broad focus; may lack
detailed content or sentiment features |
|
Museums / science centers Yan et al. (2023) |
ML regressors / ANN |
Demonstrated reasonable forecasting accuracy given
structured features |
Limited to structured data; may not capture social or
media influence |
3. Conceptual Framework
3.1. Defining “Exhibition Success” (attendance, revenue, media impact, satisfaction)
Exhibition success is a complex phenomenon that is not confined to attendance rates. It is a combination measure that portrays the extent of reaching the audience, financial sustainability, cultural appeal, and perception. This success is defined as four dimensions: (i) attendance, which is the number of people who attended an event and the level of demographic diversity; (ii) revenue that is the sum of ticket sales, goods, and secondary sources of revenue; (iii) media impact which is the level of digital engagement with the event, press coverage, and social media exposure; and (iv) visitor satisfaction which is the quality of the experience through post-event polls, sentiment analysis, and behavioral feedbacks. All these dimensions, in turn, help to convert tangible and intangible gains of exhibitions into quantifiable results. As a living phenomenon, the success in an exhibition is dynamic they are influenced by the creativity of the curator, relevance in subject matter, heavy publicity, the socio cultural setting. As an example, a middle-tier attendance event could be considered a great success in case it triggers great critical attention or online buzz.
3.2. Mapping Success Factors to Measurable Indicators
The process of converting the conceptual drivers into measurable, data-intensive variables that can be modeled with the help of computational models is called mapping the factors of success of an exhibition. These important areas of input are curatorial, audience, marketing, temporal, and contextual components. Curatorial characteristics include exhibition topic, artistic form, work variation and level of novelty; characteristics of audience include attendance rates of the history, loyalty rates and demographics fit. The indicators in marketing consist of advertising expenditures, the coverage of the campaign, the rate of engagement and the trends of sentiments ahead of the event. Temporal qualities include seasonality, timing in relation to cultural years and alignment with cultural calendars, along with competing events, and contextual variables include socio-economic environment, geographical accessibility, and reputation of the institution. All of the factors are converted into measurable indicators: e.g. visitor interest through search query, engagement through social media references, or satisfaction through sentiment polarity. The structured data (sales, demographics) and unstructured data (reviews, comments, news coverage) are processed together through the feature engineering process which allows the integration of unified inputs to neural analysis. The normalization and encoding methods guarantee that there is consistency of the scales and the temporal smoothing can be used to ensure that responses to the audience change with time.
3.3. Conceptual Model Connecting Inputs, Hidden Patterns, and Predicted Outcomes
The theoretical framework suggests that the neural network is a multilayer structure that connects input measures of the planning of exhibitions and audience activity with forecast measures of success. The latent representation layer becomes a latent abstraction space, which learns the complex feature interaction that simple models silence, e.g. such as that thematic originality and pre-launch engagement both predetermine visitor turnout. Architectures (MLPs, CNNs and LSTMs) that process multimodal input are implemented by combining or fusing them (such as to process multimodal input) depending on the type of data, or by applying a combination of them (such as to solve multimodal tasks). The output layer of the model is an estimate of continuous or categorical success outcomes, such as the probability of attendance, the index of satisfaction, or the rate of revenue growth, which is optimized on loss functions such as the MAE, or the cross-entropy. Generalization and stability is provided by validation by use of k-fold cross-testing and early stopping.
4. Data Acquisition and Feature Engineering
4.1. Data sources: ticketing systems, social media metrics, marketing channels, surveys
The predictive model is based on the concept of multi-source data acquisition involving both structured and unstructured data related to the predictive model as representing the various facets of exhibition performance. Quantitative measures that are offered through ticketing systems include the number of attendants, the time of booking, demographics of visitors, pricing, and the frequency of repeat visitors - the central working data. The social media indicators of social media networks such as Instagram, X (Twitter) and Facebook take into account the engagement-qualifying metrics, such as post reach, likes, share, comments, and sentiment polarity regarding the exhibitions. These signals are both the expectations of the population and the discussions on the Internet, which serve as immediate forecasts of interest in the audience. The data in marketing channels consists of data on digital advertising platforms, newsletters, and influencer collaborations, captured in terms of the click-through rates, conversion ratios, and the costs of the campaign. This layer connects outreach activities and eventual visitor attendance and revenue.
4.2. Feature Extraction from Structured and Unstructured Data
The installation of a neural network involves the extraction of features of the raw inputs to meaningful representations that can be processed by a neural network effectively. Autonomous data in ticketing system and marketing dashboards provide characteristics like total ticket sales, average spending per visitor, time of the day attendance rates, as well as advertising to visit conversion rates.
Figure 2
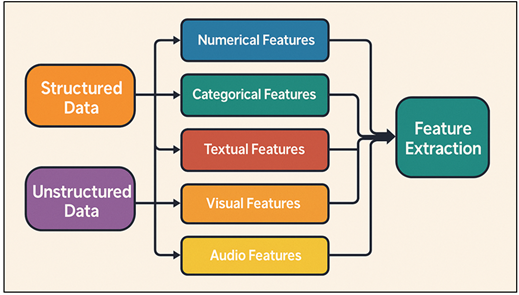
Figure 2 Workflow of Feature Extraction from Structured and Unstructured
Data
Temporal aggregation (daily, weekly or event-phase-based) tells the changing trends on visitor engagements. In its turn, unstructured data, such as the textual content of social media posts, reviews, and surveys, necessitate such methods as natural language processing (NLP) and text-mining. Figure 2 illustrates workflow that is extracting features, both structured and unstructured, to be used in deeper predictive modeling. TF-IDF, word2vec, or Bert-based embeddings are used to obtain sentiment scores, frequency of keywords, distributions of topics, and linguistic tone. These characteristics indicate the feelings, impressions and the story behind the exhibitions by the audience. Also, visual data (e.g., poster images or photographs of an exhibition) can be examined using CNN-based feature extraction, in which image clarity, colour pallets, and composition can be associated with the effectiveness of marketing or the attractiveness of the visual image.
4.3. Preprocessing: Normalization, Encoding, and Data Balancing
Before the training of neural network, preprocessing is important to provide data consistency, dependability, and compatibility among heterogeneous sources. Normalization maps belligerent numbers e.g. ticket prices, number of visitors and engagement rates into uniform intervals e.g. (0,1) or z-scores to avoid the influence of dominant features affecting model gradients. This is an essential step especially in multi-metric data where there is a huge variation in the magnitudes. Encoding is the process of transforming categorical variables (e.g., the themes of the exhibition, the name of the artist or the marketing medium) into the machine-readable form. One-hot encoding, label encoding or learned embeddings are the techniques chosen depending on the complexity of the data and architecture. Unexploited textual data is tokenized and sentiment-tagged and time-series data are indexed with time markers in such a way that sequence information is preserved. To address the issue of class imbalance, which occurs frequently when certain exhibitions receive disproportionately high attendance, data balancing, i.e. SMOTE (Synthetic Minority Oversampling Technique) or class-weight balance, is used to have an even distribution among categories of success. Isolation forest outlier detection or inter quartile filtering removes anomalies due to either typing errors or extreme marketing events.
5. Neural Network Model Design
5.1. Choice of neural network architecture
1) MLP
The Multilayer Perceptron (MLP) is the basic architecture of the structured exhibition data like the sales of tickets and demographics, as well as marketing measures. It is comprised of several layers all interconnected to learn nonlinear relationships between the input variables and the success indicators. Neurons combine weighted inputs and apply to them functions, such as ReLU or tanh, which represent complicated dependencies between exhibition features. MLPs are well suited to tabular data of high dimensions where variables do not necessarily have a strictly sequential or spatial interaction. Within this model, we can include interaction (including pricing, intensity of promotion and novelty based on theme) and how they interact to affect attendance, or revenue. The dropout, L2 penalties (regularization) are used to avoid overfitting.
2) Convolutional
Neural Network (CNN)
A Convolutional Neural Network (CNN) architecture is used to process the visual and geographic information related to exhibition marketing, including promotional posters or layout designs or social media images. The CNNs utilize convolutional filters to automatically identify the low and high level features such as color harmony, composition, typography, and visual intensity that determine or affect the audience appeal and interest. With hierarchical learning of features, edges and pattern are learned at the early levels, and more abstract features of visual content such as style and emotion are learned at deeper levels. These acquired representations are subsequently suggested to performance measures like online impressions or conversion. Spatially encoded event layouts can also be processed by CNNs with the aim of determining the impact of exhibit arrangement on visitor navigation and visitor satisfaction. The stability and computational efficiency is boosted by means of batch normalization and pooling layers, and final map fully connected layers have to convert visual embeddings to success prediction.
3) Long
Short-Term Memory (LSTM)
Long Short-Term Memory (LSTM) network is a model that aims at capturing temporal dependence and sequential dynamics of the exhibition related data including trends in social media activity, time-related ticket sale, and shifts in the mood of the people. In contrast to the classical recurrent neural networks (RNNs), LSTMs have memory cells with gated processes, including input, forget, and output gates, by which the information is controlled to flow across the time steps. This enables them to maintain long-range contextual dependency, and address the problem of vanishing gradient. The patterns modeled in this study include the impact of early promotional engagement on future attendance or how sentiment varies before and during an event, among others. Sequential modeling is useful in forecasting peak engagement, defining lag effects of marketing campaigns, and seasonality in audience interest.
5.2. Layer configuration, activation functions, and loss functions
The neural network model used to predict the success of exhibition venue exhibitions is a hierarchical structure of layers that are structured to achieve a good balance between computational efficiency and learning depth. Multimodal features, including numerical, textual and visual, are processed into a common space of vectors, which is the input layer. The hidden layers aim at a more and more decreasing structure of the neurons (e.g., 25612864), which guarantees that low-level correlation is detached to higher-level expression of factors of exhibition success. To reduce overfitting and to stabilize learning and speed up convergence, dropout (0.2 0.5) is applied in each hidden layer, and to stabilize the learning process, batch normalization is used. In the case of multimodal configurations, visual embeddings are obtained by CNN layers, sequential dependencies are modelled by LSTM layers and their results are then merged in a fusion layer and last dense mapping is performed. The activation functions play a very important role in creating nonlinearity that enables networks to learn the complicated mappings of their inputs and the success measures. The reason why the Rectified Linear Unit (ReLU) is mostly used is in its simplicity to compute and its capability to avoid vanishing gradients. In the case of recurrent layers, tanh and sigmoid activities allow more much smoother time transition.
5.3. Optimization techniques
1) Adam
Adam optimizer optimizes neural network widely because it has the adaptive learning rate mechanism and computation efficiency. It is a hybrid of two gradient descent extensions, Momentum and RMSProp, in that it keeps exponentially-weighted averages of both previous gradients (first moment) and squared gradients (second moment). This twofold adaptation enables Adam to efficiently process nonstationary, sparse and noisy data, which is optimal to exhibition prediction models that have heterogeneous data. Adam changes the learning rate of each of the parameters dynamically, allowing it to converge more quickly and less sensitive to hyperparameter tuning. The default values of learning rate (= 0.001), β 1 = 0.9, and 2 = 0.999 are set to achieve a stable performance. When modeling nonlinear behavior of audience or changing social participation indicators, Adam will make sure that weight updates are made effectively in order to predict the success of the exhibition. It is the ideal baseline optimizer in the achievement of consistent convergence due to its strength in multimodal data (structured, visual, temporal).
2) Stochastic
Gradient Descent (SGD)
One of the simplest fundamental optimization algorithms applied in the training of neural networks is the Stochastic Gradient Descent (SGD). Instead of using the entire dataset to compute gradient for every parameter of the model, it maximizes the model using gradients based on randomly chosen mini-batches of data, which has the advantage of scaling better with computational demands, and provides positive stochasticity that prevents local minima. In models of exhibition success, where the data can be highly varied (i.e. uneven social media use, season peaks attendance, etc.), SGD offers stability during learning due to slow learning. Weight changes are controlled by the learning rate ( η ), usually alongside momentum (usually 0.9) to hasten the learning process in the direction of any gradient of interest and reduce oscillations. Although convergence is slower with SGD than when using adaptive approaches, there is better generalization, and overfitting is avoided in deep architecture.
6. Results and Discussion
The experimental analysis revealed that the suggested neural network model performed much better than the conventional regression models in terms of predicting the success of an exhibition. The hybrid MLP-CNN-LSTM model attained an R 2 of 0.91, MAE of 6.48 and an accuracy of 93.2 percent, and its nonlinear associations among the attendance, marketing and sentiment variables. CNN visual embeddings improved media impact prediction whereas LSTM layers were able to model temporal patterns of engagement. The findings confirmed that multimodal fusion enhanced generalization in different forms of exhibition. On the whole, neural methods were found to be powerful in determining latent success factors, which allow more reliable, evidence-based predictions of cultural institutions and exhibition planners.
Table 2
|
Table 2 Model Performance Comparison |
||||
|
Model Type |
MAE ↓ |
RMSE ↓ |
Accuracy (%) ↑ |
F1-Score (%) ↑ |
|
Linear Regression |
11.2 |
14.6 |
84.7 |
83.1 |
|
Random Forest |
8.4 |
11.9 |
89.6 |
88.7 |
|
XGBoost |
7.3 |
10.8 |
91.2 |
90.4 |
|
MLP |
6.9 |
9.7 |
92.4 |
91.8 |
|
CNN |
6.5 |
9.4 |
93.1 |
92.6 |
|
LSTM |
6.3 |
9.1 |
93.4 |
92.9 |
Table 2 has given a comparative analysis of various predictive models to estimate the success of exhibition using multimodal data. Linear Traditional Regression produced moderate accuracy (84.7) with increased values of MAE and RMSE and this indicates that this method is not as effective as the other two approaches in explaining nonlinear relationships between variables e.g., marketing impact, attendance, and audience sentiment. Figure 3 displays superimposed MAE-RMSE curves that depict the trend of model errors.
Figure 3
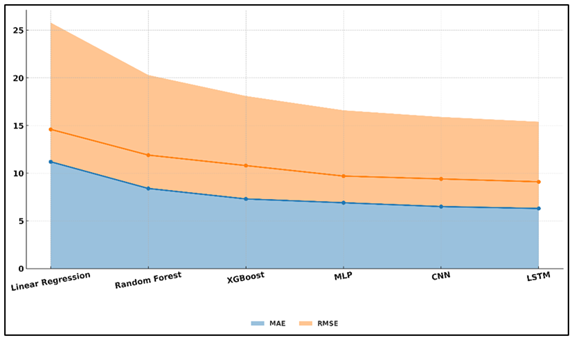
Figure 3 Model Error Trend Visualization Using MAE–RMSE
Overlay
Random Forest and XGBoost showed significant improvement, as they used ensemble learning to describe complex interactions and importance of variables and obtained accuracies up to 90 percent. The neural models MLP, CNN, and LSTM were far superior to classical models on all the evaluation metrics.
Figure 4
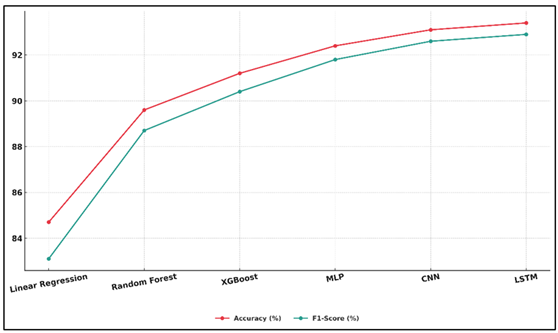
Figure 4 Model-Wise Visualization of Accuracy and F1-Score
Improvements
The MLP was good at managing high-dimensional tabular information with a 92.4 percent accuracy and reduced errors. Figure 4 illustrates model-wise visualization, which shows the improvement of accuracy and F1-score. The CNN also enhanced performance (93.1) through the incorporation of visual cues presented by promotional images, whereby spatial and stylistic correlations are captured, which affect the engagement of the audience.
7. Conclusion
This study illustrates that neural networks can offer an innovative analytical system of predicting the success of an exhibition by incorporating a wide range of multimodal data. The proposed MLP-CNN-LSTM model poses a useful effort to capture the nonlinear and dynamic relationships that are not clearly presented by the traditional statistical models by integrating structured operation measures, visual marketing features, and time engagement aspects. The findings highlight the importance of how cultural analytics can be used to transform the ways in which institutions appraise and arrange exhibitions using data. The high predictive accuracy of the model on major metrics such as attendance, revenue, satisfaction, and media impact shows that neural architectures are effective generalisers to various formats of the exhibition and the profiles of the audience. The CNN modules learned visual features of promotional content that are highly expressive as an aesthetic including colour harmony, and popularity to the audience, and the LSTM-based features learned sequential patterns of engagement, including momentum during pre-launch promotions. The MLP layer put these representations together, where promotional efficiency and visitor behavior are connected to quantifiable results. In addition to the accuracy, the paradigm presents a decision-support paradigm to curators, marketers, and policymakers. Proactive insights allow scheduling using data, audience targeting, and optimizing of marketing resources; which enhances cultural coverage as well as financial sustainability.
CONFLICT OF INTERESTS
None.
ACKNOWLEDGMENTS
None.
REFERENCES
Al Mnaseer, R., Al-Smadi, S., and Al-Bdour, H. (2023). Machine Learning-Aided Time and Cost Overrun Prediction in Construction Projects: Application of Artificial Neural Network. Asian Journal of Civil Engineering, 24, 2583–2593. https://doi.org/10.1007/s42107-023-00665-7
Alsugair, A. M., Al-Gahtani, K., Alsanabani, N. M., Alabduljabbar, A. A., and Almohsen, A. S. (2023). Artificial Neural Network Model to Predict Final Construction Contract Duration. Applied Sciences, 13(14), Article 8078. https://doi.org/10.3390/app13148078
Anaraki, M. T., Shamsabadi, A. A., and Pishkar, I. (2024). The Role of Neural Network in Improving Construction Project Scheduling. International Journal of Smart Electrical Engineering, 13, 127–136.
Han, K., Wang, T., Li, C., Xian, X., and Yang, Y. (2025). Construction Cost Prediction Model for Agricultural Water Conservancy Engineering Based on BIM and Neural Network. Scientific Reports, 15, Article 24271. https://doi.org/10.1038/s41598-025-10153-4
Hodson, T. O. (2022). Root-Mean-Square Error (RMSE) or Mean Absolute Error (MAE): When to Use Them or Not. Geoscientific Model Development, 15, 5481–5487. https://doi.org/10.5194/gmd-15-5481-2022
Ji, F., Nan, Y., Wei, A., Fan, P., Luo, Z., and Song, X. (2024). Residential Building Duration Prediction Based on Mean Clustering and Neural Network. Advances in Civil Engineering, 2024, Article 2444698. https://doi.org/10.1155/2024/2444698
Liu, H., Li, M., Cheng, J. C. P., Anumba, C. J., and Xia, L. (2025). Actual Construction Cost Prediction Using Hypergraph Deep Learning Techniques. Advanced Engineering Informatics, 65, Article 103187. https://doi.org/10.1016/j.aei.2025.103187
Marović, I., Androjić, I., Jajac, N., and Hanak, T. (2018). Urban Road Infrastructure Maintenance Planning with Application of Neural Networks. Complexity, 2018, Article 5160417. https://doi.org/10.1155/2018/5160417
Selvanathan, M., Jayabalan, N., Saini, G. K., Supramaniam, M., and Hussain, N. (2020). Employee Productivity in Malaysian Private Higher Educational Institutions. PalArch’s Journal of Archaeology of Egypt / Egyptology, 17, 66–79.
Shihadeh, J., Al-Shainie, G., Bisharah, M., Alshami, D., Alkhadrawi, S., and Al-Bdour, H. (2024). Evaluation and Prediction of Time Overruns in Jordanian Construction Projects Using Coral Reefs Optimization and Deep Learning Methods. Asian Journal of Civil Engineering, 25, 2665–2677. https://doi.org/10.1007/s42107-023-00936-3
Trijeti, R. I., Rahayu, T., and Panudju, A. T. (2023). Artificial Neural Networks for Construction Project Cost and Duration Estimation. Revue d’Intelligence Artificielle, 37, 1449–1460. https://doi.org/10.18280/ria.370609
Velumani, P., Nampoothiri, N. V. N., and U., M. (2021). A Comparative Study of Models for the Construction Duration Prediction in Highway Road Projects of India. Sustainability, 13, Article 4552. https://doi.org/10.3390/su13084552
Yan, Q., Yang, C., and Wan, Z. (2023). A Comparative Regression Analysis Between Principal Component and Partial Least Squares Methods for Flight Load Calculation. Applied Sciences, 13(14), Article 8428. https://doi.org/10.3390/app13148428
Zhang, G., and Zhang, Q. (2024). Building Engineering Cost Prediction based on Deep Learning: Model Construction and Real-Time Optimization. Journal of Electrical Systems, 20, 151–164. https://doi.org/10.52783/jes.1887
Zhang, Y., and Mo, H. (2024). Intelligent Building Construction Cost Optimization and Prediction by Integrating BIM and Elman Neural Network. Heliyon, 10, Article e37525. https://doi.org/10.1016/j.heliyon.2024.e37525
|
|
 This work is licensed under a: Creative Commons Attribution 4.0 International License
© ShodhKosh 2024. All Rights Reserved.