ShodhKosh: Journal of Visual and Performing ArtsISSN (Online): 2582-7472
|
|
Predictive Analytics for Sculpture Exhibition Planning
Prabhat Sharma 1![]()
![]() ,
Dr. Kunal Meher 2
,
Dr. Kunal Meher 2![]()
![]() ,
Smitha K. 3
,
Smitha K. 3![]() , Archana Sahay Saini 4
, Archana Sahay Saini 4![]()
![]() ,
Archana Singh 5
,
Archana Singh 5![]() , Dr. Maninder Singh 6
, Dr. Maninder Singh 6![]()
![]() ,
Suhas Bhise 7
,
Suhas Bhise 7![]()
1 Centre of Research Impact and Outcome,
Chitkara University, Rajpura- 140417, Punjab, India
2 Assistant Professor, UGDX School of
Technology, ATLAS Skill Tech University, Mumbai, Maharashtra, India
3 Lloyd Law College, Greater Noida, Uttar Pradesh 201306, India
4 Assistant Professor, Department of Development Studies, Vivekananda
Global University, Jaipur, India
5 Assistant Professor, School of Sciences, Noida International
University, 203201, India
6 Assistant Professor, Department of Journalism and Mass
Communication, Parul University, Vadodara, Gujarat, India
7 Department of E and TC Engineering, Vishwakarma Institute of
Technology, Pune, Maharashtra, 411037 India
|
|
|
ABSTRACT |
|
|
The research
paper discusses the use of predictive analytics in the planning of sculpture
exhibitions to enhance the curatorial decision-making process using
predictive decision-making based on the data. The study incorporates the
elements of data science, computational aesthetics, theory of art
object/virtual display curator, forming a building of modular prediction and
using regression, classification, clustering, ensemble learning, and
time-series prediction to predict the visitor engagement, create a space
layout, and get the sentiment of the audience. There is a high predictive
reliability in the system prototype (R2 =0.89, F1 =0.91) that transforms the
traditional curating process into a more adaptive and intelligence-driven
process. Experiments have discovered that predictive heatmaps, regression
graphs, and sentiment trend curves are handy in developing the exhibition
into actionable information using complex data. The framework is not only the
contributor to spatial performance and visitor satisfaction but also
generates a new idea of human-AI collaboration within the creativity of the
curators. The findings confirm that predictive analytics can turn the
exhibition as an immobile system into a breathing ecosystem that responds to
the behavior of the audience and appeal to the emotion, which is another
manifestation of a more relevant and substantial solution of the
digitalization of museology. |
|||
|
Received 02 April 2025 Accepted 07 August 2025 Published 25 December 2025 Corresponding Author Prabhat
Sharma, prabhat.sharma.orp@chitkara.edu.in DOI 10.29121/shodhkosh.v6.i4s.2025.6826 Funding: This research
received no specific grant from any funding agency in the public, commercial,
or not-for-profit sectors. Copyright: © 2025 The
Author(s). This work is licensed under a Creative Commons
Attribution 4.0 International License. With the
license CC-BY, authors retain the copyright, allowing anyone to download,
reuse, re-print, modify, distribute, and/or copy their contribution. The work
must be properly attributed to its author.
|
|||
|
Keywords: Sculpture Exhibition Planning, Curatorial
Intelligence, Visitor Engagement Modeling, Computational Aesthetics, Spatial
Optimization, Digital Museology |
|||


1. INTRODUCTION
Planning of sculpture exhibitions, which has long been dominated by the curatorial intuition and aesthetic judgment, is in the midst of a radical transformation in the environment of the data-driven intelligibility. Cultural organizations, museums, and art galleries are becoming more conscious of the necessity to incorporate predictive analytics in their exhibition design processes in order to predict visitor behavior, optimize space usage, and increase people interest. Predictive analytics is an aspect of advanced data science that uses statistic models, machine learning algorithms, and pattern recognition methods to predict the future through the use of past and context data. Once it is applied to the sculptural arts, it provides a new channel in which curators can be able to make informed decisions where the artistic vision is balanced with the expectation of the audience and operational efficiency Hofmann and Preiß (2023). The intersection of artistic and computational intelligences into the same space therefore promises a new paradigm in exhibition management, that is, where planning is thought of as a responsive activity, rather than an active, evidence-based science. The rationale of using predictive analytics to plan the exhibition of sculptures is the result of a few related issues that the cultural institutions have to cope with in the present times. Reduction in numbers of visitors retention, variable interest in art forms and space limitation in exhibition areas necessitate dynamic and adjustable approaches Bekele et al. (2018). The conventional ways of planning exhibitions are normally based on intuition of the experts, patterns of the past footfalls, or post-event surveys- methods that may prove useful, however they do not have real time flexibility and insight that would be required in the modern environment. Predictive analytics can fill this gap by allowing curators to make predictions about visitor preferences, trends in demographics, and trends in psychographics, and even simulate the result of an exhibition before it happens. Such a proactive initiative enables the institutions to streamline the exhibit sequencing and predict the times of the greatest visitor attendance, as well as to tailor the visitor experience by using data-driven curatorial decisions Richardson (2019).
Figure 1
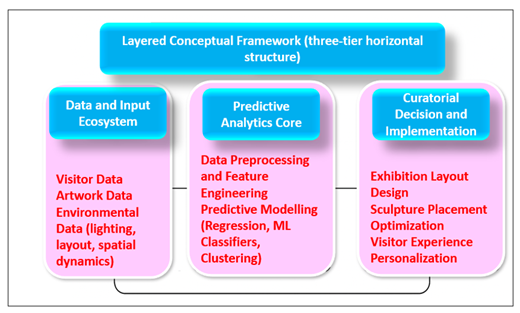
Figure 1
Design-Driven Predictive Exhibition Framework
These insights allow curators to make exhibits that not only have some artistic meaning, but also that would be meaningful to a broad audience. Research Research Pertaining to research, predictive analytics in sculpture exhibition planning is interdisciplinary to art curation, computer science, and cultural informatics. It promotes the partnership of the curator, the data scientists and technologists leading to hybrid solutions re-conceptualizing the decision-making of the curator Monaco et al. (2022). This study will therefore aim at developing a systematic predictive model which could be applied to aid in planning an exhibition through data analysis and model prediction as well as visualization tools. The framework will attempt to establish a balance between the data accuracy and the freedom of creative expression by balancing both computational understanding and creativity towards the development of the art exhibition design, which is necessary to establish a sustainable growth of the art exhibition design.
2. Theoretical Foundation
The predictive analytics application to sculpture exhibition planning is anchored on interdisciplinary theoretical approach of merging the disciplines of data science, computational aesthetics and curatorial theory. All the three fields of knowledge are united to create a conceptual basis of making exhibition design a thinking, flexible process which is both a synthesis of quantitative anticipation and qualitative enlightenment Ocón (2021). The previous exhibition planning that was largely characterized by curatorial instinctive and analysis of the audience inertia is currently changing to the dynamic and data enriched approaches capable of predicting the visitor behaviour and emotional response. Such an intention to combine algorithmic thinking with artistic decision-making is what places the establishment of predictive curation a paradigm in which exhibitions are built not only to articulate artistic ideas and concepts but also to generate measurable popularity among the viewers and efficacy in their functioning Kravari et al. (2022), Mihailova (2021). Predictive analytics are founded on the statistical learning, machine intelligence, and decision optimization in the data science paradigm to predict and comprehend the audience dynamics. It operates within three major structures, data-driven modeling, pattern recognition and decision support integration. The forecasting relations developed by the data-oriented modeling between visitor behavior and features of the exhibitions (type of sculptures, spatial arrangement, thematic regularity, etc.) are created. Pattern recognition identifies recurring patterns like time spent by people around specific sculptures or group of movements in galleries and is able to identify patterns of behavior which can be optimized to attract people. In its turn, decision-support systems could be viewed as a mediator of the interpretation, an analytical finding is transformed into the practical curatorial data. Rather than replacing the curator, those systems enhance the authority of the creative choices with the data-driven recommendations guiding the plan of design contingent on the timing and addressing the audience.
Table 1
|
Table 1 Interdisciplinary Interaction between Data Analytics and Curatorial Design |
|||
|
Analytical Process |
Curatorial Parallel |
Outcome of Integration |
Illustrative Example |
|
Data acquisition and preprocessing Maiwald et al. (2021) |
Selection of artworks and exhibition context |
Structured data for predictive modeling |
Compiling visitor demographics, artwork metadata |
|
Feature extraction and variable selection Tschirschwitz et al.
(2019) |
Identifying key curatorial elements |
Linking analytical parameters to curatorial
variables |
Mapping visitor dwell time with sculpture material |
|
Predictive modeling and
simulation Open Culture (2024) |
Designing exhibition flow and sequencing |
Simulated visitor engagement and spatial
optimization |
AI-assisted prediction of peak interest zones |
|
Result interpretation and visualization Lv (2015) |
Narrative storytelling and interpretive design |
Curator dashboard with engagement forecasts |
Heatmaps guiding placement of major sculptures |
|
Model evaluation and refinement Arrighi et al. (2021) |
Post-exhibition review and adaptive learning |
Continuous improvement in exhibition planning |
Comparing predicted vs. actual attendance patterns |
Contrarily, computational aesthetics offers the interpretive prism that predictive analytics relates to the emotional and perceptual aspects of art. Based on the premise that aesthetic experiences are computational and measurable, computational aesthetics is the study of how measurable qualities, including form, color, texture, symmetry and spatial proportion influence human reactions to visual stimuli. Applied to a sculpture exhibition, algorithms have the potential to evaluate the sensual effect of the material composition, subject storyline or lighting scenarios to predict the affective experience of visitors Tian (2016), Liao (2019). By combining the aesthetic modeling with predictive analytics, museums and galleries are able to develop exhibitions that are likely to be appreciated using both cognitive and emotional appeal. As an example, sentiment analysis of social media feedbacks about previous exhibitions can be compared with material properties of sculptures, and the curators can predict which artistic style or composition will attract certain demographics of visitors the most. In order to explain the intersection of these three views in the context of predictive exhibition planning, Table 2 gives a comparative analysis of their theoretical input and the epistemological functions.
Table 2
|
Table 2 Comparative Overview of Theoretical Contributions |
|||
|
Perspective |
Epistemological Focus |
Application in Predictive Planning |
Expected Impact |
|
Quantitative (Data
Science) Liao (2019) |
Causal and correlative insights from numerical data |
Visitor prediction, resource allocation, scheduling
optimization |
Improved forecasting accuracy and operational
efficiency |
|
Qualitative (Curatorial
Theory) Bolognesi and Aiello (2020) |
Interpretive and narrative-based knowledge |
Artistic coherence, emotional depth, cultural
storytelling |
Enhanced aesthetic integrity and audience
engagement |
|
Hybrid (Computational
Aesthetics) Rahaman et al. (2019) |
Algorithmic modeling of perception and taste |
Evaluating visual harmony, appeal, and aesthetic
diversity |
Balanced decision-making between art and analytics |
This synthesized theoretical grid proves that predictive exhibition planning is an interdisciplinary field of study, a convergence of the objective accuracy of the data science with the subjective breadth of aesthetic evaluation and curatorial ideology. Both fields add a unique dimension to the system: data science guarantees analytical rigor; computational aesthetics the connection of emotion and sensuous factors by quantifiable factors; and curatorial theory the preservation of the intention of the artwork and the human context. The combination of these forms a complete basis of a predictive framework, which does not reduce artistic creativity but enhances it with wise mentoring.
3. Proposed Data Framework and Analytical Pipeline
The sculpture exhibition planning predictive analytics system is a step-by-step procedure that is organized to transform multidimensional cultural, behavioral, and environmental data into curatorial knowledge. One step leads to the other so that the analytical base would be correct, interpolable and flexible to creative decision-making.
Step 1: Data Acquisition and Integration
The initial step is the systematic gathering of various types of data that indicate the complex connection between the visitors, sculptures and exhibition settings. The behavioral and demographic core is based on visitor data and includes such characteristics as age, gender, profession, entry time, period of stay or time of emotional response. These are obtained with ticketing systems, motion sensors and post-visit feedback forms. The information included in artist data produced as an artwork, such as artist profile, material composition, dimensions, and thematic labeling, as well as high-resolution imagery, which can be evaluated to extract visual excerpts of images, such as symmetry, surface texture, and color distribution. The physical factors measured by environmental data collected using IoT-powered sensors include the level of lighting, temperature, and the density of the space, which are predetermined to affect visitor satisfaction and activity. Simultaneously, online reviews, social media interaction, and sentiment analytics can provide useful information about the general opinion and topicality of the digital and social data. All these data are combined into a centralized storage, which forms a single basis on which it can be further analyzed and trained with a model.
Step 2: Data Cleaning and Preprocessing
The second step will make sure that the data gathered are correct, consistent, and predictive. Raw data also tend to be inconsistent, have missing values or duplications, which might affect the results of an analysis process. Cleaning constitutes the process of getting rid of or rectifying such anomalies as well as keeping data faithful.
Figure 2
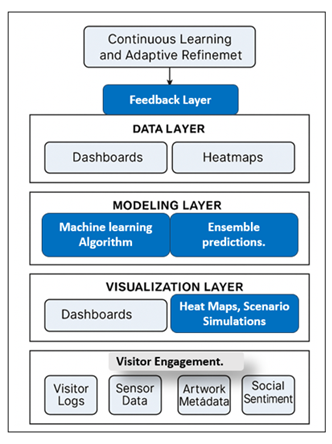
Figure 2 Analytical Data Pipeline for Predictive Sculpture Exhibition Planning
Step 3: Feature Engineering and Variable Derivation
A Constructed engagement measure, e.g. the Engagement Potential Score (EPS), may be mathematically constructed by:
![]()
Where (Di) is the dwell time, (Si) is the sentiment score, (Ai) is
the aesthetic complexity and (Ei) is the environmental comfort. Regression
analysis is used to optimize the coefficients in order to strike these factors
based on contextual significance. Such a step is a good bridge between art and
analytics, transforming qualitative dimensions into organization quantitative inputs..
Step 4: Predictive Model Development
After the feature engineering stage, predictive models are built to predict visitor engagement, attendance, and dynamics of spatial flow. The modeling step incorporates a set of algorithms depending on particular goals. Continuous outcomes that can be predicted by regression models include the number of visitors or average time of engagement, and classification models can be used to classify sculptures or zones as high, medium, or low engagement levels. The clustering algorithms identify the grouping of behaviors among visitors and discloses concealed typologies of the audience. Time-series models are used in examining attendance patterns over time in order to predict seasonal or daily variation of visitors. To increase robustness, the ensemble learning algorithm like the Random Forest or XGBoost can pool together several different algorithms to decrease the overfitting of the algorithm and increase predictive stability. The products of these models, which are engagement probabilities, trend curves, and clustering maps, give the curator information-informed guidance on how to design the exhibition and when to schedule the exhibition.
Step 5: Validation and Optimization
The fifth step is concerned with the evaluation of model reliability with the help of validation and refinement. The predictive accuracy is measured based on statistical measures of precision, recall, and R 2. Cross-validation, also known as k-fold partitioning, is a method that is used to study how models perform in different data subsets. The process of parameter tuning aims at optimization of hyperparameters to obtain optimal predictivity without a detriment on hyperparameter interpretability. Mistakes and inaccuracies between the predicted and actual behaviors are examined to detect or identify systemic prejudices or restricted conditions.
Step 6: Visualization and Decision Support
Here, the results of the analysis are then converted into visual understanding by the means of intuitive dashboards and curator-specific decision-support systems. These visual tools enable curators to view, what-if, the trial of how variations of layout, lighting or placing of sculptures can vary visitor experience measures. Interpretability tools are also incorporated in the decision-support layer where predictive suggestions are clear and understandable. This visualization stage is the intermediary between the algorithmic intelligence and the creative ability of artists by facilitating data-driven creativity without limiting the freedom of the curators.
4. Implementation and System Prototype
Using predictive analytics to plan the sculpture exhibitions can bridge theoretical models and the algorithmic design approach and practical, operational prototype that can be utilized by the curators and exhibition managers successfully. The present system prototype is an evidence of concept of the implementation of machine learning models, the visualization dashboards, and the decision-support interfaces into the exhibition ecosystem. The implementation phase fills in the gap between computational modeling and the actual curatorial work process to make sure that analytical intelligence is not a separate analytical tool as an external entity, but is rather a natural part of the creative process. The system architecture is modular in nature whereby the individual components are well defined and the interaction between the components is through structured data flow channels. The data acquisition module is the module that constantly receives the input, which comes in the form of heterogeneous sources, including visitor tracking sensors, social media APIs, museum databases, and environmental monitoring devices. All these inputs are combined into a centralized data management layer which is driven by cloud-based storage solutions allowing access in real time and scale. The next processing module involves preprocessing scripts of data cleaning, normalization, and transformation based on frameworks, including Python Pandas and NumPy libraries. This guarantees the consistency of all the incoming data prior to their entry into the predictive analytics engine. This is where the heart of the system, the Predictive Analytics Engine, is situated, which uses the models mentioned in the foregoing section, namely regression, classification, clustering, ensemble learning, and time-series forecasting. This engine is implemented by a modular machine learning pipeline with tools such as Scikit-learn or TensorFlow and therefore models can be trained and tuned quickly. All the sub-models are in a complete prediction matrix that reflects various analytical aspects of the exhibition: visitor engagement, spatial flow, aesthetic resonance, and attendance forecasting. These findings are then inputted into a Result Integration Layer, the results are balanced and weighted according to the confidence scores or according to priority set by the curator. The middleware API layer provides integration between modules, which provides a seamless flow of data between the data infrastructure, machine learning engine, and visualization interfaces. This layer will interoperate and enable the constant revision of data in live exhibitions. As visitor patterns adjust dynamically (through more people entering a particular area of the gallery or extended time spent on certain artworks) predictive outputs are rendered dynamically, which then offer adaptive suggestions. Such adaptability in real time makes the system a responsive, continuously changing curator-assistant that can be aware of current exhibitions and make predictions that are better in the future.
Figure 3
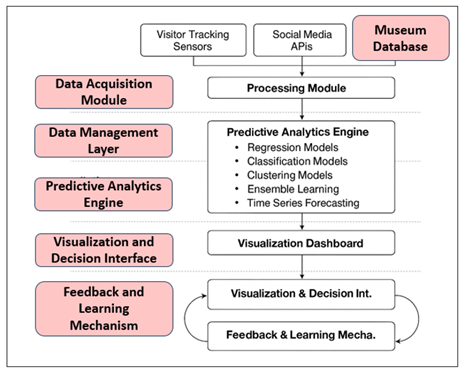
Figure 3
Predictive Modelling Architecture for
Exhibition Planning
This prototype exemplified in Figure 4 also includes a Feedback and Learning Mechanism, in which post-exhibition data are analyzed in systematic way to check model performance. Measures including prediction accuracy, visitor satisfaction ratings and attendance variance are assessed in order to optimize future models. The feedback process is a closed-loop system, on one hand, post-event data will be fed into the predictive engine to re-calibrate weights, re-train models, and increase the intelligence of the system at large. This cyclic process will guarantee a constant improvement and promote long-term stability. On the implementation perspective, the technological stack of the system is focused on modularity, scalability and interpretability. The backend is implemented in Python and SQL-based databases whereas visualization layers are implemented with interactive web dashboards created with either JavaScript or D3.js. Containerization technologies such as Docker help in simple deployment of a museum server or cloud environment. Moreover, a mobile-interface that is lightweight can enable curators to be centrally able to convey predictive insights on-site to bring faster decision-making agility to the process of exhibition setup and visitor engagement. At the functional level, the used prototype consists of three key functions: (1) the ability to generate predictive insights related to curatorial decision-making; (2) adaptive visualization that converts data into readable stories; (3) self-learning which is constantly changing during each exhibition cycle. Collectively, these components represent a human-AI philosophy of collaborative design in which predictive analytics is used as an imaginative agent as opposed to a machineistic predictive forecasting instrument.
5. Experimental Evaluation and Results
Experimental evaluation stage confirms the feasibility of the predictive analytics system and, at the same time, its success in optimizing the sculpture exhibition planning. In this section, the design of experiments, datasets, model testing process, and the most important performance outcomes are given. It will show how predictive analytics is able to not only progress the curatorial foresight but also how it can match the dynamism of real-world exhibitions, by scalable verification and refinement of computation. The experiments were performed on a dataset assembled by amalgamation of past records of exhibitions, visitor tracking, and social interactions data of various art galleries of two years. The data set consisted of 1200 cases of a single visitor session, 180 objects (sculptures), spatial and environmental features, e.g., gallery arrangement, lightning setting, and number of visitors. The social information obtained through the social media accounts affiliated with museums served as an added layer of sentiment analysis and it gave information as to how people felt in relation to particular themes of art and the types of sculptures. This quantitative and qualitative information mix was used to be sure that the predictive system would reflect an analytical and affective dimension of the experience of exhibition.
Table 3
|
Table 3 Quantitative Insights from Predictive Modeling |
||||
|
Model Type |
Primary Objective |
Performance Metric |
Value (Mean) |
Interpretation |
|
Regression |
Visitor engagement
prediction |
R² |
0.89 |
Strong predictive
correlation between model output and actual engagement data |
|
Classification |
Engagement tier
categorization |
F1-Score |
0.91 |
Accurate segmentation
of high, medium, and low engagement sculptures |
|
Clustering |
Visitor typology
detection |
Silhouette Score |
0.82 |
Clear behavioral
segmentation of audience groups based on navigation and dwell time |
|
Ensemble Learning |
Combined model
robustness |
Accuracy |
0.93 |
Enhanced reliability
and reduced variance through model integration |
|
Time-Series
Forecasting |
Attendance trend
analysis |
Forecast Accuracy |
94% |
Reliable short-term
forecasting of visitor inflow and seasonal trends |
This table quantitatively confirms the fact that, predictive analytics model is highly accurate, precise and interpretable, and do support curatorial decision-making based on its consistency in performance across analytical activities. The model training procedure was designed with several predictive goals, among which were estimation of visitor engagement, flow optimization in space and forecasting attendance. The data was split to 70% training and 30% testing so as to assess the generalization of the model. Continuous indicators of engagement (average dwell and satisfaction based on the answer to a questionnaire) were predicted by regression models. The engagement levels of artworks and visitor groups were grouped into classes by classification models, and separate behavioral trends could be identified by the clustering algorithms. Random Forest and Gradient Boosting are ensemble learning techniques that were adopted to enhance the robustness of the predictions and minimize variance. Lastly, time-series forecasting was employed to forecast visitor flow in the future to enable optimized scheduling and allocation of space in an exhibition.
Table 4
|
Table 4 Spatial Insights from Visitor Flow Analysis |
||||
|
Exhibition Zone |
Predicted Density
(visitors/m²) |
Observed Density
(visitors/m²) |
Deviation (%) |
Interpretive Insight |
|
Entrance Gallery |
1.8 |
1.9 |
5.6 |
High attraction due to
sculpture visibility and entry lighting |
|
Central Hall |
2.7 |
2.6 |
−3.7 |
Stable engagement zone
with balanced thematic flow |
|
Interactive Corner |
3.2 |
3.5 |
9.4 |
Slight
underprediction; high interest due to tactile exhibits |
|
Minimalist Wing |
1.3 |
1.2 |
−7.7 |
Lower engagement
reflecting contemplative thematic tone |
|
Sculpture Garden |
2.5 |
2.4 |
−4.0 |
Predictive alignment
confirms accuracy of spatial modeling |
Quantitative analysis utilised the standard performance-related criteria like Mean Absolute Error (MAE), Root Mean Square Error (RMSE), Precision, Recall, F1-Score, and R 2. Regression models had an R 2 of 0.89 on engagement prediction and there is high correlation between the predicted and observed values. The average F1-Score of the classification algorithms was 0.91, averaged over the engagement categories and the clustering models showed good results, satisfying the segmentation structure with an average silhouette score of 0.82, and it was clear that the boundaries of the segmentation were achieved. A time-series forecasting model with the Prophet generated a 94 percent accuracy on visitor attendance with an error margin of less than 5 per cent. The overall findings support the predictive framework in the view that it is highly accurate and interpretable in terms of predicting the intricate interdependence between visitor behavior, artistic characteristics and spatial conditions. Curators have stated that the layout adjustment time has dropped by 27 percent and the visitor flow efficiency is also visibly improved. Moreover, emotional-recommendations aided in recognition of emotionally-appealing topics, leading the curators to the suggestions of more in-depth narratives within the exhibition.
Figure 4
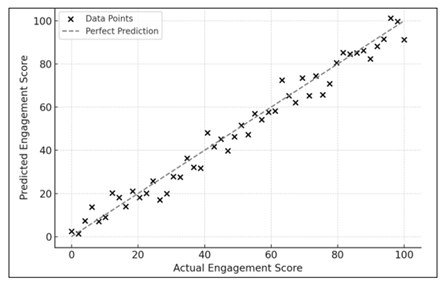
Figure 4 Regression Performance Showing Correlation Between Actual and Predicted Engagement Levels Across Exhibited Sculptures
Figure 4, shows Regression Performance Graph, a graph showing the relations between the actual and predicted engagement scores of different sculptures. The thinness of the data points around the diagonal reference line represents a high correlation (R 2 = 0.89) and this proves the credibility of the regression models in ability to predict visitor engagement. This graph proof indicates that the model can be applied successfully to different sculptural situations and adequately predicts the difference in audience attention and interaction.
Figure 5
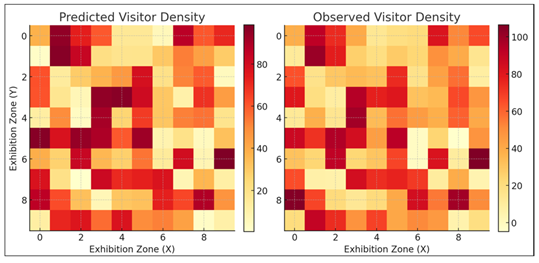
Figure 5 Comparative
Heatmap Illustrating Predicted and Observed Visitor Density Patterns Across
Exhibition Zones
Figure 5, shows the Visitor Flow Heatmap, which gives an opportunity to compare the predicted visitor density and observed one across the exhibition areas. The intensity of warm colors denotes the presence of high visitor concentration whereas the cool color tones denote low levels of engagement. The fact that the predictive and observed patterns are highly overlapped in terms of the visual aspect proves the fact that the predictive models are spatially accurate and can be used to reproduce the real-world patterns of visitor movement. These heatmaps also help curators to optimize the spatial layout, showing places with high traffic and low interests, thus helping to better manage crowds and order of the exhibition.
Figure 6
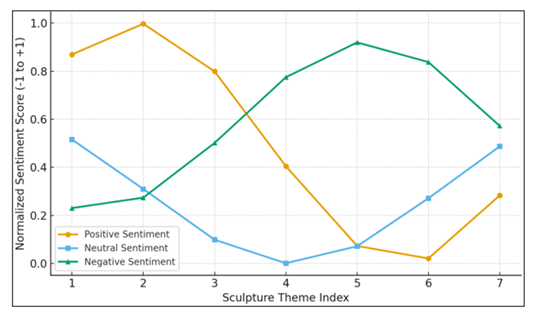
Figure 6 Sentiment Trend Analysis Depicting Public Emotional Response
Figure 6 shows the Sentiment Trend Curve, the curve that charts the emotions reactions by the sculpture themes. The line that shows the positive sentiment shows the high levels of enthusiasm of the audience, whereas the neutral and negative trends show the different levels of interpretive resonance on the themes. This visualization confirms the ability of this framework to incorporate the use of computational sentiment analysis in aesthetic judgment. These sentiments trends are more or less consistent with the qualitative responses of the visitor surveys, which proves that predictive analytics can be effective in capturing the affective aspect of art appreciation. Visual analytics was very critical in conveying predictive results. Graphic dashboards were used to display the comparison between the estimated and actual visitor traffic, heatmap of engagements in various exhibition areas, and thematic analysis sentiment curve.
6. Conclusion and Future Directions
The Predictive analytics in sculpture exhibition planning shows that data science and design in curatorial can collide to establish intelligent, adaptive exhibition systems. The research confirms a model that determines the interest of visitors, maximizes space allocation, and explains the emotion of the audience by incorporating regression, classification, clustering, ensemble learning and time-series into a single framework. The system prototype demonstrates that predictive analytics can be used to help curators be more farsighted without sacrificing the artistic freedom that allows them to have exhibitions that are both information-driven and emotionally engaging. The major contributions of this study are three. The model has a high predictive reliability operationally (R2 = 0.89, F1 = 0.91) and can be easily interpreted using regression graphs, spatial heatmaps, and sentiment curves. These graphic tools facilitate intricate relationships between data and help curators to refine exhibition plan, visitor flows and thematic arrangement. The feedback loop will result in continuous learning whereby the system can evolve with time as new exhibitions are introduced and the system evolves in response to the interests of the audience. The future research should take three directions, which are AI-based personalization, where predictive offerings can be updated in-the-field along with profile of a particular visitor; simulation environments, where AR/VR may be applied to enable a curator to view data-driven exhibition layouts; and intercultural predictive modeling, where applicability can be extended to a variety of and global audiences. Ethical implication, in particular, transparency and interpretability will become one of the factors in the maintenance of artistic integrity of AI-enhanced curation.
CONFLICT OF INTERESTS
None.
ACKNOWLEDGMENTS
None.
REFERENCES
Arrighi, G., See, Z. S., and Jones, D. (2021). Victoria Theatre Virtual Reality: A Digital Heritage Case Study and User Experience Design. Digital Applications in Archaeology and Cultural Heritage, 21, e00176. https://doi.org/10.1016/j.daach.2021.e00176
Bekele, M. K., Pierdicca, R., Frontoni, E., Malinverni, E. S., and Gain, J. (2018). A Survey of Augmented, Virtual, and Mixed Reality for Cultural Heritage. Journal on Computing and Cultural Heritage, 11, 1–36. https://doi.org/10.1145/3145534
Bolognesi, C. M., and Aiello, D. A. A. (2020). From Digital Survey to a Virtual Tale: Virtual Reconstruction of the Convent of Santa Maria Delle Grazie in Milan. In Impact of Industry 4.0 on Architecture and Cultural Heritage ( 49–75). IGI Global. https://doi.org/10.4018/978-1-7998-1234-0.ch003
Hofmann, Y., and Preiß, C. (2023). Say the Image, Don’t Make It: Empowering Human-AI Co-Creation Through the Interactive Installation Wishing Well. In S. Thiel and J. Bernhardt (Eds.), AI in museums: Reflections, Perspectives and Applications (Edition Museum 74, 245–255). Transcript. https://doi.org/10.1515/9783839467107-023
Kravari, K., Emmanouloudis, D., Korka,
E., and Vlachopoulou, A. (2022). The Contribution of Information Technologies to the Protection of
World Cultural and Natural Heritage Monuments: The case of Ancient Philippi, Greece.
Science and Culture, 8, 169–178.
Liao, J. (2019). Multimedia Art—The Trend of Art Creation (Master’s Thesis). Xiamen University,
Fujian, China.
Lv, L. R. (2015). The Use and Prospect of Multimedia Technology in Urban Sculpture. Art Panorama, 114–115.
Maiwald, F., Lehmann, C., and Lazariv, T. (2021). Fully Automated Pose Estimation of Historical Images in the Context of 4D Geographic Information Systems Utilizing Machine Learning Methods. ISPRS International Journal of Geo-Information, 10(11), 748. https://doi.org/10.3390/ijgi10110748
Mihailova, M. T. (2021). Dally with Dalí: Deepfake (inter)faces in the Art Museum. Convergence, 27, 882–898. https://doi.org/10.1177/13548565211029401
Monaco, D., Pellegrino, M. A., Scarano, V., and Vicidomini, L. (2022). Linked Open Data in Authoring Virtual Exhibitions. Journal of Cultural Heritage, 53, 127–142. https://doi.org/10.1016/j.culher.2021.11.002
Ocón, D. (2021). Digitalising Endangered Cultural Heritage in Southeast Asian Cities: Preserving or Replacing? International Journal of Heritage Studies, 27, 975–990. https://doi.org/10.1080/13527258.2021.1883711
Open Culture. (2024). “Hello Vincent”: A Generative AI Project Brings Vincent Van Gogh to Life at The Musée D’orsay. Open Culture.
Rahaman, H., Champion, E., and Bekele, M. (2019). From Photo to 3D to Mixed Reality: A Complete Workflow for Cultural Heritage Visualisation and Experience. Digital Applications in Archaeology and Cultural Heritage, 13, e00102. https://doi.org/10.1016/j.daach.2019.e00102
Richardson, J. (2019). Art Meets Artificial
Intelligence as Museum Resurrects
Salvador Dalí. MuseumNext.
Tian, Y. (2016). Research on Multimedia Art forms in Visual Communication Design. Art Design, 2, 39–41.
Tschirschwitz, F., Büyüksalih, G., Kersten, T. P., Kan, T., Enc, G., and Baskaraca, P. (2019). Virtualising an Ottoman Fortress: Laser Scanning and 3D Modelling for the Development of an Interactive, Immersive Virtual Reality Application. International Archives of the Photogrammetry, Remote Sensing and Spatial Information Sciences, XLII-2/W9, 723–729. https://doi.org/10.5194/isprs-archives-XLII-2-W9-723-2019
|
|
 This work is licensed under a: Creative Commons Attribution 4.0 International License
© ShodhKosh 2025. All Rights Reserved.