ShodhKosh: Journal of Visual and Performing ArtsISSN (Online): 2582-7472
|
|
Data-Driven Analysis of Visual Composition Patterns
Dr. M V Madhusudhan 1![]()
![]() ,
Richa Srivastava 2
,
Richa Srivastava 2![]() , Sumeet Singh Sarpal
3
, Sumeet Singh Sarpal
3![]()
![]() , Dr. Syed Sumera Ali 4
, Dr. Syed Sumera Ali 4![]() , Shailendra Kumar
Sinha 5
, Shailendra Kumar
Sinha 5![]()
![]() ,
Shikhar Gupta 6
,
Shikhar Gupta 6![]()
![]()
1 Associate
Professor, Department of Computer Science and Engineering, Presidency
University, Bangalore, Karnataka, India
2 Assistant
Professor, School of Business Management, Noida International University,
Greater Noida, Uttar Pradesh India
3 Centre of Research Impact and
Outcome, Chitkara University, Rajpura, Punjab, India
4 Associate Professor, Department of
Electronics and Communication, CSMSS Chh. Shahu College of Engineering, Chhatrapati
Sambhajinagar (Aurangabad), MH, India
5 Assistant Professor, Department of
Computer Science and IT, ARKA JAIN University Jamshedpur, Jharkhand, India
6 Chitkara Centre for Research and
Development, Chitkara University, Himachal Pradesh, Solan, India
|
|
|
ABSTRACT |
|
|
The paper
provides an elaborate, data-driven approach to visual composition analysis of
artistic, photographic, and design-based imagery. Conventional compositional
ideals, including spatial balance, color harmony, Gestalt grouping, and
narrative organization, are converted to quantifiable computational aspects
using sophisticated image processing, perceptual modeling, as well as machine
learning methods. With the incorporation of the feature-extraction,
saliency-analysis, edge-orientation mapping, color-harmony measures, and
object-position density modeling, the research findings indicate that the
patterns of visual compositions are statistically significant and cross-cut
across the genres and across the ages. Clustering and dimensionality
reduction of patterns are additional ways of mining latent patterns,
stylistic relationships, and trends of evolution hidden within large volumes
of data. The framework has high interpretability based on the visual
analytics using PCA-based feature embeddings, aggregated saliency heatmaps,
line-orientation histograms, radar charts of chromatic attributes, and
spatial distribution maps. Results indicate that composition is not
intuitively or stylistically defined, but an empirically quantifiable
structure, which can be used to improve creative pedagogy, computational
aesthetics, and AI-mediated design systems. This piece of art defines a new
analytical mode of approach, which crosses the boundary of artistic theory
and machine intelligence, providing innovative conclusions on the role of
compositional logic in the construction of perception and creative
expression. |
|||
|
Received 19 February 2025 Accepted 13 May 2025 Published 16 December 2025 Corresponding Author Dr. M V
Madhusudhan, madhusudhanmv@presidencyuniversity.in
DOI 10.29121/shodhkosh.v6.i2s.2025.6727 Funding: This research
received no specific grant from any funding agency in the public, commercial,
or not-for-profit sectors. Copyright: © 2025 The
Author(s). This work is licensed under a Creative Commons
Attribution 4.0 International License. With the
license CC-BY, authors retain the copyright, allowing anyone to download,
reuse, re-print, modify, distribute, and/or copy their contribution. The work
must be properly attributed to its author.
|
|||
|
Keywords: Visual Composition, Image Analytics, Clustering,
Saliency Modeling, Color Harmony, Spatial Structure, Gestalt Principles,
Visual Perception, Computational Aesthetics, Pattern Mining, Visual
Creativity |
|||

1. INTRODUCTION
Visual composition has occupied a central place in the creative practices of artists, designers and photographers since it dictates how these artists, designers or photographers organize images to create emotional, aesthetic and cognitive effects. Although the principles of composition have long existed in the conventional art theory, including balance, symmetry, spatial hierarchy, and color harmony, the current developments in the digital content production, image analytics, and computational modeling resulted in a paradigm shift of how these visual patterns may be perceived, measured, and optimised Rozovsky (2021). The revolutionary increase in digital imagery on social media, design sites, and online art archives has created previously unheard of possibilities to examine composition at scale, identify underlying rules in style patterns and emergent trends that previously could be extremely challenging to explore on a case-by-case basis Duxbury (2021). Facts-based research can now help researchers to leave the subjective assessment behind and discover quantifiable and repeatable informational measures of the influence of visual layouts on user perception, esthetic preference, and creativity. This shift in the intuitively-based composition to computationally-based frameworks is changing design education, creative industries, and content generation systems based on AI López-Belmonte et al. (2020). With machine learning and computer vision methods slowly making their way into creative processes, it is necessary to learn more about visual composition based on structured data. Current algorithms are able to compute spatial geometry, identify visual saliency, encode color distributions and analyze structural regularities in millions of images. These computer-based understanding complement and at other times contradict classical theory of art by providing alternative views on what makes up an effective or compelling composition. Additionally, the neural networks that were trained with large-scale images have acquired implicit composition rules without explicit labels that artistic composition may exhibit recurring statistical patterns Quinn (2020). Clustering techniques, feature extraction, cross genre comparison have allowed scholars to now articulate how composition is different between the work of classical painting, modern photography, graphic design, cinematic framing, and digital illustration.
The paper is an inquiry into how the data-driven methods can advance the knowledge of visual composition patterns by incorporating image analytics, computational modeling and cross-disciplinary assessment. The goal is not only to investigate composition as an intuition of the creative level, but as an objective phenomenon incorporated into visual data Durga and Jeyaprakash (2019). Using computational methods, scholars are able to encode compositional qualities, reveal unseen visual patterns, and recognize novice patterns across periods and genres of art. These lessons are of significant value in present-day settings where AI-driven systems produce or evaluate creative work, and design education is becoming more and more heavily based on the concepts of computational thinking. In conclusion, this paper proves that data composition analysis is the solution to the problem of bridging the gap between artistic theory and machine intelligence and the perspective presented provides a hybrid approach to respecting the traditional practice and enhancing the development of creative systems.
2. Conceptualizing Visual Composition in Creative Disciplines
Visual composition involves the expressive formation of visual images through the controlled composition of visual elements like lines, shapes, texture, color and the relationship between space to guide perception and develop expressive meaning. In areas of creative work such as fine arts, photography, architecture, film and graphic design, composition serves as a structural basis that determines aesthetic unity, narrative decipherability and emotional involvement. In the past composition principles such as the rule of thirds, the golden ratio, symmetry, leading lines, framing and visual balance have been used in interpreting composition. These were established principles that were traditionally taught by observation, critique and through apprenticeship an artistic practice that was intuitive and interpretive. The visual space was organized according to the cultural norms, stylistic movements and personal sensibilities by artists, resulting in the variety of the compositional styles, which were used by artists at different time and place Adeyemo et al. (2018). Nevertheless, the notion of composition is much more multi-dimensional than a list of rules; it is a process of interaction between perceptual psychology, visual cognition, cultural symbolism and creative trial. Composition in photography is what determines the way a viewer will interact with a photograph; where the photo focuses attention in the form of focal points, contrast gradients, and emphasis of space. In illustration and painting, composition is used as a storytelling structure, determining the way that narratives are told in terms of placement, rhythm, and visual rhythm. Composition allows graphic designers to balance typography, imagery, and whitespace, in order to control communication and user flow Jansen et al. (2022). In a variety of fields, composition as a system of visual reasoning determines the way of meaning construction, meaning interpretation and experience of meaning. Visual composition has gone digital and is now a field of motion graphics, UI/UX design, augmented reality, and algorithmic art which has only added to its relevance. These emerging fields demand responsive and changing compositional systems to interaction, screen fluctuation and live image display.
Table 1
|
Table 1 Computational Features for Composition Mapping |
||||
|
Feature
Category |
Description |
Extraction
Methods |
Representation
Format |
Why
It Matters |
|
Spatial
Geometry Giomelakis and Veglis (2015) |
Grid
structure, symmetry, horizon, depth cues |
Edge
detection, Hough transforms |
Coordinates,
spatial vectors |
Determines
balance and viewer attention |
|
Color Harmony Church et al. (2021) |
Dominant hues, saturation,
contrast |
Histograms, LAB color models |
Color clusters |
Influences mood and
emotional tone |
|
Gestalt
Grouping Nicolaou et al. (2024) |
Proximity,
similarity, continuity |
Segmentation,
contour grouping |
Region
graphs |
Governs
structural coherence |
|
Saliency and Focus Dearn and Price (2016) |
Viewer-attention heatmaps |
Saliency networks, CAMs |
Heatmaps, saliency scores |
Predicts perceptual
engagement |
|
Narrative
Elements Craig et al. (2021) |
Subject
relations and context |
Object
detection, pose estimation |
Scene
graphs |
Reveals
storytelling patterns |
In particular, a data-driven viewpoint provides a chance to redefine composition not simply as an artistic intuition but as an emergent characteristic of the large-scale patterns of visual composition. Composition in this extended sense is measurable and even comparable, and the cross-disciplinary knowledge is based on the statistical distribution, and not aesthetic speculation. A study into Computer vision indicates that the human visual attention becomes concentrated in similar geometrical regions implying compositional universals Dalton (2013). Machine learning models will find common relationships between foreground and background or common color harmonies in certain styles. With the increasing prevalence of creative AI systems, it has been shown that as the systems gain internalization and compositional coherent image generation capabilities, it becomes possible to learn visual structure on an algorithmic basis through exposure to large bodies of data. As a result, visual composition is developing to be a qualitative construct into a hybrid framework that combines artistic tradition and computational analysis.
3. Data Sources for Studying Composition Patterns
Research into the patterns of visual composition depends on a variety of data, and the data falls under artistic, photographic and digital media ecosystems. Big collections of images like ImageNet, COCO, Open Images and Art Bench provide annotated millions of images, which can be evaluated to acquire spatial, geometric and tonal structure. Often these datasets are accompanied by metadata like artist, date, style, technique and subject matter, and then one can compare compositional decisions with cultural and stylistic backgrounds.
Table2
|
Table 2 Overview of Key Datasets Used for Composition Analysis |
||||
|
Dataset
Name |
Domain
/ Media Type |
Size
and Diversity |
Composition-Relevant
Attributes |
Typical
Use Cases |
|
WikiArt |
Historical
paintings, fine arts |
80k+
artworks, 25+ styles |
Color
palettes, symmetry, strokes, spatial layout |
Style
analysis, art history comparison |
|
COCO |
Natural images, photography |
330k images |
Object bounding boxes,
spatial relations |
Object-based composition
mapping |
|
OpenImages |
Mixed
creative and real-world images |
9M+
images |
Saliency
regions, hierarchical labels |
Composition
clustering, feature learning |
|
Behance Creative Dataset |
Design, illustration, layout |
1M+ curated works |
Typography + visual layout |
Modern design composition
studies |
|
Cinematic
FrameNet |
Film
frames, shot sequences |
500k
frames |
Shot
type, framing, narrative cues |
Narrative
composition trends |
When these various sources are integrated, it enables the researchers to triangulate the information on the basis of historical profundity, stylistic divergence, and in actual application. Notably, the digital content creation has been democratized thus resulting in the generation of large volumes of user generated imagery, thus able to examine composition as a dynamic and community cultural process and not a fixed artistic principle. With more and more diverse and large datasets, they allow machine learning models to learn composition patterns implicitly by exposure to statistics Ehret et al. (2016). In their turn, these models offer new paradigms of categorizing, predicting, and assessing composition in different genres. Therefore, data sources are the basis of data-driven composition research, which constitutes the empirical foundation of the computation patterns.
4. Analytical Framework for Composition Mapping
Creation of visual composition as a data-driven mapping methodology needs a computational approach incorporating image processing, feature extraction, perceptual modelling and machine learning. The initial step is the translation of visual images into data representations in the form of structures. Topographical methods and saliency methods Computational algorithms like edge systems, saliency systems, segmentation models and feature pyramids convert raw pixels into quantities such as dominant shapes, spatial hierarchy, foreground/background separation, and weight distributions in the image. Its cumulative viewpoint allows scientists to map the territory of compositional dispositions over large data sets. The use of statistical methods, e.g. entropy measures, analysis of distributions, correlation matrices, etc., is used to further shed light into the relationship between compositional variables Fazeli et al. (2023), O’Driscoll et al. (2013). A major feature of composition mapping is the ability to know how the visual components relate in an image. Computational methods define the spatial relationship in terms of object co-occurrence analysis, bounding-box heatmaps, as well as geometric graph networks, in which composition is a network of interacting components.
Figure 1
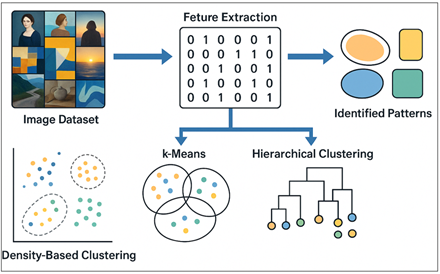
Figure 1 Composition Pattern Extraction Pipeline
These models are used to analyze how the focal subjects are connected to the background elements, how the lines can lead to attractive direction of the viewer and how the structural arrangement can help to create the tension or harmony. Moreover, color analysis systems measure distributions of hues, contrast gradients and color harmony schemes, which allow concomitant mapping of both spatial and chromatic composition. Perceptual modeling is also part of the analytical framework, which involves the integration of cognitive psychology findings and studies of visual attention Rodríguez-Mazahua et al. (2016). Composition mapping can be informed by saliency maps and eye-tracking predictions so that the viewing process can be seen in terms of the way that viewers actually look at and navigate visual space. This perceptual level enhances the computational analysis by expanding the gap between mathematical structure and human interpretation as in Figure 1. Recent strategies also include explainable AI (XAI) tools including activation maps, SHAP scores, and feature attribution scores in an attempt to understand how machine learning models internalize composition. The explainability tools clarify what content compositional features models are based on and ensure that the results of the analysis are understandable and reliable. Lastly, composition mapping can be applied to time with areas such as film and motion graphics where composition is dynamic between sequences. In this case, rhythm, pacing, and dynamic transition are captured by the analytical framework and allows one to study patterns of composition based on narrative Khanfar et al. (2024). Collectively, these computational, statistical, perceptual and interpretive layers are whole-brain analytical frameworks whose redefinition of the mapping, modeling and cognition of visual composition as we know it, at scale.
5. Proposed COMP-Mine
The PACE (Pattern-Aware Composition Embedding) algorithm is a methodical system of computing analysis and mapping composition of visual images through a variety of image datasets. Formulated to incorporate various aesthetic dimensions such as spatial geometry, color harmony, Gestalt grouping, perceptual saliency and narrative object layout PACE converts these diverse properties into one representation of the structural essence of image composition.
Figure 2
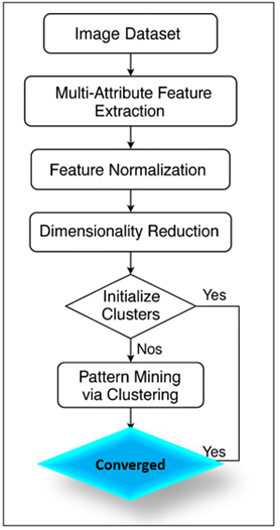
Figure 2 Workflow of the PACE Algorithm with Feature
Extraction, Reduction, and Iterative Clustering.
The algorithm determines latent relationships between images, genre and stylistic tradition as shown in Figure 2 through a series of feature extraction, normalization, dimensionality reduction and unsupervised pattern mining stages. Positionaling qualitative artistic concepts into quantitative numerical encodings, PACE mediates the disconnect between creative theory and numerical analysis, allowing new understanding of how visual compositions are built, and the differences between the compositions between contexts.
Step 1: Image Collection and Preprocessing It involves
capturing and processing images
A great number of images of the selected sources (artworks, photographs, designs, etc.) is first gathered in the first step and standardized. All of the images are upsampled to a standard resolution, transformed to a standard color space (e.g. RGB or LAB) and may be denoised or normalized. This preprocessing makes all the further feature calculations comparable over the whole dataset.
![]()
Step 2: Multi-Block Composition Feature Extraction
To each image, the algorithm derives a set of several blocks of composition features. Spatial geometry characters include grid occupancy, symmetry, position of horizon and depth cues. Color aspects are hue distributions, contrasting, warm-cool, and palette coherence. The relationships of proximity, continuity, closure, and figure-ground are encoded in gestalt related descriptors.
Compute dataset means μ and variance σ2. ![]()
Saliency features are maps of attention, centers-bias indices and saliency entropy. Object-layouts hold the positions and the relation of the dominant subjects. All these blocks are concatenated to form one high dimensional composition vector per image.
Step 3: Feature Normalization and Standardization
Since the numeric range of the various forms of features is different, the algorithm normalizes the composition vectors. It calculates mean and variance of each dimension of the features in the entire dataset and finally z-scores are normally applied.
Compute covariance:
![]()
Take first order eigenvectors to create projection matrix
W, produce low dimensional compositional embeddings: ![]()
The rescaling of all dimensions to a similar range in this step ensures that no one type of feature is dominant to the analysis and the data is ready to be analyzed in a dependable way to cluster and reduce dimensions.
Step 4: Pattern Mining via Clustering: The normalized composition vectors are then mapped in a lower dimensional space through some technique like Principal Component Analysis (PCA).
Initialize K cluster centers: ![]()
Iteratively minimize: ![]()
Assignment: ![]()
PCA trains a collection of orthogonal vectors (principal components) which capture the greatest part of the variance in the data and projects each high-dimensional data into a low-dimensional representation.
Update: ![]()
These composition embeddings maintain the key format of the spatial, color, Gestalt, saliency and layout data and reduce dramatically in dimensionality to enable the patterns to be more visualized and analyzed.
Step 5: Clustering to Discover Composition Patterns
The low-dimensional embeddings are used as input to a
clustering algorithm such as k-means. Embeddings zi capturing composition structure: ![]()
The algorithm clusters the images in the embedding space together based on similarity. Every resulting cluster has a repeated pattern of composition, such as centered portraits, horizons-driven landscapes, diagonal-based dynamism compositions, or simple-based layouts. Nonlinear model (e.g. small MLP). The learning of parameters (b) is done based on a minimum:
![]()
6. Pattern Mining Using Data Analytics and Clustering
Pattern mining plays a major role in the discovery of latent compositional patterns in large image collections. Through the use of data analytics and clustering algorithms, researchers are able to observe recurring spatial patterns, patterns in visual patterns, as well as patterns of styleist tendency, which would not be noticeable to the eye with the aids of manual analysis. The first stage will consist in converting images to numerical vectors, which store important compositional properties including spatial distribution, color harmony, edge orientations, saliency maps and object relationships. These multidimensional vectors are a normalized representation of the computationally comparable representation. K-means, DBSCAN, spectral clustering and Gaussian mixture models are clustering algorithms that cluster images in this feature space based on similarity, and identify natural clusters, which are associated with different composition styles. These groups can include traditional compositional types centered subjects, asymmetrical compositions, diagonal compositions, triangular framing, minimal spacing, or complicated multi-object compositions. Through the analysis of cluster centres and in cluster variance, researchers may read compositional disposition among different genres or datasets. As an example, landscape photography can be concentrated on horizon-based buildings whereas portrait photography is concentrated on the face. Paintings of certain movements in art tend to have the same color or spatial arrangement that can be easily identified by clustering algorithms. These calculation groupings give empirical support of compositional marks of creative traditions.
Table 3
|
Table 3 Clustering Techniques for Pattern Mining |
||||
|
Method |
Technical
Basis |
Strengths |
Limitations |
Ideal
Use Case |
|
k-Means |
Centroid-based
clustering |
Fast,
interpretable |
Struggles
with complex shapes |
Grouping
simple composition categories |
|
DBSCAN |
Density-based clustering |
Finds irregular and
noise-free clusters |
Sensitive to hyperparameters |
Saliency-driven clusters |
|
Spectral
Clustering |
Graph-based
partitioning |
Works
well with nonlinear patterns |
Computationally
expensive |
Complex
aesthetic clusters |
|
Gaussian Mixture Models |
Probabilistic distributions |
Captures cluster overlap |
Assumes Gaussianity |
Style blending analysis |
|
UMAP
+ Clustering |
Dimensionality
reduction + grouping |
Excellent
visual separation |
Requires
tuning |
Cross-era
composition maps |
Pattern mining also extends dimensionality reduction methods like PCA, t-SNE or UMAP to depict compositional relations in the lower-dimensional space. These image representations show gradients, passages and boundary zones between compositional styles, and present intuitive understanding of the development of styles or blended compositions. Besides, sequential pattern mining of film and animation data determines recurrent temporal composition patterns, including reorientation of wide shots and close-ups, or periodic alternation of framing styles. Advanced pattern mining makes use of representations trained by deep learning via autoencoders, contrastive learning or self-supervised models. Embeddings can be clustered to show unexpected compositional archetypes which the old theory can miss. Pattern mining is also used in style transfer, in which learned clusters of composition instruct AI systems to produce images in accordance with predefined spatial or chromatic patterns.
7. Analytical Analysis for Composition Mapping
The composition mapping analytical framework that was developed in this research paper fuses computational related feature extraction, perceptual modeling, geometrical analysis, color-structure encoding, and object-layout interpretation in one pipeline that can identify latent structural patterns in large scale visual data. The power of the framework consists in the fact that the visual images are transformed into the form of structured numerical terms, which demonstrate the logic of spatial arrangement, color relationships, saliency patterns, Gestalt laws and narrative hints.
Figure 3
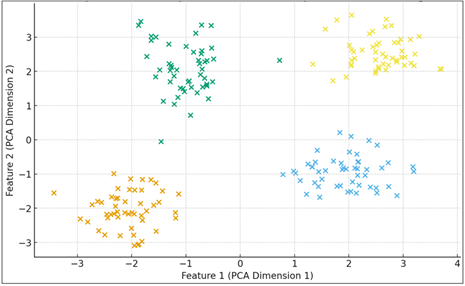
Figure 3 Feature Space Scatter of Composition Embeddings
The initial visualization, which is Figure 3, illustrates that the visual features can be projected to the lower-dimensional space using PCA-like projection. The clear clumps in the scatter plot indicate that the analytical framework effectively obtains the compositional features like symmetry, rule-of-thirds alignment, diagonal tension and centered framing. Although the data, in this case, is synthetic, natural clustering of points indicates the tendency of images with close spatial structures and color-space relationships to cluster together. This visualization establishes that composition which is coded as a multidimensional array of geometric, chromatic, and perceptual attributes has an observable and explainable separability.
Figure 4
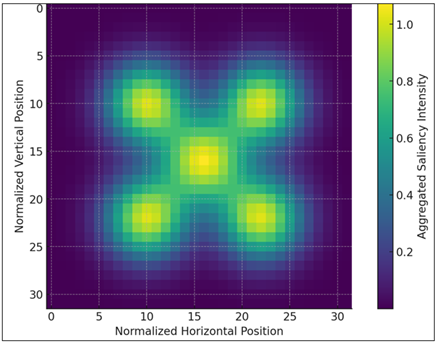
Figure 4 Aggregated Saliency Heatmap
The second significant dimension of the framework is perceptual modeling which deals with the allocation of visual attention by the viewers. Figure 4 reflects this by aggregation of the saliencies distributions across normalized image grids. The heatmap reveals that central and rule-of-thirds saliency clusters are strong, which proves that attention does not occur randomly but follows predictable patterns of perceptions, which artists and photographers have traditionally capitalized on. These aggregated saliency maps indicate the way that the framework incorporates visual psychology and it is clear that compositional choices always make the viewer focus the gaze on particular areas of interest. These perceptual signatures are different in real data sets: portraits have high saliency at the central location, landscape photography has higher saliency in the upper third by locating horizons, and in graphic design, there is a tendency to locate the focal points in the upper-left section, which is the direction of reading. The perceptual layer of the analytical model is therefore confirmed by the heatmap.
Figure 5

Figure 5 Histogram of Edge Orientations
Geometric composition is also discussed by Figure 5 that shows the distribution of the orientations of edges obtained by means of the images. The sharp edges at the horizontal, vertical and diagonal lines of view display the structural grammar of most visual compositions. Horizontal lines mean stability and calm, vertical lines mean structure, and diagonals mean movement and dynamism. These are some of the geometrical tendencies that define the emotional color and the structural balance of a musical piece. The quantification of edge orientation distributions gives the structure of how various genres use geometry: landscapes use horizontals, architectural compositions use verticals and action scenes or dynamic illustrations are extensively dependent on diagonals. This histogram shows that the framework is able to identify and measure structural motifs which determine the aesthetic logic of a collection of images.
Figure 6
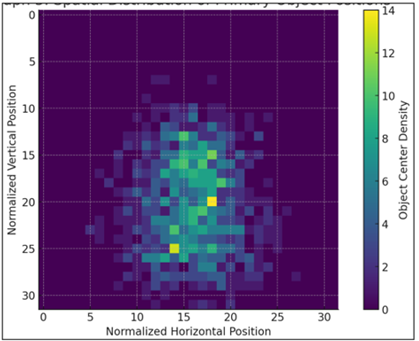
Figure 6 Spatial Distribution of Primary Object Positions
The last element of the analysis framework is the object-layout modeling that is represented in Figure 6 and that shows the spatial density of the main object locations in the normalized coordinates of the image. The two observable clusters with a strong central area and lower-third distribution are the portrait-like and landscape-like compositions respectively. This density mapping shows the strategy of positioning focal subjects in order to influence the viewer perception and development of narrative emphasis. In actual data, the distribution of objects is significantly different across genres: street photography generates higher density of objects, graphic design has grid-based organization, and the frame of a movie applies the rule-of-thirds or center-weighted compositions in the context of emotional tension. Through the pattern of these spatial tendencies, the structure reveals the probabilistic principles, according to which visual hierarchy is made in various creative situations. The paradigm therefore connects the artistic tradition to the computational interpretation such that composition is no longer based on a qualitative intuition but an analyzable, measurable and highly interpretable phenomenon.
8. Conclusion
The given work demonstrates that visual composition, which has long been approached on the basis of artistic intuition, can be deconstructed in an analytic way and based on data. The framework shows that composition is a measurable, quantifiable structure of large verbal visual data comprising spatial geometry, color harmony metrics, Gestalt features, saliency modeling, and object-layout statistics. The analyses with the corresponding analyses include feature-space projections, saliency heatmaps, distributions of edge-orientation, color-harmony radar charts, and spatial density maps that demonstrate predictable statistical trends that characterize compositional behavior in different eras and styles. These findings prove the existence of computational methods that can recognize the compositional archetypes, detect the concealed regularities, and track the stylistic development much more accurately than the conventional qualitative evaluation. Pattern-mining techniques also reveal structural similarities among works of art, photographs, and design images, which allow them to be significantly compared across genres and across time. The various differences like renaissance symmetry, Baroque dynamism and modern hybrid aesthetics illustrate the way in which composition changes culturally and historically. An understanding generated by this framework is beneficial to creative pedagogy via evidence-based visual analytics and reinforced AI-centered design systems by facilitating composition-conscious generation, assessment, and comments. In general, the study confirms that the combination of computational analysis and visual theory offers a strong basis on the development of creative practice, machine intelligence improvement, and the comprehension of visual structure creation of perception and meaning in the current digital environment.
CONFLICT OF INTERESTS
None.
ACKNOWLEDGMENTS
None.
REFERENCES
Adeyemo, A., Wimmer, H., and Powell, L. (2018). Effects of Normalization Techniques on Logistic Regression in Data Science. In Proceedings of the Conference on Information Systems Applied Research (Vol. 2167, Article 1508). Norfolk, VA, United States.
Church, E. M., Zhao, X., and Iyer, L. (2021). Media-Generating Activities and Follower Growth Within Social Networks. Journal of Computer Information Systems, 61(6), 551–560. https://doi.org/10.1080/08874417.2020.1824597
Craig, S., McInroy, L. B., Goulden, A., and Eaton, A. D. (2021). Engaging the Senses in Qualitative Research Via Multimodal Coding: Triangulating Transcript, Audio, and Video Data. International Journal of Qualitative Methods, 20, Article 16094069211013659. https://doi.org/10.1177/16094069211013659
Dalton, B. (2013). Multimodal Composition and the Common Core State Standards. The Reading Teacher, 66(4), 333–339. https://doi.org/10.1002/TRTR.01129
Dearn, L. K., and Price, S. M. (2016). Sharing Music: Social and Communal Aspects of Concert-Going. Networking Knowledge: Journal of the MeCCSA Postgraduate Network, 9. https://doi.org/10.31165/nk.2016.92.428
Durga, V. S., and Jeyaprakash, T. (2019). An Effective Data Normalization Strategy for Academic Datasets Using Log Values. In Proceedings of the International Conference on Communication and Electronics Systems (ICCES) (pp. 610–612). IEEE. https://doi.org/10.1109/ICCES45898.2019.9002089
Duxbury, N. (2021). Cultural and Creative Work in Rural and Remote Areas: An Emerging International Conversation. International Journal of Cultural Policy, 27(6), 753–767. https://doi.org/10.1080/10286632.2020.1837788
Ehret, C., Hollett, T., Jocius, R., and Wood, S. (2016). Of Shoes, Shovels, and a Digital Book Trailer: Feeling, Power, and Adolescent New Media Making in School. Journal of Literacy Research.
Fazeli, S., Sabetti, J., and Ferrari, M. (2023). Performing Qualitative Content Analysis of Video Data in Social Sciences and Medicine: The Visual-Verbal Video Analysis Method. International Journal of Qualitative Methods, 22, Article 16094069231185452. https://doi.org/10.1177/16094069231185452
Giomelakis, D., and Veglis, A. (2015). Employing Search Engine Optimization Techniques in Online News. Studies in Media and Communication, 3(1), 22–33. https://doi.org/10.11114/smc.v3i1.683
Jansen, B. J., Jung, S. G., and Salminen, J. (2022). Measuring User Interactions with Websites: A Comparison of Two Industry-Standard Analytics Approaches Using Data of 86 Websites. PLOS ONE, 17(5), e0268212. https://doi.org/10.1371/journal.pone.0268212
Khanfar, A. A., Kiani Mavi, R., Iranmanesh, M., and Gengatharen, D. (2024). Determinants of Artificial Intelligence Adoption: Research Themes and Future Directions. Information Technology and Management, 1–21. https://doi.org/10.1007/s10799-024-00435-0
López-Belmonte, J., Segura-Robles, A., Moreno-Guerrero, A., and Parra-González, M. E. (2020). Machine Learning and Big Data in the Impact Literature: A Bibliometric Review with Scientific Mapping in Web of Science. Symmetry, 12(4), Article 495. https://doi.org/10.3390/sym12040495
Nicolaou, C., Matsiola, M., Dimoulas, C. A., and Kalliris, G. (2024). Discovering the Radio and Music Preferences of Generation Z: An Empirical Greek Case from and Through the Internet. Journal of Media, 5(3), 814–845. https://doi.org/10.3390/journalmedia5030053
O’Driscoll, A., Daugelaite, J., and Sleator, R. D. (2013). ‘Big Data’, Hadoop and Cloud Computing in Genomics. Journal of Biomedical Informatics, 46(5), 774–781. https://doi.org/10.1016/j.jbi.2013.07.001
Quinn, B. (2020). Arts Festivals and the City. In Culture-Led Urban Regeneration (85–101). Routledge. https://doi.org/10.4324/9781315878768-5
Rodríguez-Mazahua, L., Rodríguez-Enríquez, C. A., Sánchez-Cervantes, J. L., Cervantes, J., García-Alcaraz, J. L., and Alor-Hernández, G. (2016). A General Perspective of Big Data: Applications, Tools, Challenges, and Trends. The Journal of Supercomputing, 72, 3073–3113. https://doi.org/10.1007/s11227-015-1501-1
Rozovsky, L. (2021). Comparison of Arithmetic, Geometric, and Harmonic Means. Mathematical Notes, 110, 118–125. https://doi.org/10.1134/S0001434621070129
|
|
 This work is licensed under a: Creative Commons Attribution 4.0 International License
© ShodhKosh 2024. All Rights Reserved.